Counter-IED Market Size and Share
Market Overview
| Study Period | 2020 - 2031 |
|---|---|
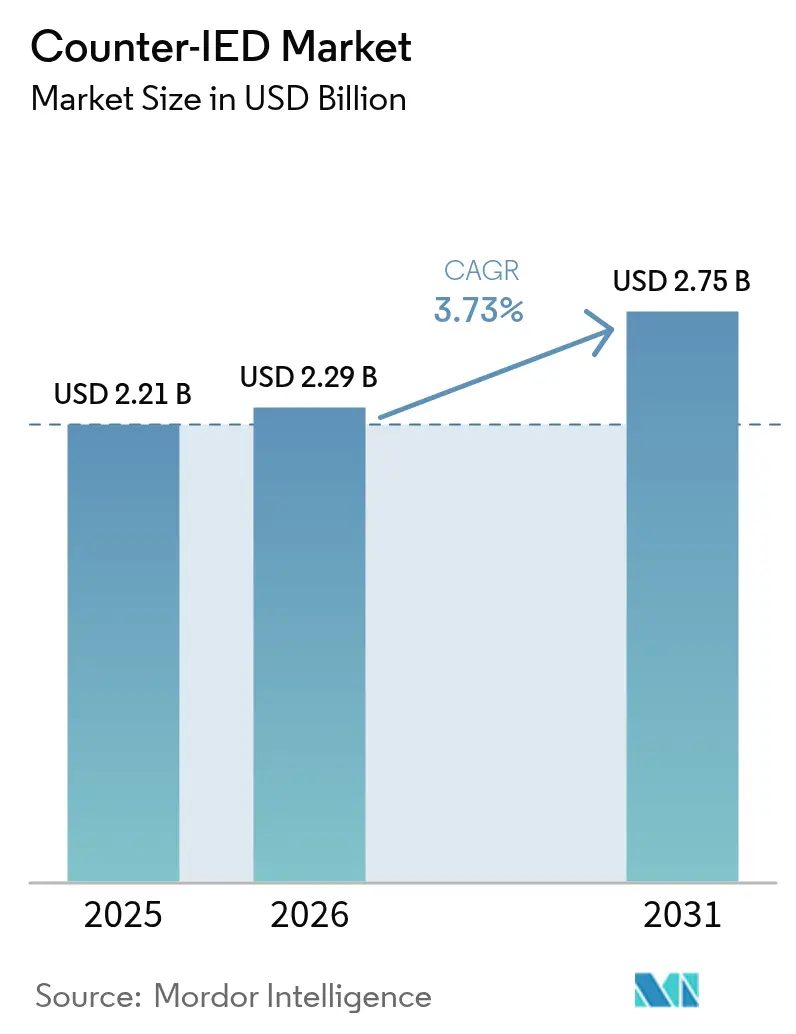
| Market Size (2026) | USD 2.29 Billion |
| Market Size (2031) | USD 2.75 Billion |
| Growth Rate (2026 - 2031) | 3.73% CAGR |
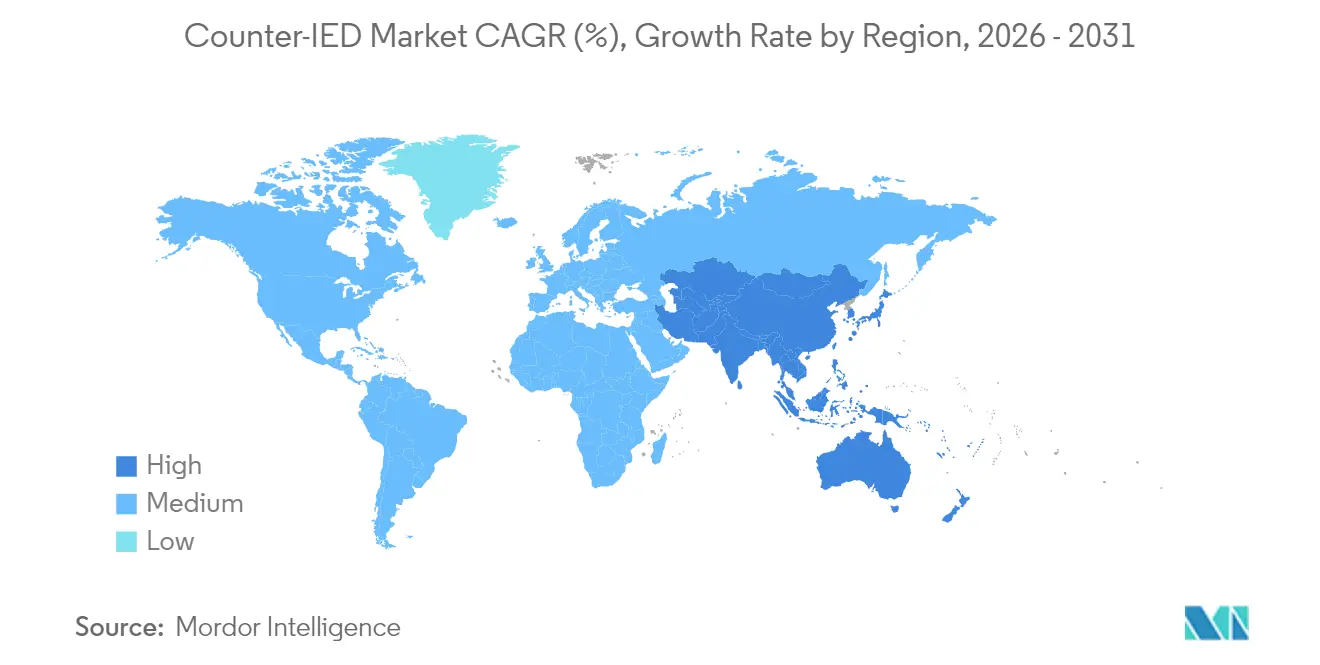
| Fastest Growing Market | Asia Pacific |
| Largest Market | North America |
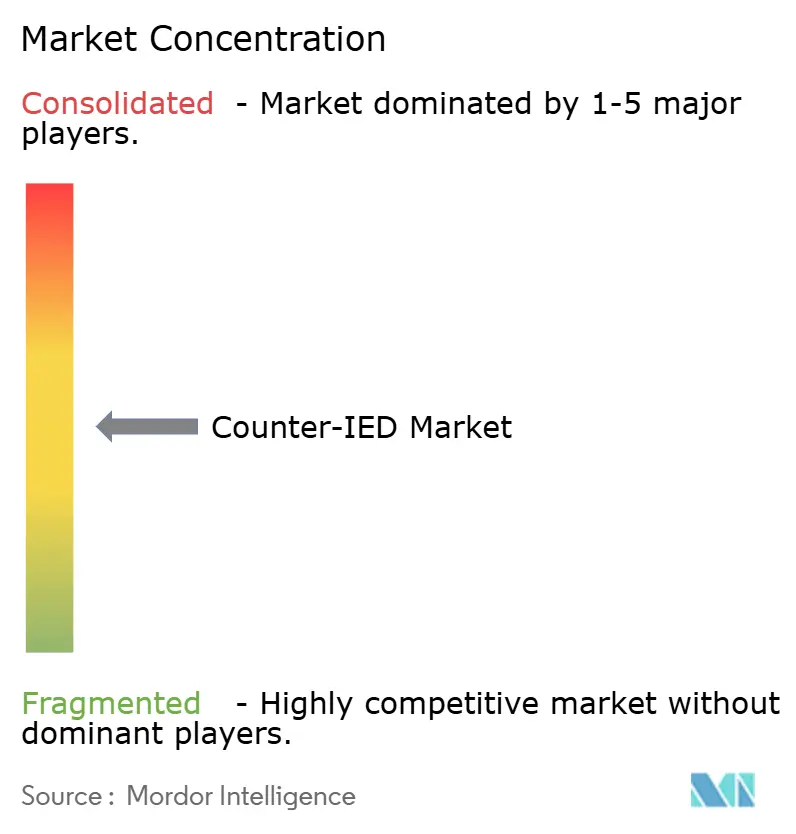
| Market Concentration | Medium |
Major Players *Disclaimer: Major Players sorted in no particular order Image © Mordor Intelligence. Reuse requires attribution under CC BY 4.0. | |
Counter-IED Market Analysis by Mordor Intelligence
counter-IED market size in 2026 is estimated at USD 2.29 billion, growing from 2025 value of USD 2.21 billion with 2031 projections showing USD 2.75 billion, growing at 3.73% CAGR over 2026-2031. Heightened asymmetric‐warfare preparedness, rising defense appropriations, and the growing convergence between counter-UAS and counter-IED technologies keep demand elevated, while spectrum-management bottlenecks and high GaN component prices temper short-term deployment rates. North America maintains spending leadership, but Indo-Pacific modernization programs are closing the gap. Detection capabilities, especially multi-sensor AI-enabled suites, account for the bulk of current procurement, yet rapid growth in neutralization technologies—directed-energy jammers and robotics—signals a strategic pivot toward active defeat solutions. Platform flexibility also matters; buyers increasingly specify vehicle-agnostic jamming kits that migrate easily from manned tactical trucks to unmanned ground vehicles. Competitive intensity is moderate: defense primes hold technology depth, but specialist firms exploiting AI, microwave weapons, and autonomous heavy equipment win share as armed forces pursue faster innovation cycles.[1]Source: Nan Tian, “World Military Spending Reaches New Record High,” Stockholm International Peace Research Institute, sipri.org
Key Report Takeaways
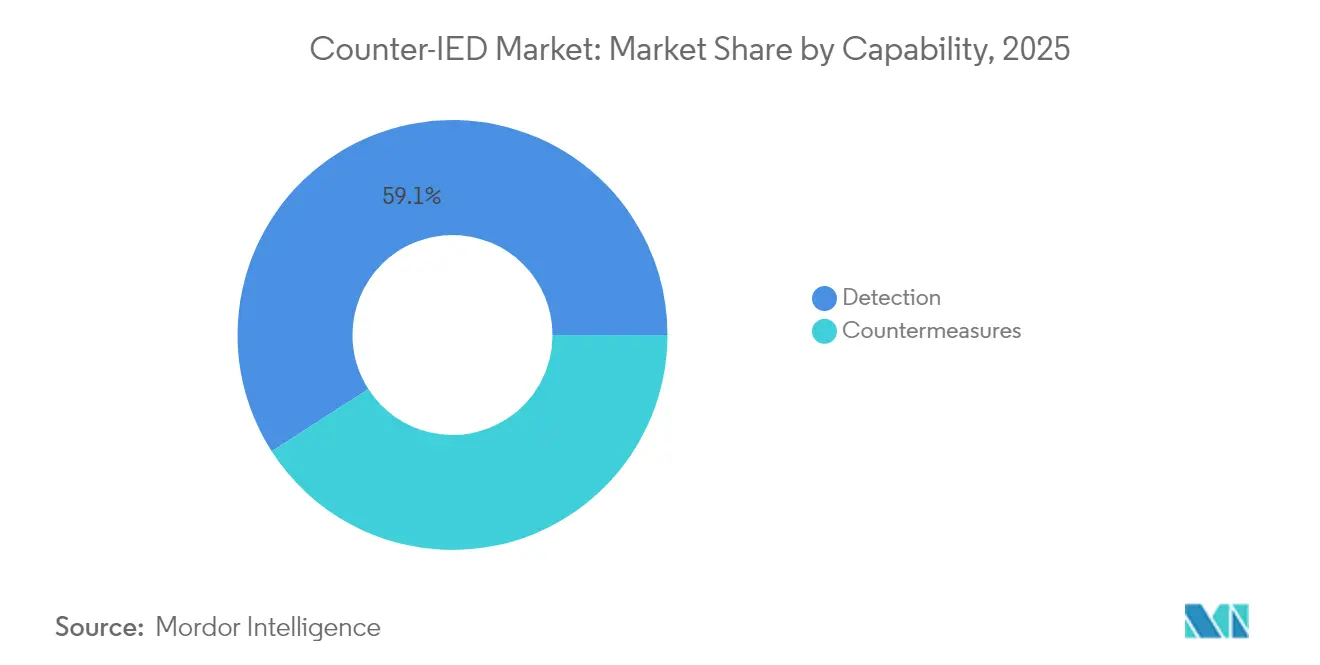
- By capability, detection systems held 59.10% of the counte- IED market share in 2025, while countermeasures are projected to expand at a 4.59% CAGR through 2031.
- By deployment, vehicle-mounted platforms led with 66.60% revenue share in 2025; aerial-borne pods and payloads are forecasted to advance at a 5.18% CAGR to 2031.
- By end user, the military segment accounted for 86.10% of the counter-IED market size in 2025, whereas homeland security demand is rising fastest at 4.78% CAGR..
- By technology, electronic warfare solutions commanded a 46.40% share of the counter-IED market in 2025; robotic and autonomous systems exhibit the highest projected CAGR at 5.55% to 2031.
- By geography, North America represented 49.30% of 2025 revenue, while Asia-Pacific is poised for the quickest growth at 5.05% CAGR through 2031.
Note: Market size and forecast figures in this report are generated using Mordor Intelligence’s proprietary estimation framework, updated with the latest available data and insights as of 2026.
Global Counter-IED Market Trends and Insights
Drivers Impact Analysis*
| Driver | (~) % Impact on CAGR Forecast | Geographic Relevance | Impact Timeline |
|---|---|---|---|
| Rising defense-budget allocation to asymmetric warfare preparedness | +1.2% | Global (notably North America, Europe, Asia-Pacific) | Medium term (2-4 years) |
| Accelerated fielding of manned–unmanned teaming C-IED assets | +0.8% | North America and Europe; spill-over to APAC | Long term (≥ 4 years) |
| Rapid advances in AI-enabled multi-sensor fusion for IED detection | +0.9% | Global | Short term (≤ 2 years) |
| Growing demand for vehicle-agnostic CREW kits across allied forces | +0.7% | NATO members; expanding to partners | Medium term (2-4 years) |
| Convergence of C-IED and C-UAS architectures | +0.6% | Global | Medium term (2-4 years) |
| National regulations on precursor-chemical tracking | +0.4% | North America, Europe, selective APAC | Long term (≥ 4 years) |
| Source: Mordor Intelligence | |||
Rising defense-budget allocation to asymmetric warfare preparedness
Defense ministries now allocate larger slices of rising budgets to irregular-threat capabilities. The US FY 2026 request tops USD 1.01 trillion, explicitly funding counter-terrorism and demining technologies. European NATO members that exceeded the 2% of GDP defense benchmark in 2024 continue to channel incremental funds toward C-IED programs, influenced by operational lessons from Ukraine. East Asian expenditure reached USD 411 billion in 2023 and is still climbing, translating into fresh tenders for detection radars, handheld disruptors, and route-clearance UGVs. As budgets grow, procurement agencies emphasize open architectures and rapid technology refresh to stay ahead of proliferating homemade devices.
Accelerated fielding of manned–unmanned teaming (MUM-T) C-IED assets
MUM-T doctrine has moved from prototypes to field deployment. The US Army’s Apache–Shadow–Gray Eagle experiments demonstrated autonomous convoy route-clearance, validating interoperable data links for IED defeat missions. Israel Defense Forces now operate RobDozer bulldozers and M113-based autonomous systems for high-risk neutralization, cutting human exposure on Gaza border routes. European ground forces follow suit through the Franco-British Maritime Mine Counter Measures and ELROB trials that showcased Rheinmetall’s UGV convoy leader. The resulting demand favors scalable control software and standardized payload bays compatible with mixed manned and robotic teams.
Rapid advances in AI-enabled multi-sensor fusion for IED detection
Defense labs have paired machine-learning classifiers with ground-penetrating radar, EO/IR cameras, and EM sensors to lift detection probability while slashing false alarms. During high-throughput checkpoint trials, DHS pilots showed that AI fusion lowered positive-alarm rates by 30%. The Army’s C5ISR Center reports that fusing metadata from multiple sensor pods gives route-clearance platoons real-time predictive threat heat-maps, shrinking decision cycles from minutes to seconds. Commercial innovators such as APSTEC scale the concept to civil portals that screen 3,000 people per hour without operator intervention.
Growing demand for vehicle-agnostic CREW kits across allied armed forces
Coalition operations exposed the inefficiency of bespoke jammers fixed to a single vehicle type. New modular Counter-Radio Controlled IED Electronic Warfare (CREW) kits, exemplified by Northrop Grumman’s JCREW Increment 1b, bolt onto tactical trucks, MRAPs, or UGVs with minimal wiring changes.[2]Source: Northrop Grumman, “JCREW Counter-IED Systems,” northropgrumman.com NATO standardization documents now incorporate common power connectors and software-defined radios, allowing allies to swap spares in theater. Procurement offices endorse this flexibility because it reduces lifecycle cost and accelerates spares pooling during joint operations.
Restraints Impact Analysis*
| Restraint | (~) % Impact on CAGR Forecast | Geographic Relevance | Impact Timeline |
|---|---|---|---|
| High capital cost of EW-grade GaN RF front-ends | -0.8% | Global | Short term (≤ 2 years) |
| Spectrum-management bottlenecks limiting CREW power | -0.6% | Global (dense spectrum zones) | Medium term (2-4 years) |
| Complex integration with legacy battle-management systems | -0.5% | North America, Europe | Medium term (2-4 years) |
| Export-license delays under Wassenaar Arrangement | -0.3% | Global | Long term (≥ 4 years) |
| Source: Mordor Intelligence | |||
High capital cost of EW-grade GaN RF front-ends
Gallium-nitride power amplifiers let CREW transmitters cover wide 5G-era threat envelopes because GaN offers higher electron mobility and thermal efficiency than older gallium-arsenide parts, allowing smaller devices to push kilowatt-class output across multioctave bands. The downside is manufacturing: GaN layers are grown on costly silicon-carbide substrates in metal-organic chemical vapor deposition reactors that still run single-digit wafer yields, so each die that survives probe testing carries a premium price. Limited trusted-foundry capacity inside the United States and Europe compounds the problem, forcing primes to compete with commercial telecom buyers for the same epitaxy slots, which keeps average selling prices well above USD 20 per watt in the L-band. Northrop Grumman engineering briefs caution that unless new 150 mm reactors and automated back-end lines come online by 2027, volume buys larger than brigade scale could slip a year or more for smaller allies that lack multiyear funding lines, prompting some defense ministries to hold legacy silicon jammers longer than planned.
Spectrum-management bottlenecks limiting CREW jamming power levels
Civil 5G roll-outs now dominate the 3.3–4.2 GHz mid-band and large parts of the 700 MHz and 26 GHz ranges, which militaries previously treated as discretionary training spectrum. To protect commercial services, national regulators working through the ITU and bodies such as the European Conference of Postal and Telecommunications Administrations impose power spectral-density caps and force electronic-warfare units to leave guard channels, which shortens effective standoff range when jammers operate near high-rise glass and steel that already attenuate signals. Field commanders in megacities face a trade-off: radiate enough energy to burn through urban clutter and risk telecom interference fines, or accept reduced neutralization bubbles that leave troops within insurgent trigger distances. The European Defence Agency recommends agile, directional antennas and real-time spectrum-sensing firmware so jammers can hop away from public networks in milliseconds. Still, these mitigation features raise system cost and complicate coalition interoperability tests.[3]Source: European Defence Agency, “Spectrum Management Challenges in Electromagnetic Operations,” eda.europa.eu
*Our forecasts treat driver/restraint impacts as directional, not additive. The impact forecasts reflect baseline growth, mix effects, and variable interactions.
Segment Analysis
By Capability: Detection Dominance Drives Current Deployments
Detection solutions generated the largest slice of the counter-IED market revenue in 2025, equal to a 59.10% counter-IED market share, as commanders prioritized finding bombs before convoys rolled. Ground-penetrating radar paired with high-resolution synthetic-aperture algorithms now distinguishes disturbed soil at a walking pace, while passive RF sniffers flag trigger circuits. The counter-IED market size for countermeasures is projected to rise 4.59% annually to 2031 as doctrine shifts toward active defeat.
Demand for countermeasures centers on wideband CREW transmitters covering 20 MHz to 6 GHz and directed-energy weapons such as Iron Beam lasers that neutralize threats at the speed of light. Robotics adds another layer: armored EOD UGVs like IAI RobDozer employ 15-ton plow blades and remote-controlled disruptors, enabling route-clearance in hostile terrain without exposing sappers.


By Deployment: Vehicle Integration Reflects Operational Priorities
Vehicle-mounted systems accounted for 66.60% of the counter-IED market size in 2025, underpinned by convoy protection doctrines that embed jammers, cameras, and radars onto tactical trucks. The approach delivers on-board power and ballistic shielding, making it the default for brigade movement and logistics resupply.
Growth momentum, however, is shifting skyward. Aerial pods—whether slung under manned helicopters or Group 4 UAVs—are forecast to post a 5.18% CAGR, the fastest in the deployment category. Early US Navy ALMDS mine-detection pods and Army NERO EW payloads illustrate the appeal: wide area coverage, minimal exposure to roadside ambush, and quick redeployment to new theaters. Dismounted troops still rely on man-portable disruptors such as the 11 kg GMJ9500 to secure cordon searches in urban alleys.
By End User: Military Applications Drive Current Demand
Armed forces generated 86.10% of 2025 revenue, a testament to two decades of combat experience against improvised threats. Procurement agencies demand ruggedized electronics rated for sand, salt-spray, shock, and encrypted communications that mesh with coalition networks. Foreign Military Sales (FMS) pipelines extend the same US-approved kits to partner nations, maintaining commonality for joint exercises.
Civil agencies now accelerate purchases, lifting the homeland security segment's CAGR to 4.78%. Border-inspection fleets adopt Eagle M60 high-energy scanners to detect bulk explosives in cargo trucks, while metro police install walk-through AI portals able to process 900 passengers per lane per hour without stopping flow. The civilian segment thus broadens supplier addressable markets beyond traditional defense primes.

By Technology: Electronic Warfare Leadership Faces Autonomous Challenge
Electronic warfare (EW) solutions retained 46.40% of 2025 revenue share on the strength of decades-old RF-jamming doctrine and maturing software-defined radio architectures. Tunable notches safeguard friendly comms, and auto-detect functions classify new threat waveforms in seconds. Yet performance ceilings loom as adversaries hop into mmWave bands.
Robotic and autonomous platforms show the sharpest climb—5.55% CAGR—thanks to falling sensor prices and superior survivability. The Israeli military has logged more than 40,000 drone and rocket interceptions using IAI radars paired with autonomous effectors, a reference that persuades export buyers. Manned–unmanned teaming, therefore, reshapes the technology mix, integrating autopilots, LIDAR, and AI-enabled obstacle avoidance into what used to be purely EW-centric procurements.
Geography Analysis
North America represented 49.30% of the counter-IED market revenue in 2025, sustained by a USD 1 trillion defense budget and deep operational know-how from Iraq and Afghanistan. The DoD pushes multi-domain protection prototypes into user evaluations, trimming acquisition cycles and preserving regional leadership. Canada’s border-security upgrades and Mexico’s focus on organized crime IEDs add incremental demand.
The Asia-Pacific counter-IED market exhibits a projected 5.05% CAGR through 2031, the fastest zone, propelled by territorial flashpoints in the South and East China seas. India invests in Israeli radars, roadside jammers, and robotic mine plows under emergency procurement rules, while Australia funds unmanned route clearance as part of its Defense Strategic Review implementation. ASEAN states adopt lower-cost man-portable disruptors to protect urban transit hubs, broadening the regional customer base. Europe sustains buying momentum through NATO’s Enhanced Forward Presence and accelerated rearmament triggered by the war in Ukraine. Multinational programs in Brussels coordinate test protocols and life-cycle support, lifting smaller member states that lack Indigenous C-IED labs. In the Middle East and Africa, procurement remains episodic, but oil-export gains allow Gulf states to purchase top-tier directed-energy systems, while UN peacekeeping missions in the Sahel fuel demand for rugged detection kits.

Competitive Landscape
The counter-IED market remains moderately fragmented. Top US, Israeli, and European defense primes control the broadest portfolios, yet no single vendor exceeds 25% global share. Lockheed Martin secured USD 10 billion in missile and protection awards in Q1 2025, fortifying its lead in integration expertise. L3Harris, meanwhile, leverages rapid-iteration culture to win back-to-back VAMPIRE orders covering US Army, Marine Corps, and Special Operations Command needs for expeditionary CUAS/C-IED coverage.
Specialists exploit technology gaps. Epirus commercialized solid-state microwave arrays that fit pickup-truck payload limits, underpricing legacy high-power tube-based jammers and capturing evaluation contracts with the Marine Corps. Israeli Aerospace Industries packages its Rada-based detection plus robotic bulldozers in turnkey offerings marketed to Asia and Latin America, converting operational credibility into export licenses.
Partnerships and acquisitions reshape portfolios. Chemring’s USD 90 million purchase of General Dynamics’ Detection Systems arm adds trace-chemical analytics to an EW-heavy catalog. Diehl Defence and Elbit Systems pool assets to co-produce precision rockets in Germany, embedding counter-IED fuzing options that align with European offset rules. Start-ups benefit, too: AI software houses provide plug-ins for sensor fusion and license code to prime contractors hungry for rapid upgrades.
Counter-IED Industry Leaders
Lockheed Martin Corporation
Northrop Grumman Corporation
Thales Group
Chemring Group PLC
L3Harris Technologies, Inc.
- *Disclaimer: Major Players sorted in no particular order

Recent Industry Developments
- June 2025: The NATO Istanbul Cooperation Initiative Regional Centre (NIRC) in Kuwait City hosted a Mobile Training Team (MTT) from Allied Joint Force Command Naples to deliver NATO's Counter-Improvised Explosive Devices (C-IED) expertise to military personnel from Kuwait, Qatar, Oman, and Saudi Arabia.
- January 2024: The US Navy announced its plans to integrate artificial intelligence (AI) to enhance the Joint Counter Radio-Controlled Improvised Explosive Device Electronic Warfare (JCREW) Increment One Block One (I1B1) system. Developed by Northrop Grumman, the system counters IEDs and drones and is actively deployed by the Navy, Air Force, and allies like Australia.


Global Counter-IED Market Report Scope
The counter IED systems are used by law enforcement and armed forces for the detection of explosives as well as for dismantling the Improvised Explosive Devices (IEDs) devices. The market for counter IED is segmented by capability into detection and countermeasures. Also, by deployment, the market is segmented into vehicle-mounted and hand-held systems. The vehicle-mounted segment includes the counter IED devices that are mounted on all land-based, air-based, and sea-based vehicle platforms. The report also covers the market sizes and forecasts for the market in major countries across different regions. The market sizing and forecasts have been provided in value (USD million).
| Detection | Metal-detector-based systems |
| Ground-penetrating-radar systems | |
| RF/EO/IR sensor fusion suites | |
| Countermeasures | Stand-off jammers |
| Directed-energy neutralizers | |
| Disruptor and EOD robotics |
| Vehicle-Mounted | Manned Tactical Vehicles |
| Unmanned Ground Vehicles | |
| Hand-held/Man-portable | |
| Aerial-borne Pods and Payloads |
| Military |
| Homeland Security |
| RF Jamming |
| Sensor-based Detection |
| Robotic and Autonomous Systems |
| North America | United States | |
| Canada | ||
| Mexico | ||
| Europe | Germany | |
| United Kingdom | ||
| France | ||
| Russia | ||
| Rest of Europe | ||
| Asia-Pacific | China | |
| Japan | ||
| India | ||
| Australia | ||
| Rest of Asia-Pacific | ||
| South America | Brazil | |
| Rest of South America | ||
| Middle East and Africa | Middle East | United Arab Emirates |
| Saudi Arabia | ||
| Rest of Middle East | ||
| Africa | South Africa | |
| Rest of Africa | ||
| By Capability | Detection | Metal-detector-based systems | |
| Ground-penetrating-radar systems | |||
| RF/EO/IR sensor fusion suites | |||
| Countermeasures | Stand-off jammers | ||
| Directed-energy neutralizers | |||
| Disruptor and EOD robotics | |||
| By Deployment | Vehicle-Mounted | Manned Tactical Vehicles | |
| Unmanned Ground Vehicles | |||
| Hand-held/Man-portable | |||
| Aerial-borne Pods and Payloads | |||
| By End User | Military | ||
| Homeland Security | |||
| By Technology | RF Jamming | ||
| Sensor-based Detection | |||
| Robotic and Autonomous Systems | |||
| By Geography | North America | United States | |
| Canada | |||
| Mexico | |||
| Europe | Germany | ||
| United Kingdom | |||
| France | |||
| Russia | |||
| Rest of Europe | |||
| Asia-Pacific | China | ||
| Japan | |||
| India | |||
| Australia | |||
| Rest of Asia-Pacific | |||
| South America | Brazil | ||
| Rest of South America | |||
| Middle East and Africa | Middle East | United Arab Emirates | |
| Saudi Arabia | |||
| Rest of Middle East | |||
| Africa | South Africa | ||
| Rest of Africa | |||


Key Questions Answered in the Report
What is the current size of the counter IED market?
The market is valued at USD 2.29 billion in 2026 and is projected to grow to USD 2.75 billion by 2031, translating into a 3.73% CAGR..
Which capability segment leads the counter IED market?
Detection systems hold the largest share at 59.10%, reflecting ongoing emphasis on early threat identification.
Which deployment mode is growing fastest?
Aerial-borne pods and payloads exhibit the highest CAGR of 5.18% owing to their wide-area coverage and flexibility advantages.
Why are autonomous systems gaining ground in counter-IED operations?
Robotic and autonomous platforms reduce personnel exposure and integrate AI-enabled sensor fusion, driving a 5.55% CAGR in their segment
Which region shows the strongest growth outlook?
Asia-Pacific is set for a 5.05% CAGR through 2031 as territorial disputes and modernization programs boost procurement.
What are the main restraints limiting market expansion?
High GaN component costs and spectrum-management constraints are the prominent factors suppressing short-term growth rates.
Page last updated on:


