Chile Data Center Market Size and Share
Market Overview
| Study Period | 2020 - 2031 |
|---|---|
| Forecast Data Period | 2026 - 2031 |
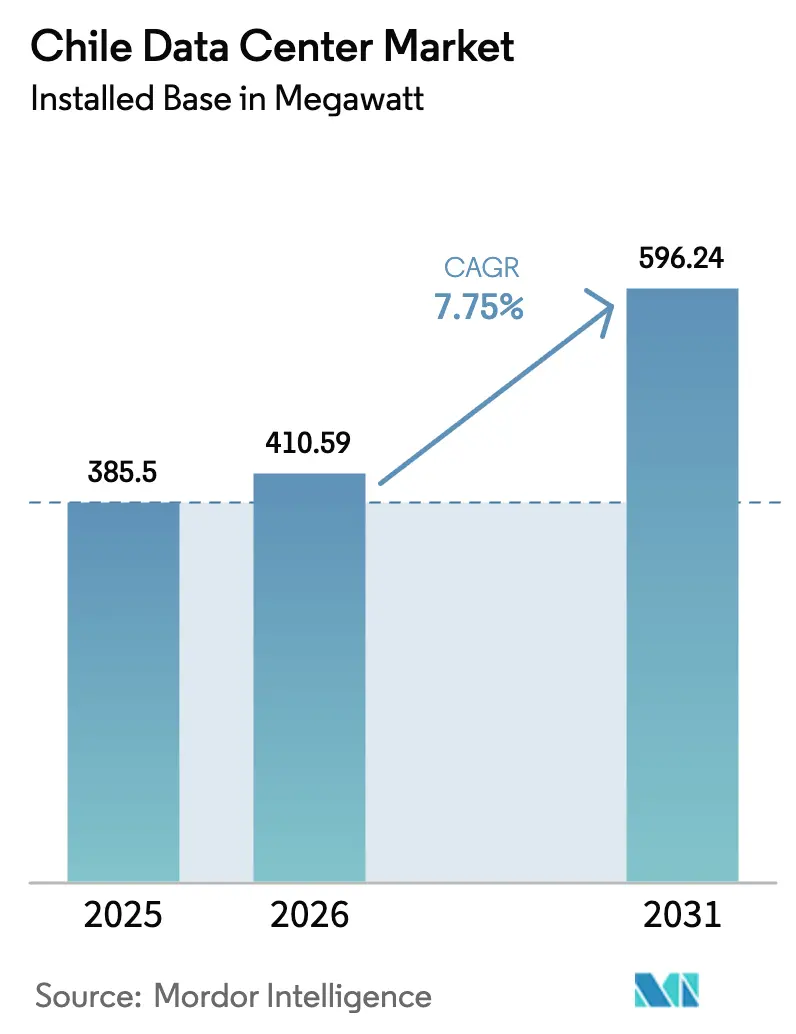
| Base Year Market Size (2025) | 385.5 megawatt |
| Market Volume (2026) | 410.59 megawatt |
| Market Volume (2031) | 596.24 megawatt |
| Growth Rate (2026 - 2031) | 7.75% CAGR |
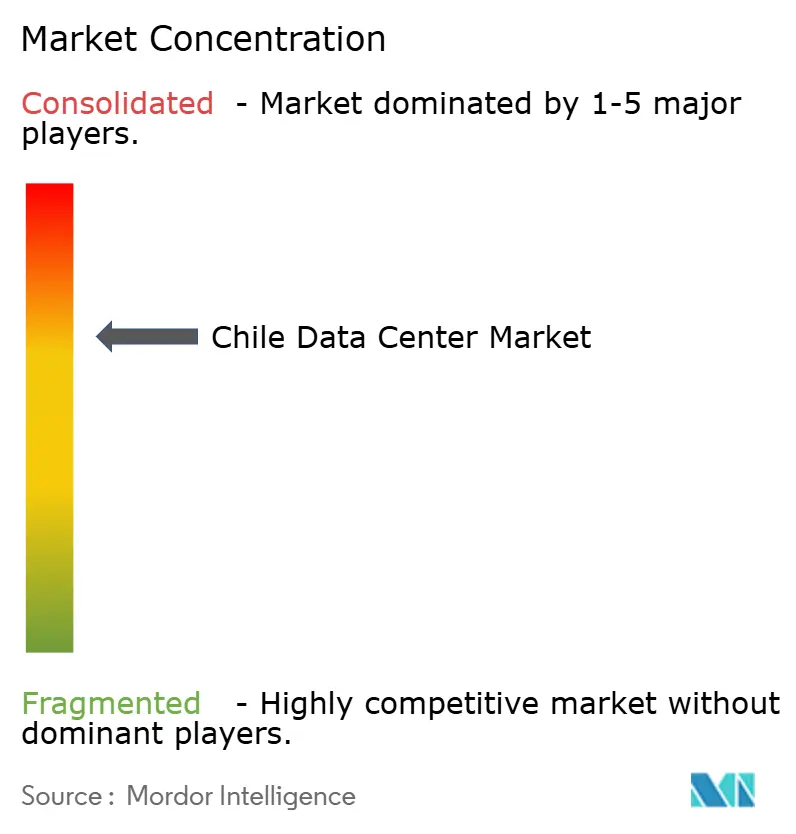
| Market Concentration | Medium |
Major Players *Disclaimer: Major Players sorted in no particular order Image © Mordor Intelligence. Reuse requires attribution under CC BY 4.0. | |
Chile Data Center Market Analysis by Mordor Intelligence
The Chile data center market size in terms of installed base is expected to grow from 385.5 megawatt in 2025 to 410.59 megawatt in 2026 and is forecast to reach 596.24 megawatt by 2031 at 7.75% CAGR over 2026-2031. Strong capital inflows from hyperscalers, an expanding subsea cable network, and rapid gains in renewable energy generation are redefining capacity planning. Large cloud providers are favoring wholesale and self-built facilities that support high-density artificial-intelligence workloads, while mid-market enterprises sustain demand for medium-sized, retail-focused sites. Seismic-resilient designs and closed-loop cooling are becoming the norm, driven by regulatory and community pressure. Rising power tariffs and land scarcity in Santiago continue to push new builds toward coastal and southern regions that offer lower real estate costs, renewable power, and proximity to fiber.
Key Report Takeaways
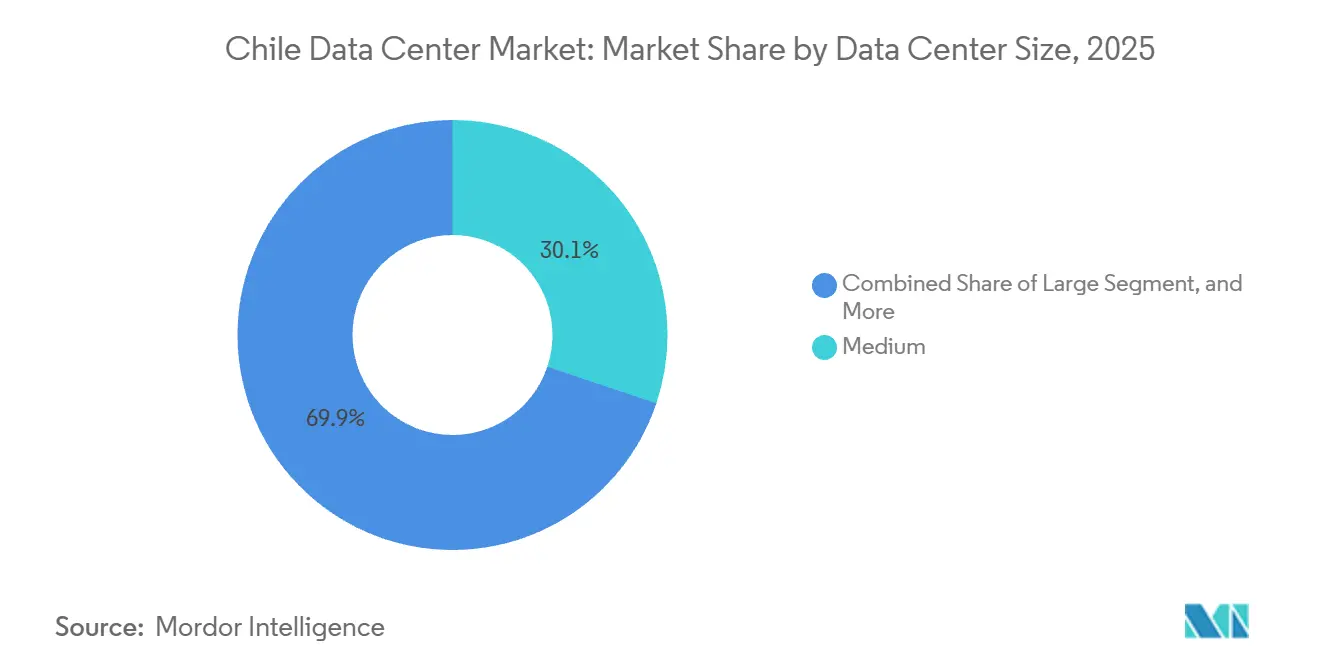
- By data center size, medium facilities accounted for 30.14% of 2025 capacity, whereas large sites are forecast to expand at an 8.23% CAGR through 2031.
- By tier, tier 3 captured 72.05% of capacity in 2025; tier 4 is projected to grow at an 8.52% CAGR through 2031.
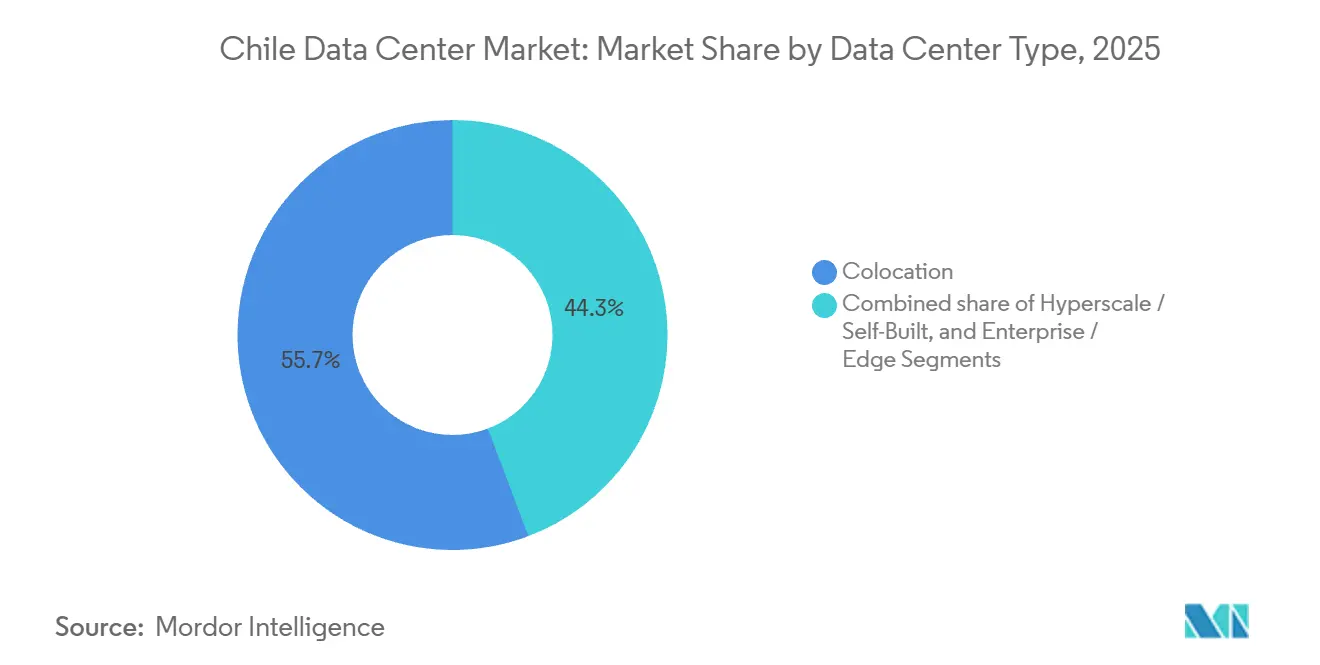
- By data center type, colocation accounted for 55.74% of the Chile data center market share in 2025, while hyperscale and self-built sites posted the fastest 8.68% CAGR to 2031.
- By end user, IT and ITES dominated with a 48.61% share in 2025; BFSI is advancing at a 9.46% CAGR to 2031.
- By hotspot, Santiago accounted for 28.29% of capacity in 2025, yet the Rest of Chile segment is expanding at an 8.74% CAGR through 2031.
Note: Market size and forecast figures in this report are generated using Mordor Intelligence’s proprietary estimation framework, updated with the latest available data and insights as of 2026.
Chile Data Center Market Trends and Insights
Drivers Impact Analysis*
| Driver | (~) % Impact on CAGR Forecast | Geographic Relevance | Impact Timeline |
|---|---|---|---|
| Surge in Hyperscaler Capital Inflows | +2.1% | National, early gains in Santiago, Valparaíso, Quilicura | Medium term (2-4 years) |
| Strengthening Subsea Cable Ecosystem | +1.8% | National, spillover to regional Latin American interconnection | Long term (≥ 4 years) |
| Renewable-Energy Cost Advantage | +1.3% | National, concentrated in northern solar and southern hydro zones | Medium term (2-4 years) |
| Rapid Growth in Mobile and Internet Traffic | +1.1% | National, urban concentration in Santiago, Valparaíso, Concepción | Short term (≤ 2 years) |
| Deregulated Environmental Permitting for DCs | +0.7% | National, streamlining via National Data Center Plan | Medium term (2-4 years) |
| Government Digital Investment Platform Roll-Out | +0.5% | National, demand in public-sector hubs | Long term (≥ 4 years) |
| Source: Mordor Intelligence | |||
Surge in Hyperscaler Capital Inflows
Commitments exceeding USD 8 billion since 2025 are reshaping the Chile data center market, as Amazon Web Services, Microsoft, and Google build multi-availability-zone regions that each require 30-50 megawatts of IT load. These projects crowd out smaller colocation providers that lack the scale of renewable energy or high-density cooling, elevating wholesale lease rates and accelerating the shift away from cabinet-level contracts. Operators without hyperscaler anchor tenants now face margin compression, prompting portfolio realignment toward secondary regions and edge deployments.
Strengthening Subsea Cable Ecosystem
The Curie and forthcoming Humboldt cables cut latency to Asia-Pacific below 100 milliseconds, cementing Chile’s Pacific-gateway status. Improved international reach is boosting carrier-neutral demand for meet-me rooms and peering exchanges, which in turn fuels interconnection revenue for the Chile data center market. Competition may emerge from alternative landings in Brazil or Argentina, yet early investments give Chile a first-mover advantage that is difficult to replicate.
Renewable-Energy Cost Advantage
Renewables supplied 41% of national generation in Q1 2024 and are expected to reach 80% by 2030, enabling operators to lock in long-term green power at lower, less volatile spot-market tariffs. Battery storage at plants such as Coya supports uninterrupted renewable energy sourcing, enabling facilities to advertise 100% clean energy to ESG-oriented clients. These attributes allow premium pricing and strengthen the Chile data center market position against fossil-dependent peers.[1]Santander Research, “Steady Economic Activity Despite External Headwinds,” Santander.com
Rapid Growth in Mobile and Internet Traffic
Mobile internet penetration topped 115 connections per 100 residents in 2024, and 5G subscriptions grew 58.8% year over year. High-definition video, gaming, and real-time collaboration are driving metro-edge deployments that alleviate backhaul congestion. Fiber backbones extending into southern regions create fresh demand for 1-5 megawatt edge nodes, broadening the Chile data center market footprint beyond Santiago.
Restraints Impact Analysis*
| Restraint | (~) % Impact on CAGR Forecast | Geographic Relevance | Impact Timeline |
|---|---|---|---|
| Chronic Water Scarcity and Drought Risk | -1.4% | National, acute in Santiago and central regions | Short term (≤ 2 years) |
| Limited Land and Power Capacity in Santiago Hub | -1.2% | Santiago, Quilicura, Pudahuel clusters | Medium term (2-4 years) |
| Community Opposition over Water and Energy Use | -0.6% | Santiago metro, localized in Cerrillos, Quilicura | Short term (≤ 2 years) |
| High Seismic-Resilience Design Costs | -0.5% | National, high-seismicity zones per NCh 433 | Long term (≥ 4 years) |
| Source: Mordor Intelligence | |||
Chronic Water Scarcity and Drought Risk
A 15-year megadrought led regulators to tighten scrutiny, illustrated by the partial reversal of Google’s Cerrillos permit in 2024.[2]DataCenterDynamics, “News Chile,” Datacenterdynamics.comClosed-loop cooling and desalination raise capital and operating expenses, but remain prerequisites for new projects. Operators unable to secure dedicated water rights face prolonged approvals and potential litigation, which could delay near-term expansion in the Chile data center market.
Limited Land and Power Capacity in Santiago Hub
Grid demand in Quilicura could quadruple by 2032, while the delayed Kimal-Lo Aguirre line limits near-term connections. Scarce industrial parcels near substations now command premium prices, nudging developers toward coastal Valparaíso or southern Concepción. Investors must weigh higher lease rates in Santiago against faster approvals and lower costs elsewhere in the Chile data center market.[3]International Monetary Fund, “Chile: 2024 Article IV Consultation,” Imf.org
*Our forecasts treat driver/restraint impacts as directional, not additive. The impact forecasts reflect baseline growth, mix effects, and variable interactions.
Segment Analysis
By Data Center Size: Hyperscale Sites Accelerate Capacity Growth
Large facilities are on track to expand at an 8.23% CAGR, outstripping the overall Chile data center market. This surge reflects hyperscalers consolidating workloads into 30-50 megawatt campuses that deliver 8-12 kilowatts per rack. Medium sites, which held 30.14% capacity in 2025, still attract enterprises needing proximity within Santiago and Valparaíso. Small-scale edge nodes remain essential for latency-sensitive workloads in mining and southern cities, but their share of the Chile data center market size is limited by higher operating costs.
Investment activity underscores the trend; Ascenty’s 24,604 square-meter SCL04 site begins construction in 2026, while Cirion’s 20 megawatt SAN2 is already live in Quilicura. By 2031, large campuses are expected to command a greater share of the Chile data center market, even as medium sites retain relevance through flexible retail services. Operators without hyperscale footprints risk margin pressure as anchor tenants favor larger, energy-efficient builds.


By Tier Type: Tier 4 Adoption Driven by BFSI Mandates
Tier 4 facilities, although fewer, are projected to grow at an 8.52% CAGR, propelled by banking and government uptime requirements. Tier 3 sites, which supplied 72.05% of capacity in 2025, balance cost and performance for most enterprises. Capital premiums for Tier 4, ranging from 30-50% above Tier 3 cover, redundant utility feeds, and seismic bracing compliant with NCh 433. Yet BFSI tenants are willing to pay higher prices to guarantee 99.995% availability, boosting the Tier 4 segment’s Chile data center market size.
SONDA’s Kudos center and Equinix ST2 illustrate competitive positioning with Tier IV Gold certifications. Providers lacking Tier 4 inventory risk losing high-margin contracts and may pivot to hybrid solutions that mix Tier 3 for less critical loads. Growing regulatory scrutiny of financial stability ensures sustained Tier 4 demand in the Chilean data center industry.
By Data Center Type: Self-Build and Hyperscale Lead Expansion
Hyperscale and enterprise self-build formats are forecast to rise 8.68% per year, underpinned by massive AWS and Microsoft campuses. Colocation, which held 55.74% capacity in 2025, is shifting toward wholesale suites that align with multi-megawatt pre-leases. Retail colocation remains vital for mid-market customers but faces pricing pressure as the Chile data center market pivots to scale economics. Power-usage-effectiveness targets below 1.3 are now a baseline, reinforcing the appeal of purpose-built campuses. Operators that cannot match this efficiency are reassessing expansion plans or partnering directly with renewable generators.
Equinix is adding liquid-cooling-ready halls for AI workloads, while Ascenty targets both wholesale and retail with adaptable designs. Edge and enterprise facilities continue to meet local or sovereignty needs, particularly in mining districts, yet represent a smaller share of the Chilean data center market going forward. Providers with rich interconnection ecosystems are layering software-defined connectivity services to deepen customer stickiness. Without such value adds, smaller edge players risk being relegated to niche disaster-recovery roles.
By End User: BFSI Shows the Fastest Expansion
BFSI is projected to grow at 9.46% annually, supported by mobile banking penetration above 70% and strict data-residency rules. IT and ITES held 48.61% capacity in 2025 and remain the backbone of wholesale leasing. Regulatory clarity from the Comisión para el Mercado Financiero is driving BFSI tenants toward Tier 4 sites, boosting their market share in the Chile data center market. Instant payment rails rolling out in 2026 will heighten low-latency requirements, locking banks into premium commitments. Cloud-native fintech entrants also create burst-capacity demand during peak settlement windows.
E-commerce and media add incremental growth, while government uptake is steady but slower due to budget cycles. Mining and manufacturing still favor on-premises compute for operational-technology isolation; however, higher fiber bandwidth is gradually moving analytics into third-party facilities, broadening the Chile data center market. Content-delivery networks are deploying micro nodes in coastal cities to cut video start-up times, driving fresh rack bookings. Public-sector modernization funds earmarked for 2027-2028 could unlock additional demand once procurement hurdles ease.
Geography Analysis
Santiago’s 28.29% share in 2025 underscores its dominance, yet land scarcity and grid limits slow new builds. Hyperscalers already operate in coastal regions, leveraging subsea landings to gain latency advantages in the Chile data center market. Rest-of-Chile capacity is anticipated to rise at an 8.74% CAGR, surpassing Santiago as fiber backbones reach Valparaíso, Concepción, and Puerto Montt.
Southern regions, notably La Araucanía and Los Lagos, now receive high-capacity fiber that supports edge compute for video streaming and 5G backhaul. Puerto Montt, with a population of 150,000, is emerging as an edge node for micro-business cloud services, broadening the Chile data center market footprint. Operator strategies focus on 1-5 megawatt modules that balance capex discipline with first-mover advantage.
Northern mining provinces such as Antofagasta rely on low-latency analytics to guide autonomous haulage fleets. Regional demand for ruggedized micro-data centers is growing, although harsh climates and limited grid redundancy elevate operating costs. Such deployments nonetheless enhance national resilience and diversify revenue beyond the heavily contested Santiago cluster, further stabilizing the Chile data center market.
Competitive Landscape
The market indicates moderate concentration. Odata, leveraging early land acquisition and renewable power purchase agreements. Ascenty reported 750 clients at year-end 2025 and continues to scale across Latin America, adding 6 megawatts in Santiago during Q3 2025. Equinix, with five projects approved or operating, differentiates through liquid-cooling-ready halls for AI and expansive interconnection fabrics.
Edge specialists such as EdgeUno and NetActuate exploit segments ignored by wholesale-oriented incumbents, providing flexible footprints and carrier-neutral ecosystems. IPXON Networks follows a similar strategy, targeting gaming and content delivery clients through open peering at PIT Santiago. Closed-loop cooling, seismic certification to magnitude 8.0, and 100% renewable guarantees are evolving into baseline expectations rather than premium features.
White-space opportunities remain in disaster-recovery sites outside Santiago and in AI-ready rooms supporting 20-40 kilowatts per rack. Yet long permitting cycles, seismic engineering costs, and escalating land prices favor incumbents with robust balance sheets. Smaller entrants must carve niches in specialized verticals or under-served geographies to gain sustainable footholds in the Chile data center market.
Chile Data Center Industry Leaders
Amazon Web Services, Inc.
Google LLC
Microsoft Corporation
ODATA S.A.
Equinix, Inc.
- *Disclaimer: Major Players sorted in no particular order

Recent Industry Developments
- January 2026: Ascenty closed 2025 with 750 clients and 164 megawatts online across Latin America, including a 6 megawatt addition in Santiago during Q3 2025.
- November 2025: Chile’s environmental evaluation service approved Ascenty’s USD 140 million Data Hall Quilicura project on a 54,998 square-meter plot, with construction beginning Jan 2026 and operations slated for Jul 2027.
- August 2025: Ascenty inaugurated the 16 megawatt SCL03 facility in Quilicura, featuring closed-loop cooling and capacity for 1,100 racks on a 22,000 square-meter site.
- June 2025: Microsoft activated the Chile Central Azure region with three availability zones after USD 3.3 billion in capital spending.


Chile Data Center Market Report Scope
The data center market encompasses the infrastructure, services, and technologies that support the storage, management, and processing of data. This market includes various data center sizes, tier classifications, types, end-user industries, and hotspots, reflecting the diverse needs of businesses and organizations operating in the country.
The Chile Data Center Market Report is Segmented by Data Center Size (Small, Medium, Large, and Hyperscale), Tier Type (Tier 1 and 2, Tier 3, and Tier 4), Data Center Type (Hyperscale/Self-Built, Enterprise/Edge, and Colocation), End User (BFSI, IT and ITES, E-Commerce, Government, Manufacturing, Media and Entertainment, Telecom, and Other End Users), and Hotspot (Quilicura, Santiago, and Rest of Chile). The Market Forecasts are Provided in Terms of IT Load Capacity (Megawatt).
| Small |
| Medium |
| Large |
| Hyperscale |
| Tier 1 and 2 |
| Tier 3 |
| Tier 4 |
| Hyperscale / Self-Built | ||
| Enterprise / Edge | ||
| Colocation | Non-Utilized | |
| Utilized | Retail Colocation | |
| Wholesale Colocation | ||
| BFSI |
| IT and ITES |
| E-Commerce |
| Government |
| Manufacturing |
| Media and Entertainment |
| Telecom |
| Other End Users |
| Quilicura |
| Santiago |
| Rest of Chile |
| By Data Center Size | Small | ||
| Medium | |||
| Large | |||
| Hyperscale | |||
| By Tier Type | Tier 1 and 2 | ||
| Tier 3 | |||
| Tier 4 | |||
| By Data Center Type | Hyperscale / Self-Built | ||
| Enterprise / Edge | |||
| Colocation | Non-Utilized | ||
| Utilized | Retail Colocation | ||
| Wholesale Colocation | |||
| By End User | BFSI | ||
| IT and ITES | |||
| E-Commerce | |||
| Government | |||
| Manufacturing | |||
| Media and Entertainment | |||
| Telecom | |||
| Other End Users | |||
| By Hotspot | Quilicura | ||
| Santiago | |||
| Rest of Chile | |||


Market Definition
- IT LOAD CAPACITY - The IT load capacity or installed capacity, refers to the amount of energy consumed by servers and network equipments placed in a rack installed. It is measured in megawatt (MW).
- ABSORPTION RATE - It denotes the extend to which the data center capacity has been leased out. For instance, a 100 MW DC has leased out 75 MW, then absorption rate would be 75%. It is also referred as utilization rate and leased-out capacity.
- RAISED FLOOR SPACE - It is an elevated space build over the floor. This gap between the original floor and the elevated floor is used to accommodate wiring, cooling, and other data center equipment. This arrangement assist in having proper wiring and cooling infrastructure. It is measured in square feet (ft^2).
- DATA CENTER SIZE - Data Center Size is segmented based on the raised floor space allocated to the data center facilities. Mega DC - # of Racks must be more than 9000 or RFS (raised floor space) must be more than 225001 Sq. ft; Massive DC - # of Racks must be in between 9000 and 3001 or RFS must be in between 225000 Sq. ft and 75001 Sq. ft; Large DC - # of Racks must be in between 3000 and 801 or RFS must be in between 75000 Sq. ft and 20001 Sq. ft; Medium DC # of Racks must be in between 800 and 201 or RFS must be in between 20000 Sq. ft and 5001 Sq. ft; Small DC - # of Racks must be less than 200 or RFS must be less than 5000 Sq. ft.
- TIER TYPE - According to Uptime Institute the data centers are classified into four tiers based on the proficiencies of redundant equipment of the data center infrastructure. In this segment the data center are segmented as Tier 1,Tier 2, Tier 3 and Tier 4.
- COLOCATION TYPE - The segment is segregated into 3 categories namely Retail, Wholesale and Hyperscale Colocation service. The categorization is done based on the amount of IT load leased out to potential customers. Retail colocation service has leased capacity less than 250 kW; Wholesale colocation services has leased capacity between 251 kW and 4 MW and Hyperscale colocation services has leased capacity more than 4 MW.
- END CONSUMERS - The Data Center Market operates on a B2B basis. BFSI, Government, Cloud Operators, Media and Entertainment, E-Commerce, Telecom and Manufacturing are the major end-consumers in the market studied. The scope only includes colocation service operators catering to the increasing digitalization of the end-user industries.
| Keyword | Definition |
|---|---|
| Rack Unit | Generally referred as U or RU, it is the unit of measurement for the server unit housed in the racks in the data center. 1U is equal to 1.75 inches. |
| Rack Density | It defines the amount of power consumed by the equipment and server housed in a rack. It is measured in kilowatt (kW). This factor plays a critical role in data center design and, cooling and power planning. |
| IT Load Capacity | The IT load capacity or installed capacity, refers to the amount of energy consumed by servers and network equipment placed in a rack installed. It is measured in megawatt (MW). |
| Absorption Rate | It denotes how much of the data center capacity has been leased out. For instance, if a 100 MW DC has leased out 75 MW, then the absorption rate would be 75%. It is also referred to as utilization rate and leased-out capacity. |
| Raised Floor Space | It is an elevated space built over the floor. This gap between the original floor and the elevated floor is used to accommodate wiring, cooling, and other data center equipment. This arrangement assists in having proper wiring and cooling infrastructure. It is measured in square feet/meter. |
| Computer Room Air Conditioner (CRAC) | It is a device used to monitor and maintain the temperature, air circulation, and humidity inside the server room in the data center. |
| Aisle | It is the open space between the rows of racks. This open space is critical for maintaining the optimal temperature (20-25 °C) in the server room. There are primarily two aisles inside the server room, a hot aisle and a cold aisle. |
| Cold Aisle | It is the aisle wherein the front of the rack faces the aisle. Here, chilled air is directed into the aisle so that it can enter the front of the racks and maintain the temperature. |
| Hot Aisle | It is the aisle where the back of the racks faces the aisle. Here, the heat dissipated from the equipment’s in the rack is directed to the outlet vent of the CRAC. |
| Critical Load | It includes the servers and other computer equipment whose uptime is critical for data center operation. |
| Power Usage Effectiveness (PUE) | It is a metric which defines the efficiency of a data center. It is calculated by: (𝑇𝑜𝑡𝑎𝑙 𝐷𝑎𝑡𝑎 𝐶𝑒𝑛𝑡𝑒𝑟 𝐸𝑛𝑒𝑟𝑔𝑦 𝐶𝑜𝑛𝑠𝑢𝑚𝑝𝑡𝑖𝑜𝑛)/(𝑇𝑜𝑡𝑎𝑙 𝐼𝑇 𝐸𝑞𝑢𝑖𝑝𝑚𝑒𝑛𝑡 𝐸𝑛𝑒𝑟𝑔𝑦 𝐶𝑜𝑛𝑠𝑢𝑚𝑝𝑡𝑖𝑜𝑛). Further, a data center with a PUE of 1.2-1.5 is considered highly efficient, whereas, a data center with a PUE >2 is considered highly inefficient. |
| Redundancy | It is defined as a system design wherein additional component (UPS, generators, CRAC) is added so that in case of power outage, equipment failure, the IT equipment should not be affected. |
| Uninterruptible Power Supply (UPS) | It is a device that is connected in series with the utility power supply, storing energy in batteries such that the supply from UPS is continuous to IT equipment even during utility power is snapped. The UPS primarily supports the IT equipment only. |
| Generators | Just like UPS, generators are placed in the data center to ensure an uninterrupted power supply, avoiding downtime. Data center facilities have diesel generators and commonly, 48-hour diesel is stored in the facility to prevent disruption. |
| N | It denotes the tools and equipment required for a data center to function at full load. Only "N" indicates that there is no backup to the equipment in the event of any failure. |
| N+1 | Referred to as 'Need plus one', it denotes the additional equipment setup available to avoid downtime in case of failure. A data center is considered N+1 when there is one additional unit for every 4 components. For instance, if a data center has 4 UPS systems, then for to achieve N+1, an additional UPS system would be required. |
| 2N | It refers to fully redundant design wherein two independent power distribution system is deployed. Therefore, in the event of a complete failure of one distribution system, the other system will still supply power to the data center. |
| In-Row Cooling | It is the cooling design system installed between racks in a row where it draws warm air from the hot aisle and supplies cool air to the cold aisle, thereby maintaining the temperature. |
| Tier 1 | Tier classification determines the preparedness of a data center facility to sustain data center operation. A data center is classified as Tier 1 data center when it has a non-redundant (N) power component (UPS, generators), cooling components, and power distribution system (from utility power grids). The Tier 1 data center has an uptime of 99.67% and an annual downtime of <28.8 hours. |
| Tier 2 | A data center is classified as Tier 2 data center when it has a redundant power and cooling components (N+1) and a single non-redundant distribution system. Redundant components include extra generators, UPS, chillers, heat rejection equipment, and fuel tanks. The Tier 2 data center has an uptime of 99.74% and an annual downtime of <22 hours. |
| Tier 3 | A data center having redundant power and cooling components and multiple power distribution systems is referred to as a Tier 3 data center. The facility is resistant to planned (facility maintenance) and unplanned (power outage, cooling failure) disruption. The Tier 3 data center has an uptime of 99.98% and an annual downtime of <1.6 hours. |
| Tier 4 | It is the most tolerant type of data center. A Tier 4 data center has multiple, independent redundant power and cooling components and multiple power distribution paths. All IT equipment are dual powered, making them fault tolerant in case of any disruption, thereby ensuring interrupted operation. The Tier 4 data center has an uptime of 99.74% and an annual downtime of <26.3 minutes. |
| Small Data Center | Data center that has floor space area of ≤ 5,000 Sq. ft or the number of racks that can be installed is ≤ 200 is classified as a small data center. |
| Medium Data Center | Data center which has floor space area between 5,001-20,000 Sq. ft, or the number of racks that can be installed is between 201-800, is classified as a medium data center. |
| Large Data Center | Data center which has floor space area between 20,001-75,000 Sq. ft, or the number of racks that can be installed is between 801-3,000, is classified as a large data center. |
| Massive Data Center | Data center which has floor space area between 75,001-225,000 Sq. ft, or the number of racks that can be installed is between 3001-9,000, is classified as a massive data center. |
| Mega Data Center | Data center that has a floor space area of ≥ 225,001 Sq. ft or the number of racks that can be installed is ≥ 9001 is classified as a mega data center. |
| Retail Colocation | It refers to those customers who have a capacity requirement of 250 kW or less. These services are majorly opted by small and medium enterprises (SMEs). |
| Wholesale Colocation | It refers to those customers who have a capacity requirement between 250 kW to 4 MW. These services are majorly opted by medium to large enterprises. |
| Hyperscale Colocation | It refers to those customers who have a capacity requirement greater than 4 MW. The hyperscale demand primarily originates from large-scale cloud players, IT companies, BFSI, and OTT players (like Netflix, Hulu, and HBO+). |
| Mobile Data Speed | It is the mobile internet speed a user experiences via their smartphones. This speed is primarily dependent on the carrier technology being used in the smartphone. The carrier technologies available in the market are 2G, 3G, 4G, and 5G, where 2G provides the slowest speed while 5G is the fastest. |
| Fiber Connectivity Network | It is a network of optical fiber cables deployed across the country, connecting rural and urban regions with high-speed internet connection. It is measured in kilometer (km). |
| Data Traffic per Smartphone | It is a measure of average data consumption by a smartphone user in a month. It is measured in gigabyte (GB). |
| Broadband Data Speed | It is the internet speed that is supplied over the fixed cable connection. Commonly, copper cable and optic fiber cable are used in both residential and commercial use. Here, optic cable fiber provides faster internet speed than copper cable. |
| Submarine Cable | A submarine cable is a fiber optic cable laid down at two or more landing points. Through this cable, communication and internet connectivity between countries across the globe is established. These cables can transmit 100-200 terabits per second (Tbps) from one point to another. |
| Carbon Footprint | It is the measure of carbon dioxide generated during the regular operation of a data center. Since, coal, and oil & gas are the primary source of power generation, consumption of this power contributes to carbon emissions. Data center operators are incorporating renewable energy sources to curb the carbon footprint emerging in their facilities. |


Research Methodology
Mordor Intelligence follows a four-step methodology in all our reports.
- Step-1: Identify Key Variables: In order to build a robust forecasting methodology, the variables and factors identified in Step-1 are tested against available historical market numbers. Through an iterative process, the variables required for market forecast are set and the model is built on the basis of these variables.
- Step-2: Build a Market Model: Market-size estimations for the forecast years are in nominal terms. Inflation is not a part of the pricing, and the average selling price (ASP) is kept constant throughout the forecast period for each country.
- Step-3: Validate and Finalize: In this important step, all market numbers, variables and analyst calls are validated through an extensive network of primary research experts from the market studied. The respondents are selected across levels and functions to generate a holistic picture of the market studied.
- Step-4: Research Outputs: Syndicated Reports, Custom Consulting Assignments, Databases & Subscription Platforms


