
Chile Data Center Server Market Size and Share
Market Overview
| Study Period | 2020 - 2031 |
|---|---|
| Forecast Data Period | 2026 - 2031 |
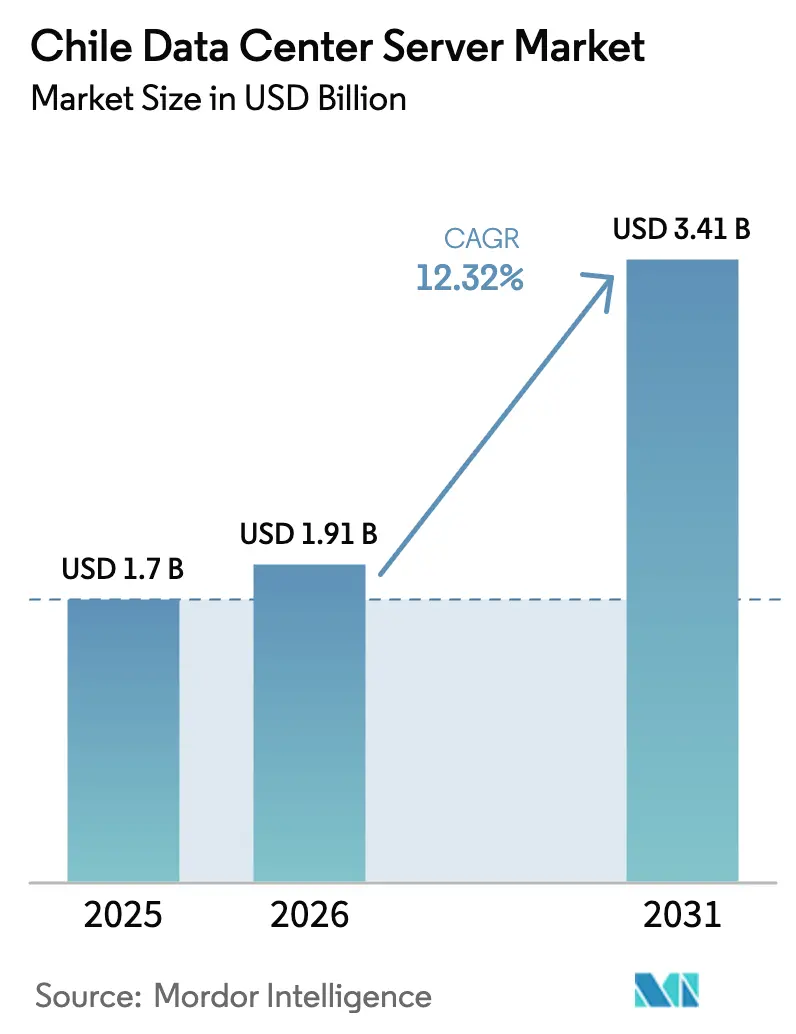
| Base Year Market Size (2025) | USD 1.70 Billion |
| Market Size (2026) | USD 1.91 Billion |
| Market Size (2031) | USD 3.41 Billion |
| Growth Rate (2026 - 2031) | 12.32 % |
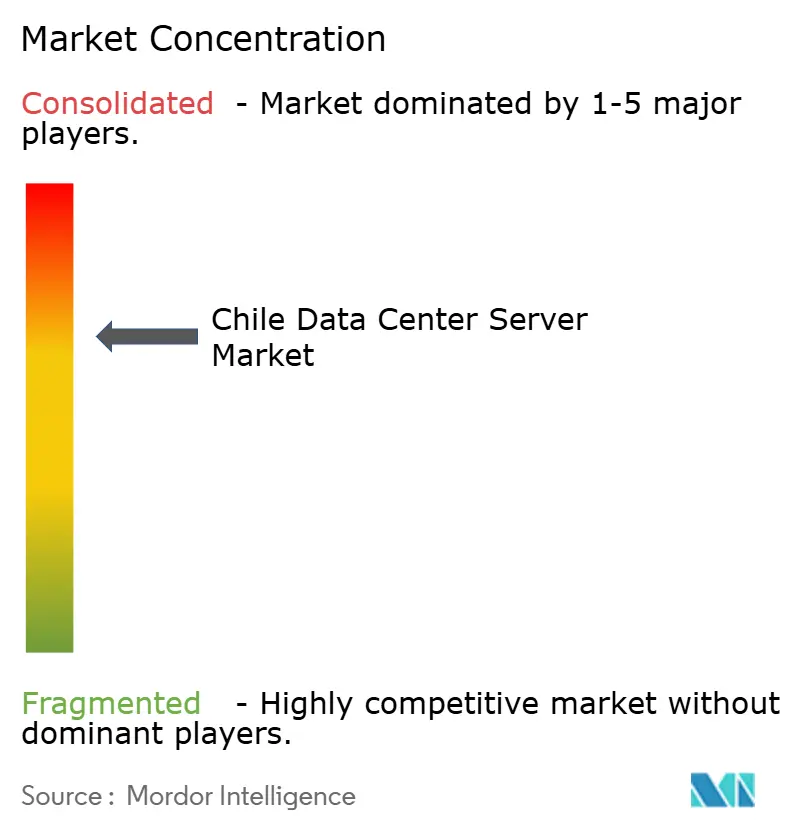
| Market Concentration | Medium |
Major Players
*Disclaimer: Major Players sorted in no particular order Image © Mordor Intelligence. Reuse requires attribution under CC BY 4.0. |
|
Chile Data Center Server Market Analysis by Mordor Intelligence
The Chile Data Center Server market size is expected to grow from USD 1.70 billion in 2025 to USD 1.91 billion in 2026 and is forecast to reach USD 3.41 billion by 2031 at 12.32% CAGR over 2026-2031. Heightened hyperscale spending, rapid enterprise cloud adoption, and a policy push for renewable-powered campuses keep demand on an upward trajectory. Santiago’s strategic role as a subsea cable nexus continues to lower latency, drawing spillover workloads from Brazil and strengthening the country’s regional interconnection profile. Capital-intensive AI and GPU refresh cycles are reshaping server specifications toward higher power densities, while pro-cloud tax incentives shave operating costs and improve return on invested capital. Competitive focus is shifting to cooling innovation because severe water restrictions and the peso’s volatility are testing traditional procurement and operating models.
Key Report Takeaways
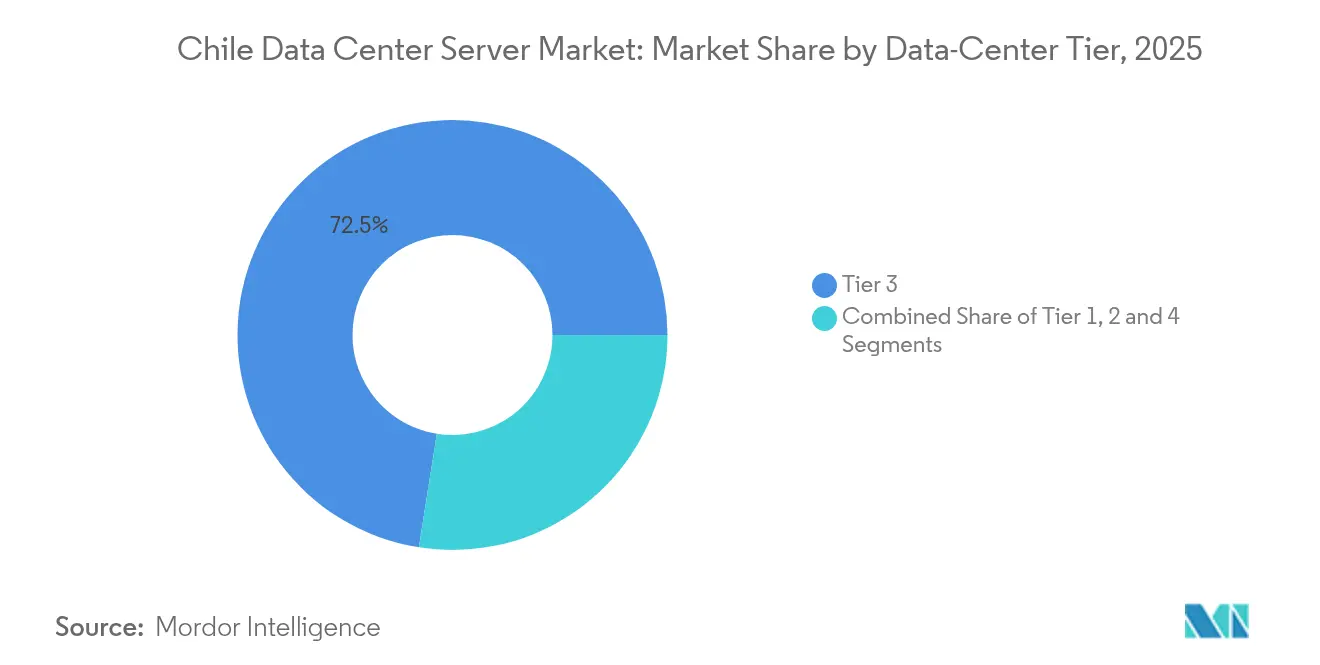
- By data-center tier, Tier 3 led with 72.50% revenue share in 2025; Tier 4 facilities are projected to expand at a 13.42% CAGR through 2031.
- By form factor, half-height blade servers held 61.30% share in 2025, whereas quarter-height and micro-blade configurations are expected to grow at a 13.12% CAGR to 2031.
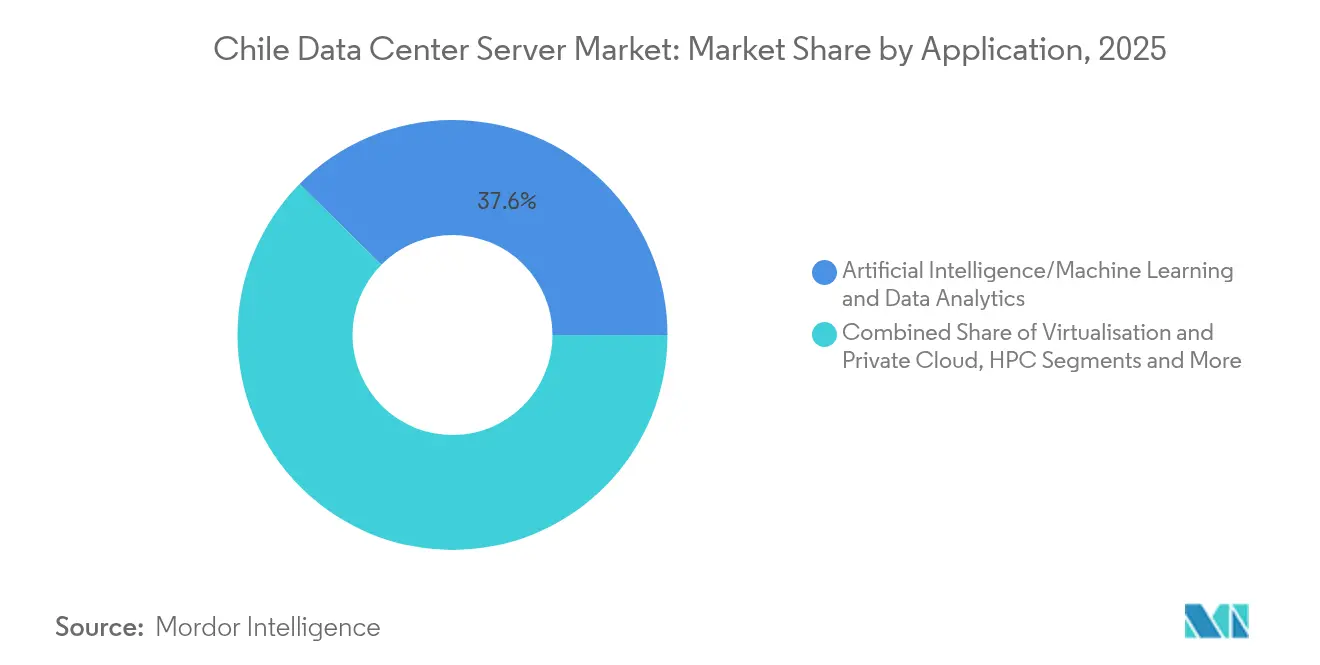
- By application, AI/ML workloads accounted for 37.60% of the Chile Data Center Server market size in 2025 and virtualization and private cloud are advancing at a 12.18% CAGR through 2031.
- By data-center type, colocation captured 54.60% of the Chile Data Center Server market share in 2025 while hyperscale deployments are set to grow at 14.23% CAGR through 2031.
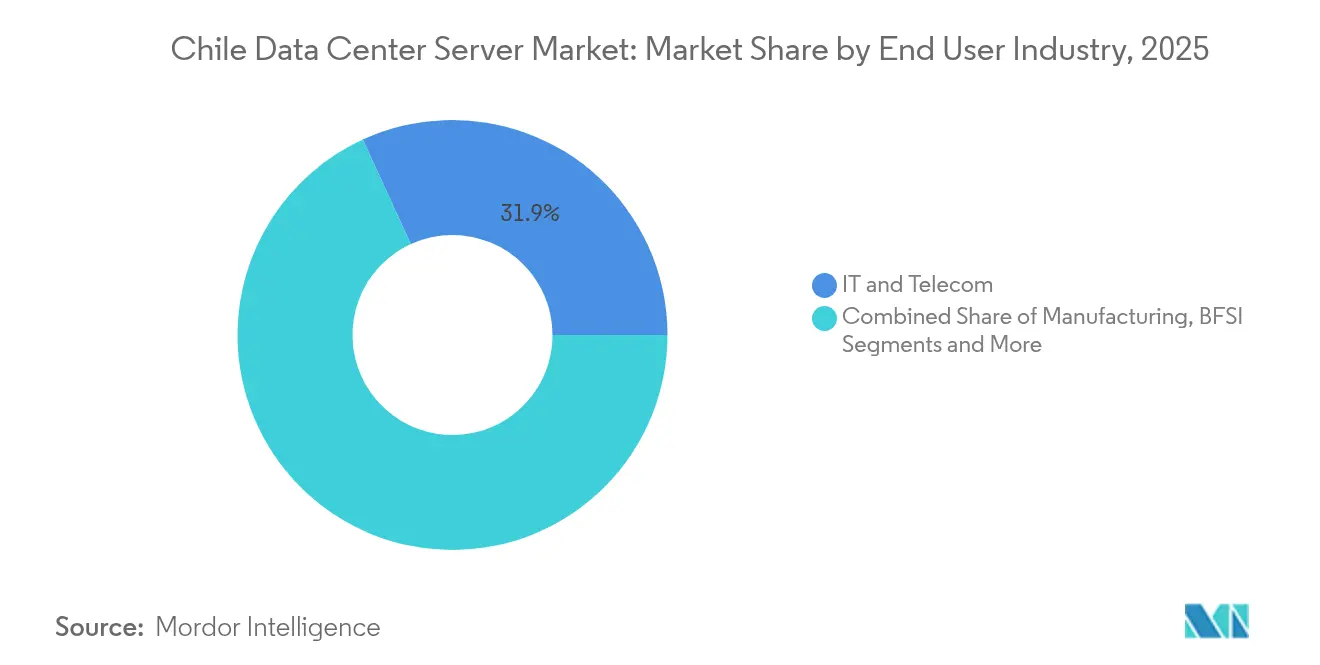
- By end-use industry, IT and telecom held 31.85% share of the Chile Data Center Server market size in 2025 and manufacturing and Industry 4.0 is projected to see 14.95% CAGR through 2031.
Note: Market size and forecast figures in this report are generated using Mordor Intelligence’s proprietary estimation framework, updated with the latest available data and insights as of 2026.
Chile Data Center Server Market Trends and Insights
Drivers Impact Analysis*
| Driver | (~)% Impact on CAGR Forecast | Geographic Relevance | Impact Timeline |
|---|---|---|---|
| Digitisation of Chile's BFSI sector fuels hyperscale demand | +2.1% | National, with concentration in Santiago metropolitan area | Medium term (2-4 years) |
| Pro-cloud tax incentives & renewable-energy PPAs cut TCO | +1.8% | National, with early gains in Santiago, Valparaíso, Concepción | Long term (≥ 4 years) |
| Santiago's dense subsea-cable landing points lower latency | +1.5% | Santiago core, spill-over to Valparaíso region | Short term (≤ 2 years) |
| Rapid AI-workload adoption triggers GPU-rich server refresh | +2.3% | National, with enterprise concentration in Santiago | Short term (≤ 2 years) |
| Hyperscale self-build spill-over to local ODM & white-box supply | +1.2% | Santiago, with secondary impact in Concepción | Medium term (2-4 years) |
| Chile's sovereign-cloud mandate for public data residency | +1.4% | National, government sector focus | Long term (≥ 4 years) |
| Source: Mordor Intelligence | |||
Digitization of Chile’s BFSI Sector Fuels Hyperscale Demand
Large banks are accelerating cloud migration and hybrid architectures. Banco de Crédito e Inversiones’ MACH platform now serves more than 3 million users and handles over 100,000 daily transactions using cloud-native back ends. Santander reports 90% of workloads in hybrid cloud, pushing steady demand for Tier 3 and Tier 4 server footprints that guarantee uptime and regulatory compliance. Real-time payment rails increase latency sensitivity and favor local server placement in Santiago. These trends underpin sustained capacity additions by hyperscale and colocation providers courting financial-sector tenants.
Pro-cloud Tax Incentives and Renewable-Energy PPAs Cut TCO
Renewables account for 65% of Chile’s installed generation and power purchase agreements tied to solar and wind unlock 15-20% lifetime cost savings for data-center operators. ENGIE Chile’s USD 650 million pipeline and Enel’s USD 1.8 billion grid upgrade plan bolster the reliability of clean energy inputs. [1]ENGIE."ENGIE Chile comunica al mercado inversiones por cerca de USD 650 millones en desarrollo de energía renovable," engie.clAmazon committed to sourcing 100% of its Chilean load from renewables, reinforcing the link between green policy and infrastructure build-out. These economics strengthen price competitiveness of the Chile Data Center Server market versus fossil-based peers.
Santiago’s Dense Subsea-Cable Landing Points Lower Latency
Multiple Pacific and Atlantic systems converge in Santiago, turning the capital into a gateway for regional and trans-Pacific traffic. Google’s cable projects anchor capacity, and fixed broadband averages 213.73 Mbps nationwide, enabling edge rollouts that require low-latency, high-throughput servers.[2]Google, "Quilicura, Chile - Google Data Center Location," datacenters. googleThe connectivity advantage trims international transit costs by up to 30% and attracts hyperscalers seeking geographic diversity away from saturated Brazilian clusters.
Rapid AI-workload Adoption Triggers GPU-rich Server Refresh
Chile ranks among Latin America’s top AI investment destinations. Enterprises are moving from CPU to GPU stacks that draw 40-140 kW per rack. The Guacolda-Leftraru supercomputer demonstrates local appetite for high-performance compute, processing 47 million DNA sequences for climate research. Limited global GPU supply prompts firms to secure in-country capacity, driving premium pricing for AI-optimized nodes and influencing data-center design toward higher rack densities and advanced cooling.
Restraints Impact Analysis*
| Restraint | (~)% Impact on CAGR Forecast | Geographic Relevance | Impact Timeline |
|---|---|---|---|
| Rising cyber-attacks push up security & compliance costs | -1.6% | National, with government and financial sectors most affected | Short term (≤ 2 years) |
| Severe water-use restrictions on cooling infrastructure | -2.1% | Santiago core, extending to Valparaíso region | Medium term (2-4 years) |
| Grid-congestion delays for >10 MW campuses in Santiago | -1.3% | Santiago metropolitan area | Medium term (2-4 years) |
| Persistent peso volatility inflates imported server CAPEX | -1.8% | National, affecting all import-dependent operations | Short term (≤ 2 years) |
| Source: Mordor Intelligence | |||
Rising Cyber-attacks Push Up Security and Compliance Costs
Law 21,663 established the National Cybersecurity Agency in 2025, mandating continuous security management and incident response for essential services.[3]United States Legislative Information,' Chile: Framework Law on Cybersecurity Comes into Force", loc.gov Compliance adds 15-20% to infrastructure budgets through hardware security modules, encrypted storage, and network segmentation. These heightened requirements slow procurement cycles and raise barriers for smaller entrants.
Severe Water-use Restrictions on Cooling Infrastructure
Persistent drought triggered legal scrutiny of water-intensive cooling. Google paused a second Chilean campus after courts questioned environmental assessments. Traditional systems consume nearly 6.8 million gallons per MW annually, pushing operators toward air and liquid cooling that can lift capital outlays by 25-30%. AWS pledged to rely on water for cooling only 4% of the year by employing air and evaporative solutions, signaling a shift to alternative thermal designs that influence server form factors and density ceilings.
*Our forecasts treat driver/restraint impacts as directional, not additive. The impact forecasts reflect baseline growth, mix effects, and variable interactions.
Segment Analysis
By Data-Center Tier: Balanced Tier 3 Dominance Meets Tier 4 Acceleration
Tier 3 facilities captured 72.50% of the Chile Data Center Server market in 2025 due to their cost-to-redundancy balance. Financial, government, and telecom tenants prefer 99.982% availability without the complexity of fully fault-tolerant designs. The Chile Data Center Server market size for Tier 3 deployments is projected to expand steadily alongside hybrid cloud adoption schedules.
Tier 4 is the fastest-growing slice at a 13.42% CAGR through 2031 as mandatory cybersecurity rules elevate uptime expectations for essential services. Newly tendered government workloads and AI-rich banking applications require multi-path power and cooling. These conditions position Tier 4 providers to command premium pricing, particularly in Santiago, where land scarcity favors vertically integrated, high-density footprints.
Chile’s cybersecurity framework accelerates Tier 4 conversions within banking and defense. Local lenders deploying real-time fraud detection cannot tolerate unplanned downtime, so they budget for dual active-active sites. Meanwhile, Tier 1 and Tier 2 sites serve as edge and backup locations in secondary cities where grid upgrades lag. The Chile Data Center Server industry therefore shows a clear two-tier investment pattern: cost-efficient regional nodes and capital-intensive primary hubs.



By Form Factor: Half-height Leadership Challenged by Micro-blade Innovation
Half-height blades maintained 61.30% share in 2025 as operators leveraged legacy procurement cycles and homogeneous fleet management. Density pressure is changing that equation. Quarter-height and micro-blade systems are growing at 13.12% CAGR as operators re-rack to fit more cores per square meter.
Blade shipments overall are declining worldwide, yet Chile’s land and water constraints inject renewed interest in ultra-compact, energy-efficient designs. Micro-blade platforms enable 40-50% higher compute density per rack, a critical metric in premium Santiago real estate. They also align with direct-to-chip liquid cooling retrofits that mitigate evaporative water use. The Chile Data Center Server market is therefore pivoting to modular blades that lower vendor lock-in and improve thermal performance.
By Application/Workload: AI/ML Surge Drives Infrastructure Evolution
AI/ML workloads accounted for 37.60% of the Chile Data Center Server market in 2025, a testament to surging GPU demand in mining, banking, and public-sector analytics. GPU clusters require up to 10 times the power envelope of legacy virtual machines and force operators to adopt higher rack densities and liquid cooling.
Virtualization and private cloud stacks are projected to grow at 12.18% CAGR as enterprises modernize legacy x86 estates to migrate toward container architectures. Edge analytics in mining and smart-grid rollouts drive new demand for hybrid nodes that handle both inference and training tasks. Consequently, the Chile Data Center Server market size tied to AI workloads is expected to widen its lead, but virtualization will supply a stable revenue floor.
By Data-Center Type: Colocation Strength Faces Hyperscale Expansion
Colocation facilities controlled 54.60% of the Chile Data Center Server market share in 2025, reflecting enterprises’ preference for physical control within professionally managed sites. Colocation partners provide compliance visibility and sovereign data assurances that remain important under new privacy statutes.
Hyperscale clouds, led by Amazon’s USD 4 billion region, represent the fastest growth at 14.23% CAGR. Their expansion introduces ready-made GPU capacity and offsets the capital burden for tenants migrating seasonal workloads. Hybrid architectures emerge as a de-facto standard, blending colocation resilience for sensitive data with hyperscale elasticity. This interplay deepens the Chile Data Center Server market’s service diversity and intensifies competition for network interconnect revenue.
By End-use Industry: IT/Telecom Leads, Manufacturing Accelerates
IT and telecom players held 31.85% of 2025 revenue, fueled by nationwide fiber rollouts, 5G densification, and content delivery caching. Their server demand centers on network function virtualization and customer experience analytics.
Manufacturing and Industry 4.0 workloads post the fastest 14.95% CAGR as copper-mining majors and process industries deploy machine-learning loops to boost yield and energy efficiency. Smart grid pilots in the utilities sector add edge computing demand, rounding out a broadening client base that underpins the Chile Data Center Server market’s resilience.
Geography Analysis
Santiago is supported by dense subsea cables, government presence, and the largest pool of skilled labor. The city’s renewable-ready grid underpins large campuses, yet water scarcity and grid congestion above 10 MW are emerging bottlenecks. Investors are responding with air-cooled and liquid-cooling retrofits designed for higher inlet temperatures.
Valparaíso and Concepción policymakers push to decentralize and reduce systemic risk concentrated in the capital. The National Data Centres Plan fast-tracks renewable hookups and simplifies permits in these regions. ENGIE Chile’s solar clusters supply competitive power that attracts midsized colocation builds targeting regional enterprises.
Northern zones around Antofagasta and the Atacama Desert offer vast solar capacity and lower land costs, appealing to future hyperscale AI and HPC farms able to tolerate higher latency. Early projects explore direct-to-chip liquid cooling married to on-site photovoltaic capacity. Southern provinces remain niche, serving disaster-recovery and content caching use cases where moderate climate lowers cooling costs.
Regulatory Landscape
Chile’s data center server demand is being shaped by a tightening framework spanning cybersecurity, environmental permitting, and digital infrastructure policy. Law 21,663 (effective 2025) created the National Cybersecurity Agency and imposed continuous security management and incident response obligations on essential services, which increases compliance requirements for regulated workloads hosted in Chilean facilities. At the same time, Chile’s National Data Centers Plan (PDATA) 2024-2030, led by the Ministry of Science, Technology, Knowledge and Innovation (Minciencia), lays out sustainability and efficiency guidelines and includes investment-oriented guidance to support new campus development.
Permitting and environmental scrutiny are increasingly decisive for server deployments tied to new builds and expansions. In February 2026, the Environmental Assessment Service (SEA) published data-center-specific environmental evaluation criteria to standardize project assessments under SEIA, including baseline expectations around impacts and contingency planning. This direction tends to push operators toward lower-water cooling architectures. Connectivity and infrastructure regulation also intersects with data center growth: Law 21,678 (July 2024) establishes the internet as a public service and requires a National Digital Plan that incorporates infrastructure sharing principles, while Subtel and related telecom rules influence the pace and cost of metro fiber and backbone buildouts that anchor large server clusters.
Competitive Landscape
The Chile Data Center Server market shows moderate concentration. Global OEMs such as Dell Technologies, Hewlett-Packard Enterprise, and Lenovo control a large share through direct sales and channel partners that manage import logistics and peso hedging. Local value-added resellers specialize in compliance integration and post-deploy support, adding stickiness for domestic clients.
Competitive advantage now rests on energy and cooling efficiency as electricity represents more than 60% of lifetime TCO in GPU-rich racks. Vendors that certify hardware for direct liquid cooling and outer-shell immersion gain mindshare with operators contending with water quotas. AWS, Google, and Microsoft emphasize power-usage-effectiveness below 1.2 and 100% renewable guarantees, raising the standard for smaller rivals.
Edge opportunities in mining, smart grids, and remote manufacturing open space for modular micro-data-center suppliers and ODM white-box providers. Scala Data Centers and Cirion evaluate regional edge nodes that bring GPU capacity closer to industrial sites, further fracturing traditional supply chains and seeding next-generation sales channels for AI-ready servers.
Chile Data Center Server Industry Leaders
-
Dell Technologies
-
Hewlett Packard Enterprise
-
Lenovo Group
-
Cisco Systems
-
IBM Corporation
- *Disclaimer: Major Players sorted in no particular order

Market Opportunities and Future Outlook
A concrete opportunity area is AI-ready capacity that can operate within tighter environmental constraints, shifting server specifications toward higher-density, liquid-cooled, and power-efficient configurations. Through PDATA 2024-2030, Chile continues to tie capacity build-out to sustainability and efficiency goals, and the proposal of a public-private AI training center creates whitespace for suppliers that can combine GPU-rich platforms with validated cooling and energy management designs suited to stricter environmental evaluation.
On the supply side, TECfusions and Baeza Group have announced a 100 MW data center campus in Puente Alto aimed at high-density AI workloads, while Ascenty has communicated plans for SCL04 and SCL05 in Santiago with 150 MW combined capacity oriented to AI use cases. Together, these announcements broaden the addressable base for next-generation server refresh and deployment programs. Geographic diversification also opens procurement lanes beyond Santiago where power availability and renewable generation are key inputs, supporting demand for modular, scalable server blocks that can be deployed in line with secured grid capacity and on-site energy solutions. For vendors and integrators, this environment supports bundles that reduce time-to-commission (prequalified reference architectures, liquid-cooling-ready racks, and security-by-design stacks aligned with the 2025 cybersecurity framework) and services that help operators document compliance against SEA’s standardized environmental criteria.
Recent Industry Developments
- July 2026: The Data Center Market announced six initiatives representing 1.125 GW of capacity securing open access for grid connection in Chile through 2028. The move expands capacity and strengthens interconnection with regional power networks, supporting higher workload migrations and commodity-scale buildouts.
- July 2026: Solaer Renewable Energies announced plans for a data center campus in the Atacama region with 197 MW solar capacity, 500 MWh of battery storage, and desalinated water infrastructure. The project highlights a shift toward renewable-powered campuses in remote markets and enhances energy resilience for data center operations.
- July 2026: TECfusions and Baeza Group announced a partnership to develop a 100 MW data center campus in Puente Alto, launching with an initial 10 MW capacity. The collaboration accelerates regional capacity expansion near Santiago and improves proximity to downstream cloud and enterprise demand.


Research Methodology Framework and Report Scope
Market Definition and Coverage
This market covers the value of servers deployed in data centers located in Chile, including new server shipments and refresh purchases used to run storage, compute, and virtualization workloads across colocation and enterprise facilities.
Scope exclusions: end-user devices, networking gear, and standalone storage appliances sold outside data centers are excluded from this market sizing.
Segmentation Overview
-
By Data-Center Tier
- Tier 1 and 2
- Tier 3
- Tier 4
-
By Form Factor
- Half-height Blades
- Full-height Blades
- Quarter-height / Micro-blades
-
By Application / Workload
- Virtualisation and Private Cloud
- High-Performance Computing (HPC)
- Artificial Intelligence/Machine Learning and Data Analytics
- Storage-centric
- Edge / IoT Gateways
-
By Data Center Type
- Hyperscalers/Cloud Service Provider
- Colocation Facilities
- Enterprise and Edge
-
By End-use Industry
- BFSI
- IT and Telecom
- Healthcare and Life-Sciences
- Manufacturing and Industry 4.0
- Energy and Utilities
- Government and Defence
Data Sources, Market Sizing, and Validation
Desk Research
Desk research is used to map Chile data center activity to server demand signals that can be checked year over year. We primarily relied on public infrastructure and digital economy indicators, then reviewed data center capacity announcements to estimate probable rack additions and refresh cycles.
Typical reference points include sources such as the Subsecretaria de Telecomunicaciones (SUBTEL) for connectivity context, Central Bank of Chile for macro and currency series, Chilean customs trade statistics for equipment import patterns, International Energy Agency (IEA)-style electricity indicators for power availability, and International Telecommunication Union (ITU) datasets for traffic and broadband adoption. We also reviewed company filings, investor presentations, press releases, and used paid subscriptions for company financials, shipment-level trade checks, and patent databases when they helped clarify technology transitions. This list is illustrative, and many other public and paid sources were also consulted for data collection, cross-checks, and clarification.
Primary Interviews and Surveys
Primary work focused on validating how fast Chile data center operators and large buyers are refreshing server fleets, and which configurations they are prioritizing as power density rises. We spoke with a mix of operators, channel participants, and enterprise IT teams across Chile, so that import trends, installed base assumptions, and pricing ranges could be adjusted to what is actually reflected in purchase cycles.
Distribution of primary research fieldwork respondents
| Company type | Respondent position |
|---|---|
| Top tier: 25% | CXOs: 14% |
| Mid tier: 57% | Functional/Unit leaders: 33% |
| Smaller Players: 18% | Managers: 53% |
Market-Sizing & Forecasting
Sizing starts from a demand-pool rebuild where data center capacity additions and refresh cycles are translated into expected server volumes, then multiplied by typical server pricing bands observed in Chile. The top-down view is anchored on Chile-specific signals such as announced new halls and expansions, estimated rack and power density ranges, and the refresh timing of general-purpose versus accelerated compute.
To keep the totals grounded, we corroborate results with selective bottom-up checks, including sampled price per server by form factor, channel feedback on mix shifts, and cross-checks against import movement trends for related server categories. Key model inputs include installed data center capacity growth, rack additions, average watts per server trend, virtualization and cloud workload adoption, and the pace of higher-core CPU and GPU-led configuration upgrades. For forecasting, we used scenario analysis supported by expert views on permitting timelines, power availability, and the timing of large campus expansions, then smoothed the demand curve to avoid unrealistic step changes when project dates move.
Data Validation & Update Cycle
Estimates are validated through multiple checks so the output stays consistent with what Chile data center stakeholders are seeing on the ground. Model totals are compared against independent signals like capacity expansion news flow, import directionality, and observed pricing shifts, and anomalies are reviewed before sign-off.
If a major variance shows up, respondents are re-contacted and assumptions are reworked until the gap can be explained in plain terms. Reports are refreshed annually, and interim updates are made when material events occur, such as large project delays, sudden currency moves, or step changes in power availability. Before delivery, a final analyst pass is done to confirm that the latest public releases and pricing context are reflected.
Mordor Intelligence's Chile Data Center Server Market Size Measured Against Other Published Estimates
Published market values for Chile data center servers can look far apart because not every source counts the same spend items, uses the same year cut, or applies the same price and volume logic. Differences also come from how imports are treated, how refresh is timed, and whether hyperscale and colocation builds are modeled from actual announced capacity or from broad growth assumptions.
Networking switches and storage arrays are often bundled into some server totals, but they sit outside Mordor Intelligence's scope here, which keeps the value tied to server hardware only and reduces double counting across adjacent infrastructure budgets.
Benchmark comparison
| Source | Market Size | Gaps in Research Methodology |
|---|---|---|
| Mordor Intelligence | USD 1.70 B (2025) | |
| Industry Tracker A | USD 1.56 B (2025) | Uses a conservative build pipeline and assumes slower refresh timing, which can understate replacement demand when higher-density configurations are adopted. |
| Global Consultancy B | USD 2.10 B (2026) | May include adjacent data center hardware and applies broader regional ASP uplift assumptions, which can overstate server-only spend in a single-country view. |
Across the three figures, the spread is mostly explained by what is counted as server spend versus nearby infrastructure, and by how quickly refresh waves are assumed to happen after new capacity comes online. By keeping inputs traceable to expansion activity, pricing bands, and refresh cadence checks, the final number stays easier to reproduce and update when project timelines shift.


Key Questions Answered in the Report
What is the current value of the Chile Data Center Server market?
The market stands at USD 1.91 billion in 2026 and is projected to reach USD 3.41 billion by 2031.
Which data-center tier dominates server demand in Chile?
Tier 3 facilities lead with 72.50% share in 2025, reflecting a balance of redundancy and cost efficiency.
How fast is hyperscale capacity growing in Chile?
Hyperscale deployments are forecast to expand at a 14.23% CAGR through 2031, driven by Amazon’s USD 4 billion region investment.
Why are AI workloads reshaping server purchases?
GPU-rich AI and ML applications already account for 37.60% of market revenue and require higher power densities and advanced cooling.
Page last updated on:
- Data Center Server Market
- Africa Data Center Server Market
- APAC Data Center Server Market
- Brazil Data Center Server Market
- Canada Data Center Server Market
- China Data Center Server Market
- Denmark Data Center Server Market
- Europe Data Center Server Market
- France Data Center Server Market
- Germany Data Center Server Market
- Hong Kong Data Center Server Market
- India Data Center Server Market


 Your data is secure and never sold or shared.


