
Catalyst Handling Services Market Size and Share
Market Overview
| Study Period | 2022 - 2032 |
|---|---|
| Market Size (2027) | USD 683.87 Million |
| Market Size (2032) | USD 855.49 Million |
| Growth Rate (2027 - 2032) | 4.58 % |
| Fastest Growing Market | Asia-Pacific |
| Largest Market | Asia-Pacific |
| Market Concentration | Medium |
Major Players *Disclaimer: Major Players sorted in no particular order Image © Mordor Intelligence. Reuse requires attribution under CC BY 4.0. | |
Catalyst Handling Services Market Analysis by Mordor Intelligence
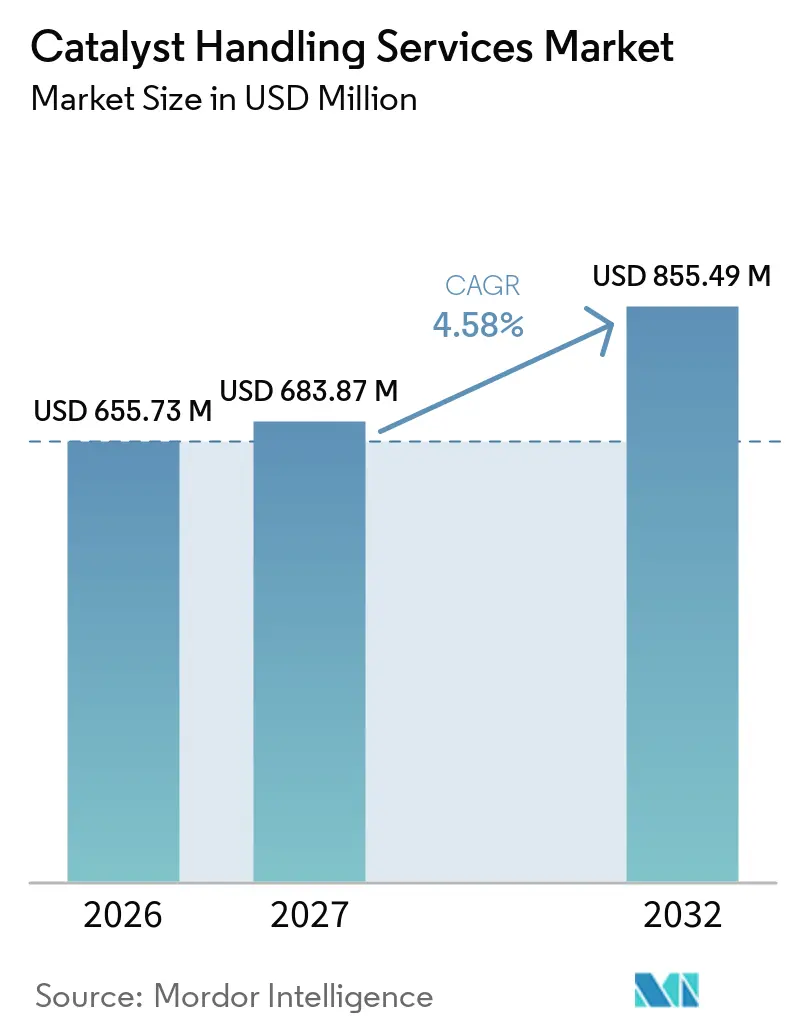
The Catalyst Handling Services Market size was valued at USD 655.73 million in 2026 and is estimated to grow from USD 683.87 million in 2027 to reach USD 855.49 million by 2032, at a CAGR of 4.58% during the forecast period (2027-2032). The catalyst handling services market is supported by refinery and petrochemical maintenance, where reactor catalyst must be changed at planned intervals to protect operating performance. This shifts service demand toward Asia-Pacific and the Middle East, where capacity additions and integrated refining projects require specialized turnaround support. Contractors are responding by combining catalyst work with inspection, decontamination, waste management, and remote reactor-entry services. This broader offering can strengthen contract positions, although skills shortages and lower fuel demand in mature economies continue to limit the pace of growth. The catalyst handling services market also depends on a limited window for planned maintenance, since operators must balance shutdown duration against lost production. Providers that can execute safely across loading, waste, and inspection work are therefore better placed to secure wider service scopes.
Key Report Takeaways
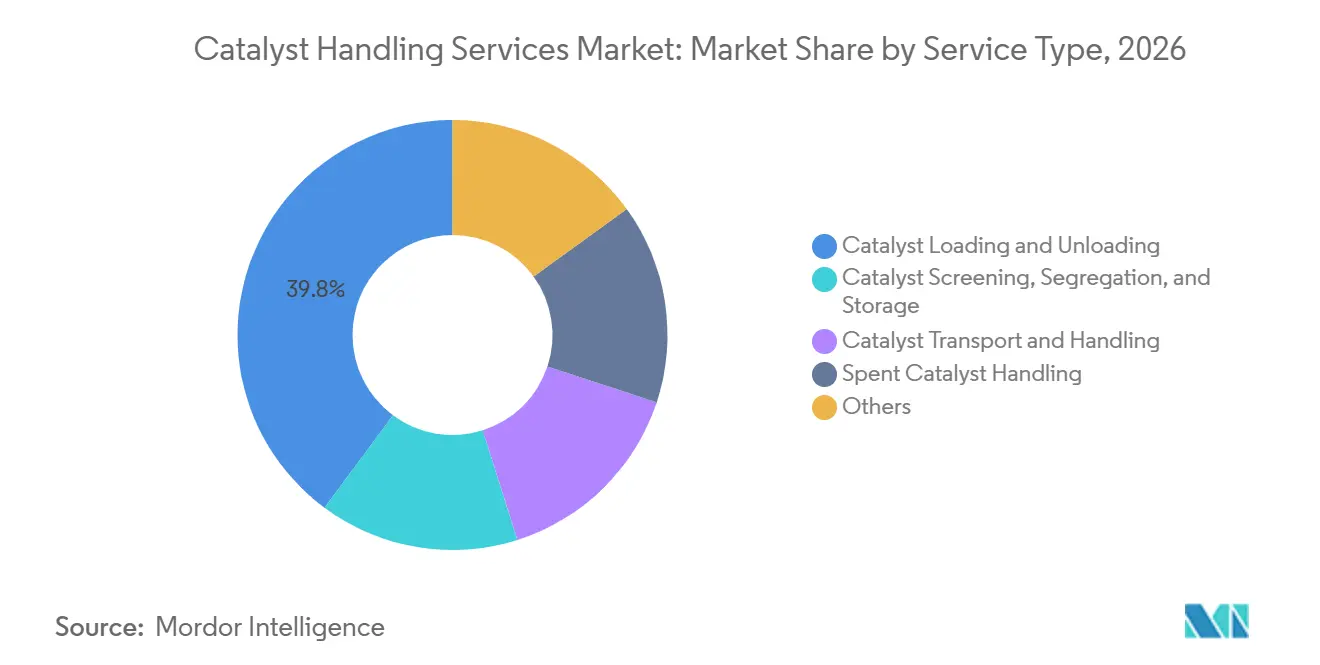
- By service type, catalyst loading and unloading held 39.84% of the catalyst handling services market share in 2026, while spent catalyst handling is forecast to advance at a 5.06% CAGR through 2032.
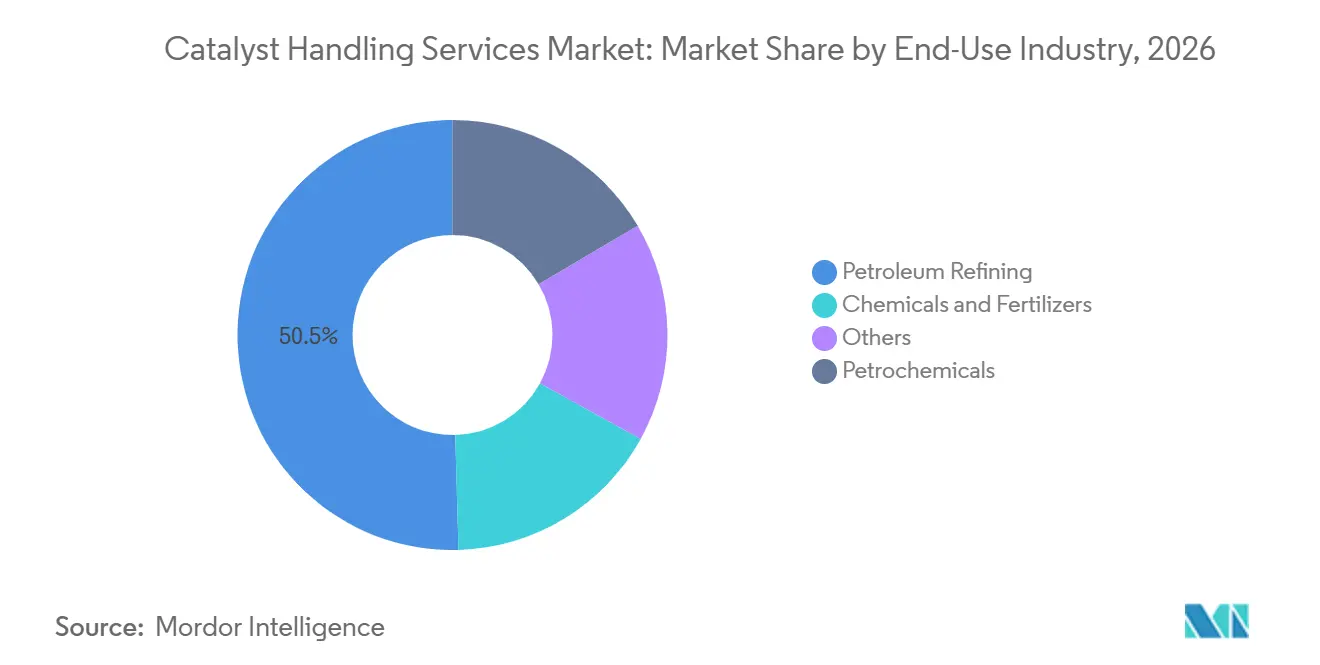
- By end-use industry, petroleum refining held 50.45% of the catalyst handling services market share in 2026, while chemicals and fertilizers are forecast to advance at a 5.37% CAGR through 2032.
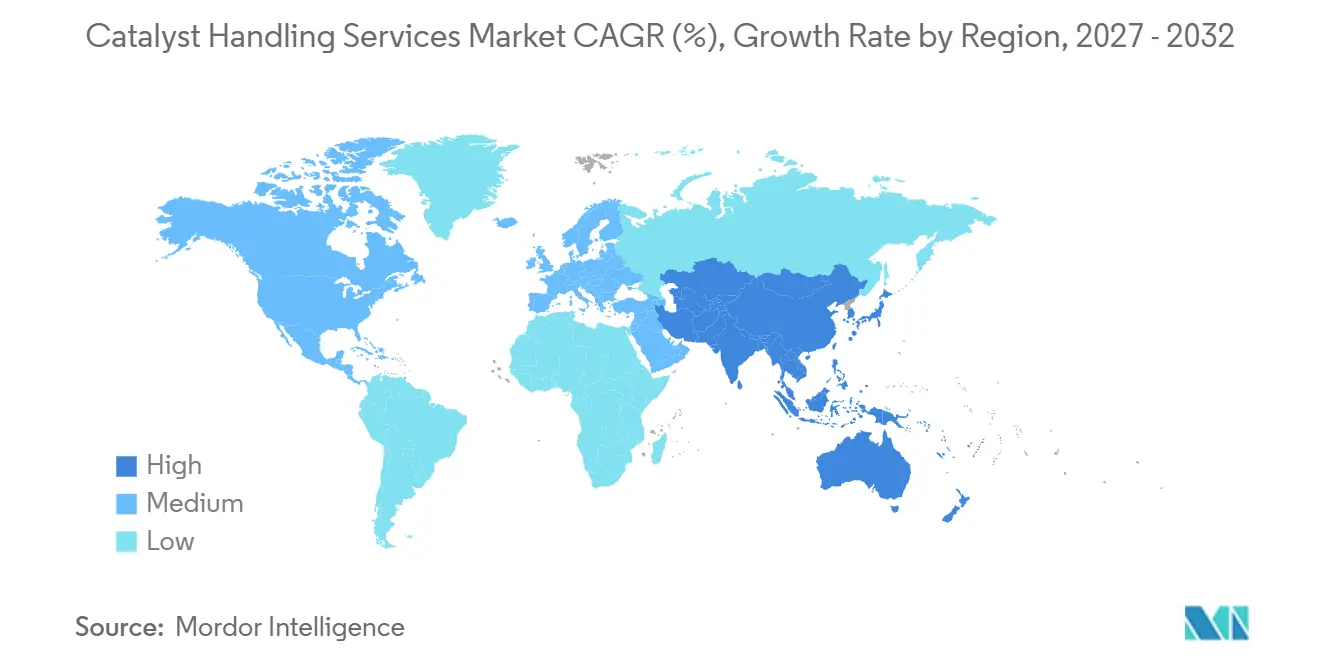
- By geography, Asia-Pacific held 32.31% of the catalyst handling services market share in 2026 and is forecast to advance at a 5.18% CAGR through 2032.
Note: Market numbers in this report are based on Mordor Intelligence's proprietary estimation framework, which combines nine months of actuals with Q4 projections for base year 2026.
Market Trends and Insights
Drivers Impact Analysis of Catalyst Handling Services Market*
| Driver | (~) % Impact on CAGR Forecast | Geographic Relevance | Impact Timeline |
|---|---|---|---|
| Stringent Emissions and Occupational-Safety Regulations | +1.3% | Global, with concentrated enforcement in North America, EU, and Australia | Short term (≤ 2 years) |
| Refinery and Petrochemical Capacity Expansion | +1.1% | APAC core (India, China), Middle East (Saudi Arabia, UAE, Iraq), spillover to MEA | Medium term (2-4 years) |
| Catalyst Fouling, Poisoning, and Turnaround Frequency | +0.9% | Global - highest intensity in mature APAC and Middle East refinery fleets | Short term (≤ 2 years) |
| Sustainability Through Spent-Catalyst Regeneration and Recycling | +0.6% | Europe, North America, APAC - spillover to MEA as circular economy mandates expand | Medium term (2-4 years) |
| Inert-Entry Automation and Robotic Handling Adoption | +0.4% | Europe (regulatory push), APAC (efficiency gains), North America | Long term (≥ 4 years) |
| Source: Mordor Intelligence | |||
Stringent Emissions and Occupational Safety Regulations
Regulatory requirements are changing how refinery operators select catalyst contractors in the catalyst handling services market. The Dutch Safety Board published findings in April 2025 after a fatal inert-entry accident at Zeeland Refinery and called for the industry to move away from traditional worker entry into nitrogen-purged reactors. The Netherlands Labour Authority also sets out the hazards involved in catalyst changeouts and the measures expected for safe work. U.S. process safety requirements require operators to manage hazards around covered chemical processes, which increases the importance of qualified contractor procedures. Refineries, therefore, seek providers with breathing-air systems, documented rescue plans, and proven confined-space procedures. These requirements make it harder for underprepared local firms to compete for high-risk work.
Refinery and Petrochemical Capacity Expansion
New refining and petrochemical projects are creating a larger base of reactors that need loading, unloading, and maintenance services. India plans to increase refining capacity from 258 million metric tons per annum to nearly 309 million metric tons per annum by 2028, with brownfield projects accounting for 58% of the increase[1]. Indian Oil has planned higher operations at its Gujarat refinery from mid-2026, adding near-term maintenance and reactor-service requirements. In Saudi Arabia, Aramco and Sinopec signed a framework agreement for a YASREF expansion with a 1.8 million metric tons per year steam cracker and a 1.5 million metric tons per year aromatics complex. Middle East refining capacity is set to add 618,000 barrels per day by 2029. Contractors located near Indian and Saudi project clusters can compete for commissioning support and later turnaround work.
Catalyst Fouling, Poisoning, and Turnaround Frequency
Catalyst fouling, metal poisoning, and coke deposition keep the catalyst handling services market tied to recurring maintenance rather than only to new construction. Refineries processing heavier crude can face faster catalyst deactivation in hydroprocessing and hydrocracking units. High-metal-content feedstocks can shorten the normal 2-4-year catalyst replacement cycle to 18 months in some operating conditions. Fluid catalytic cracking units also require continuous catalyst circulation and regular withdrawal of spent material. This creates work throughout the year for contractors who can screen, contain, and transport hazardous solids. Scientific research on spent hydrogenation catalysts shows that residual oil, carbon, and sulfur require specialized pretreatment before metal recovery.
Sustainability Through Spent Catalyst Regeneration and Recycling
Spent-catalyst management is becoming a more valuable part of the catalyst handling services market because it combines safe handling with materials recovery. Spent hydroprocessing catalysts can contain molybdenum, vanadium, nickel, and cobalt, which makes separation and recovery commercially relevant. Evonik Industries AG reported recovery rates of 20-75% for molybdenum from catalyst feedstock and stated that its program had kept more than 113,000 metric tons of spent catalyst from landfill. In October 2025, Ketjen and Axens announced an agreement under which Axens would acquire full ownership of Eurecat, while the business would continue to provide regeneration, recycling, unloading, and related reactor services through Petroval. The transaction illustrates why lifecycle services are being grouped together rather than sold as separate jobs. It also gives waste and recycling specialists a clearer route into refinery maintenance contracts.
Restraints Impact Analysis of Catalyst Handling Services Market*
| Restraint | (~) % Impact on CAGR Forecast | Geographic Relevance | Impact Timeline |
|---|---|---|---|
| Electric Mobility and Energy Transition Reducing Conventional Refinery Activity | -0.9% | North America, Western Europe - spillover to OECD Asia (Japan, South Korea) | Medium term (2-4 years) |
| Technical Complexity and Limited Skilled Workforce | -0.7% | Global - most acute in North America, Europe, and developing APAC markets | Short term (≤ 2 years) |
| Fragmented Turnaround Timing and Contractor Utilization Volatility | -0.4% | Global - most pronounced in regions with multiple small refineries | Short term (≤ 2 years) |
| Source: Mordor Intelligence | |||
Electric Mobility and Energy Transition Reducing Conventional Refinery Activity
Energy transition trends reduce the long-term addressable base for conventional refinery services in some developed economies. The International Energy Agency (IEA) expects global refined-products demand to peak at 86.3 million barrels per day in 2027, only 710,000 barrels per day above the 2024 level. It also expects declines in gasoline and diesel demand to exceed growth in naphtha and jet fuel after that point. China processed 75.5% of refinery nameplate capacity in 2024, while electric and liquefied natural gas (LNG) vehicles weakened fuel-demand growth. Lower refinery utilization can delay catalyst fouling and increase the time between major changeouts. The result is a geographic shift toward non-OECD refinery hubs rather than a uniform decline in the catalyst handling services market.
Technical Complexity and Limited Skilled Workforce
Certified labor remains a direct operational constraint for catalyst service providers. Inert-entry work requires training in breathing-air equipment, pyrophoric-material handling, dense-bed loading, and emergency response. Cat Tech and Technivac identify the Sentry 4 life-support system as part of their confined-space service capability, showing the level of equipment and training involved in this work. The Dutch Safety Board found that conventional entry methods were not being abandoned fast enough, even as alternatives were being developed. When several refineries schedule turnarounds at the same time, qualified crews can become scarce, and project costs can rise. Training investments and remote systems can relieve some pressure, but the skills gap remains an obstacle to rapid expansion.
*Our forecasts treat driver/restraint impacts as directional, not additive. The impact forecasts reflect baseline growth, mix effects, and variable interactions.
Catalyst Handling Services Market Segment Analysis
By Service Type:
Catalyst Loading and Unloading Anchor Revenue, Spent Catalyst Handling AcceleratesCatalyst loading and unloading accounted for 39.84% of the catalyst handling services market share in 2026. This work is central to scheduled reactor reloads, where loading quality affects catalyst-bed performance and run length. Dense-loading systems such as Cat Tech’s Turbocat, Mourik’s Densicat, and Catalyst Handling Resources’ licensed Hyperloader give contractors a technical basis for competing on more than labor availability. Catalyst Handling Resources holds a license for the Hyperloader technology from Catmasters. Screening, segregation, storage, and transport are commonly sold with loading and unloading packages. These services support steady demand, although standalone work can face competition from general industrial service providers.
Spent catalyst handling is expected to grow at a 5.06% CAGR through 2032. The work is gaining importance as disposal controls become stricter and recoverable metals improve the value of spent material. Contractors must manage containment, passivation, segregation, transport, and recovery logistics in a manner that protects workers and meets site requirements. A 2025 patent application describes inert-gas systems for separating oxidizable catalyst material from inert support media. Cat Tech’s CATnap passivation service is an example of a specialist approach that aims to stabilize reactive metal sulfides before handling. These capabilities can reduce shutdown time and lower the need for personnel to enter reactor vessels.

By End-Use Industry:
Petroleum Refining Dominates, Chemicals and Fertilizers Surge AheadPetroleum refining held 50.45% of the catalyst handling services market size in 2026. Hydroprocessing, catalytic reforming, and fluid catalytic cracking units each require carefully sequenced catalyst replacement during turnaround periods. The cost of an overrun can be high because refinery output stops while a unit is offline. This makes speed, safety, and first-time execution important buying criteria. Refineries are also increasing their petrochemical integration, which broadens the mix of reactor designs handled during a single shutdown. Projects in India and Saudi Arabia show how refining and chemicals investments are increasingly being developed together.
Chemicals and fertilizers are forecast to grow at a 5.37% CAGR through 2032. Ammonia and urea additions in South Asia and the Middle East are supporting demand for reactor maintenance and catalyst services. The International Fertilizer Association expects nitrogen fertilizer consumption to rise by 1.9% per year through 2028. Scientific literature also indicates that newer catalyst formulations in ammonia synthesis and nitric-acid production can be replaced more frequently to support lower-emission operations. ISO 9001, ISO 14001, and ISO 45001 are increasingly relevant in contractor selection for chemical and fertilizer sites. Compliance can favor established providers that can document quality, environmental, and occupational safety systems.
Geography Analysis
Asia-Pacific
Asia-Pacific accounted for 32.31% of the catalyst handling services market share in 2026 and is forecast to grow at a 5.18% CAGR through 2032. India is a central source of new work because its refining capacity is planned to approach 309 million metric tons per annum by 2028. Higher utilization at Indian Oil’s Gujarat refinery also increases the need for planned unit maintenance. China provides scale through its large fleet, while its capacity cap directs attention toward reliability and operational performance at existing plants. South Korea and Japan remain relevant for high-complexity petrochemical and specialty-refining work. The catalyst handling services market benefits in this region from contractors that can mobilize qualified teams across several countries during concentrated turnaround periods. CR3 Group’s regional operating presence illustrates the value of a broad Asian footprint when refinery owners need consistent procedures across sites.
Middle East and Africa
Middle East investment is moving the region toward larger integrated refining and chemicals sites. The YASREF framework agreement involves a 1.8 million metric tons per year steam cracker and a 1.5 million metric tons per year aromatics complex. Regional refining capacity is projected to increase by 618,000 barrels per day by 2029. Local firms such as ANABEB and Kanooz Contracting Company can benefit from Saudi in-country value requirements and local refinery relationships. Veolia’s work at ADNOC Refining in Al Ruwais covers 70,000 metric tons of industrial waste a year, with the capacity to increase to 165,000 metric tons, demonstrating the link between hazardous-waste management and refinery service work. This creates scope for contractors that can manage catalyst-related waste as well as reactor work. It also makes local workforce development and contractor compliance important factors in the catalyst handling services market. New projects can require services at commissioning, during early maintenance cycles, and across later full-site turnarounds.
North America, Europe, and South America
North America has a stable refinery-service base, supported by 18.4 million barrels per day of U.S. atmospheric distillation capacity as of January 2025[2]. EPA Risk Management Program requirements and OSHA process-safety obligations make qualified contractor systems important in this region. Europe faces weaker fuel demand and a higher risk of refinery closures, with the IEA expecting 1.6 million barrels per day of global refinery capacity closures by 2030, largely in high-cost sites. That change can shift European work toward decommissioning, spent-catalyst recovery, and final-cycle turnarounds. In South America and Africa, newer facilities such as Nigeria’s Dangote refinery create additional maintenance demand as operations ramp up. The catalyst handling services market size in these mixed geographies will therefore depend on the balance between mature-asset closures and new integrated capacity. Contractors in Europe may need to make waste recovery and safe plant closure a larger part of their offer. North American providers can continue to compete on regulatory compliance, inspection integration, and turnaround certainty.
Competitive Landscape
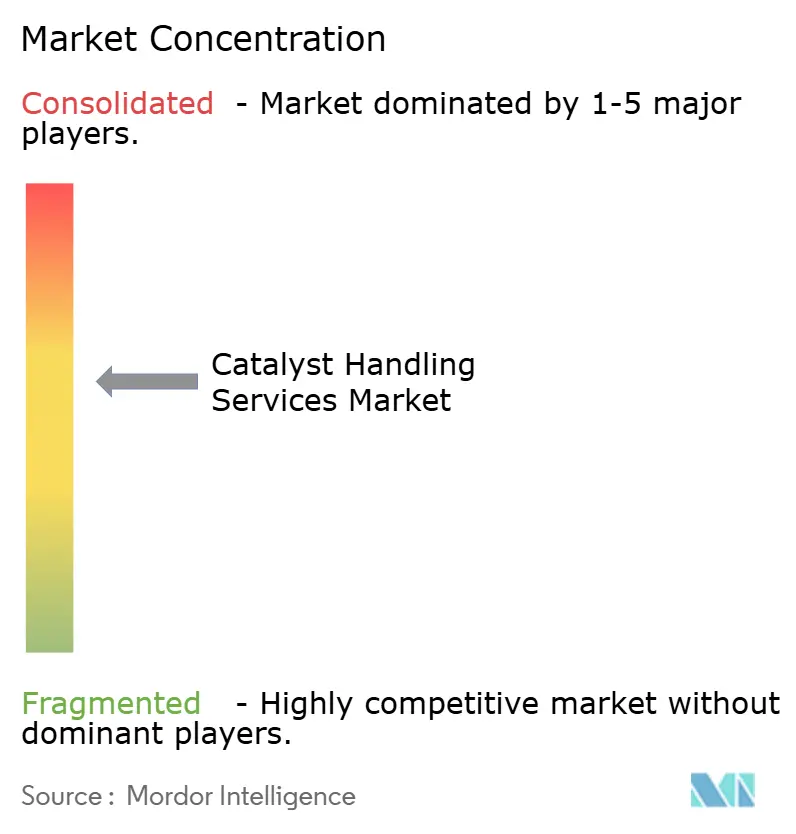
The catalyst handling services market is moderately concentrated, with the top five players including Mourik, ANABEEB, CR3 Group, Dickinson Group of Companies, and Catalyst Handling Resources. Regional contractors compete through site relationships, local compliance knowledge, and crew availability. This mix limits the control that any single company can exert over service pricing. ISO 9001, ISO 14001, and ISO 45001 credentials are increasingly basic requirements for high-value customer qualification. REMONDIS supports the broader competitive field through its BUCHEN-ICS subsidiary and spent-catalyst recycling capabilities. The catalyst handling services market, therefore, remains open to specialists who can prove technical capability at individual sites.
Companies are expanding their offer by adding adjacent inspection, cleaning, and waste services. USA DeBusk acquired CIMA Inspection in February 2025, adding non-destructive testing to its turnaround offering. Cleanaway completed its acquisition of Contract Resources in July 2025 for AUD 377 million, retaining the Contract Resources brand and leadership team. The combined business connects waste-management capabilities with catalyst handling, decontamination, and chemical cleaning. ShawKwei and Liberty Energy Solutions also completed the acquisition and delisting of PEC Ltd in June 2025, combining PEC’s maintenance and Engineering, Procurement, and Construction (EPC) services with CR3 Group’s operating footprint. These transactions favor providers able to manage wider scopes during complex shutdowns. They also reduce the number of separate contractors that an operator must coordinate during a refinery turnaround.
Technology is another way firms can distinguish their service propositions in the catalyst handling services market. Mourik introduced the CatSpider remote-operated suction arm to Europe in July 2025, allowing catalyst to be removed without people entering oxygen-depleted reactors. Sinopec reported that a robotic unloading system reduced single-reactor unloading time by 11 hours and improved efficiency by 15% at a natural-gas purification plant. Remote systems may reduce exposure to confined-space hazards and help contractors work around the shortage of certified personnel. The equipment can also make project scheduling more predictable when qualified inert-entry crews are unavailable. Multi-regional frame agreements are likely to favor firms that can deploy skilled crews across several reactor types on the same site. Providers that pair automation with life-support and recovery services can address safety and productivity in the same work package.
Catalyst Handling Services Industry Leaders
-
Mourik
-
ANABEEB
-
CR3 Group
-
Dickinson Group of Companies
-
Catalyst Handling Resources
- *Disclaimer: Major Players sorted in no particular order
Catalyst Handling Services Market Companies Covered in this Report
- ANABEEB
- BUCHEN Industrial Services N.V.
- Cat Tech
- Catalyst Handling Resources
- Contract Resources
- CR3 Group
- Dickinson Group of Companies
- Group Peeters
- Kanooz Contracting Company
- Mourik
- Nico Industrial Services
- Plant-Tech Industrial Services Limited
- REMONDIS SE & Co. KG
- Technivac
- USA DeBusk
- Veolia
Recent Industry Developments in Catalyst Handling Services Market
- October 2026: Indian Oil Corporation Limited invited bids for catalyst unloading, loading, and associated activities at its Paradip Refinery in Odisha through the Government e-Marketplace. The development supports the catalyst handling services market by demonstrating demand for specialized catalyst changeout services and contractor support at refinery facilities.
- October 2025: Ketjen Corporation and Axens SA announced a restructuring of their collaboration with Eurecat SA. Under the agreement, Ketjen would continue collaborating with Eurecat on catalyst rejuvenation, regeneration, ex-situ sulfiding and spent-catalyst processing, while Axens would acquire full ownership of Eurecat upon completion. The development supports the catalyst handling services market by highlighting strategic changes in catalyst lifecycle services, including regeneration and spent-catalyst management.
Global Catalyst Handling Services Market Report Scope
Catalyst handling services encompass specialized operations for managing catalysts used in industrial processing units. These services support safe handling, catalyst integrity, and efficient plant operations during routine maintenance, catalyst replacement, and scheduled shutdowns.
The Catalyst Handling Services Market is segmented by service type, end-use industry, and geography. By service type, the market is segmented into catalyst loading and unloading, catalyst screening, segregation, and storage, catalyst transport and handling, spent catalyst handling, and others. By end-use industry, the market is segmented into petroleum refining, chemicals and fertilizers, petrochemicals, and others. The report also covers the market size and forecasts for catalyst handling services across 15 countries. For each segment, the market sizing and forecasts have been done on the basis of value (USD).
Segmentation Overview
| Catalyst Loading and Unloading |
| Catalyst Screening, Segregation, and Storage |
| Catalyst Transport and Handling |
| Spent Catalyst Handling |
| Others |
| Petroleum Refining |
| Chemicals and Fertilizers |
| Petrochemicals |
| Others |
| Asia-Pacific | China |
| India | |
| Japan | |
| South Korea | |
| Rest of Asia-Pacific | |
| North America | United States |
| Canada | |
| Mexico | |
| Europe | Germany |
| United Kingdom | |
| France | |
| Italy | |
| Rest of Europe | |
| South America | Brazil |
| Argentina | |
| Rest of South America | |
| Middle East and Africa | Saudi Arabia |
| South Africa | |
| Rest of Middle East and Africa |
| By Service Type | Catalyst Loading and Unloading | |
| Catalyst Screening, Segregation, and Storage | ||
| Catalyst Transport and Handling | ||
| Spent Catalyst Handling | ||
| Others | ||
| By End-Use Industry | Petroleum Refining | |
| Chemicals and Fertilizers | ||
| Petrochemicals | ||
| Others | ||
| By Geography | Asia-Pacific | China |
| India | ||
| Japan | ||
| South Korea | ||
| Rest of Asia-Pacific | ||
| North America | United States | |
| Canada | ||
| Mexico | ||
| Europe | Germany | |
| United Kingdom | ||
| France | ||
| Italy | ||
| Rest of Europe | ||
| South America | Brazil | |
| Argentina | ||
| Rest of South America | ||
| Middle East and Africa | Saudi Arabia | |
| South Africa | ||
| Rest of Middle East and Africa | ||
Key Questions Answered in the Report
What is the projected size of the catalyst handling services market by 2032?
The catalyst handling services Market size was valued at USD 655.73 million in 2026 and is estimated to grow from USD 683.87 million in 2027 to reach USD 855.49 million by 2032, at a CAGR of 4.58% during the forecast period (2027-2032).
Which service type held the largest share in 2026?
Catalyst loading and unloading held 39.84% of the market share in 2026 because reactor reload cycles remain essential to refinery operations.
Which service type is forecast to grow fastest through 2032?
Spent catalyst handling is forecast to grow at a 5.06% CAGR through 2032, supported by hazardous-waste controls and recovery of valuable metals.
Which end-use industry held the largest share in 2026?
Petroleum refining held 50.45% of the market share in 2026 because hydroprocessing, reforming, and fluid catalytic cracking units require planned catalyst changes.