Bone Densitometer Systems Market Size and Share
Market Overview
| Study Period | 2020 - 2031 |
|---|---|
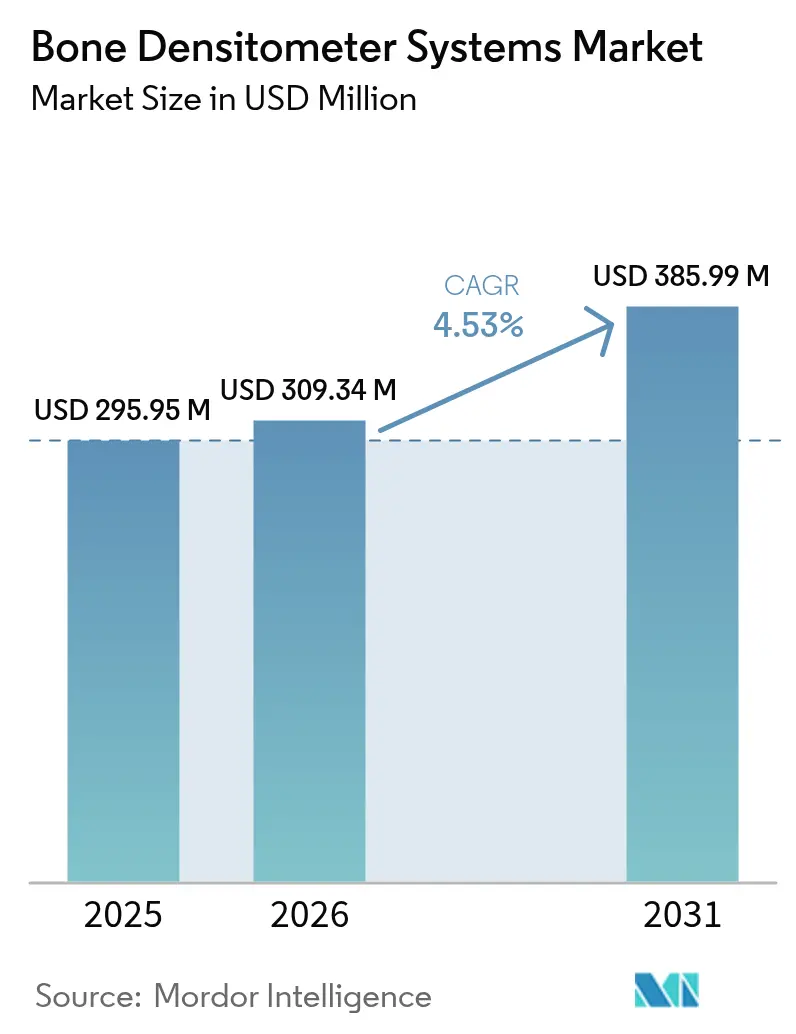
| Market Size (2026) | USD 309.34 Million |
| Market Size (2031) | USD 385.99 Million |
| Growth Rate (2026 - 2031) | 4.53% CAGR |
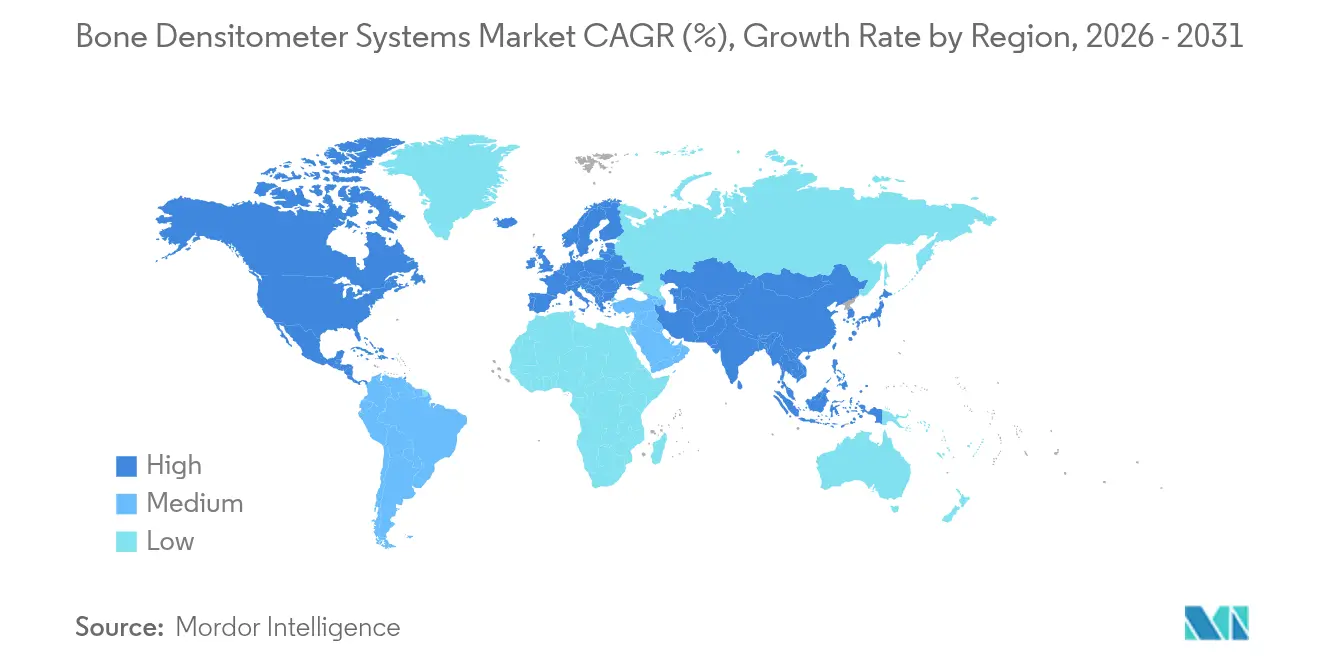
| Fastest Growing Market | Asia Pacific |
| Largest Market | North America |
| Market Concentration | Medium |
Major Players*Disclaimer: Major Players sorted in no particular order Image © Mordor Intelligence. Reuse requires attribution under CC BY 4.0. | |
Bone Densitometer Systems Market Analysis by Mordor Intelligence
The bone densitometry systems market size in 2026 is estimated at USD 309.34 million, growing from 2025 value of USD 295.95 million with 2031 projections showing USD 385.99 million, growing at 4.53% CAGR over 2026-2031. Growth is propelled by aging populations, rising osteoporosis prevalence, and the rapid integration of artificial intelligence that enables opportunistic screening on existing CT images without extra radiation. Hardware and software innovation, coupled with portable system roll-outs in pharmacies and community clinics, are widening access and tightening follow-up protocols. Vendors are also prioritizing radiation-free modalities such as quantitative ultrasound and REMS, a shift that answers safety concerns while opening doors to primary-care deployment. Regional opportunities are strongest in Asia Pacific, where demographic shifts and expanding health-insurance schemes support accelerated device adoption. Meanwhile, reimbursement pressures and technologist shortages in North America are prompting providers to embrace cloud-based analytics, automated quality control, and shared-service models that keep scanning costs in check.
Key Report Takeaways
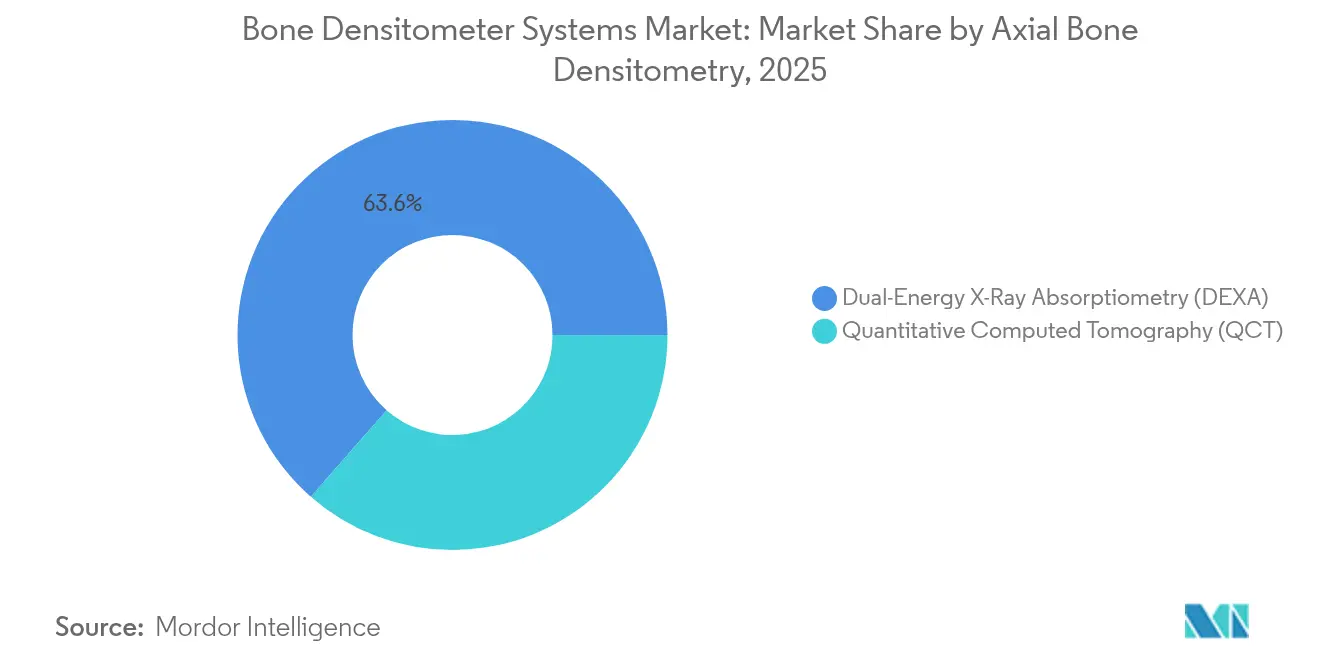
- By technology, Dual-energy X-ray absorptiometry led with 63.55% of bone densitometry systems market share in 2025, whereas quantitative ultrasound is forecast to grow at a 10.21% CAGR to 2031.
- By end user, Hospitals held a 52.85% revenue share in 2025, and diagnostic imaging centers are advancing at a 9.77% CAGR through 2031.
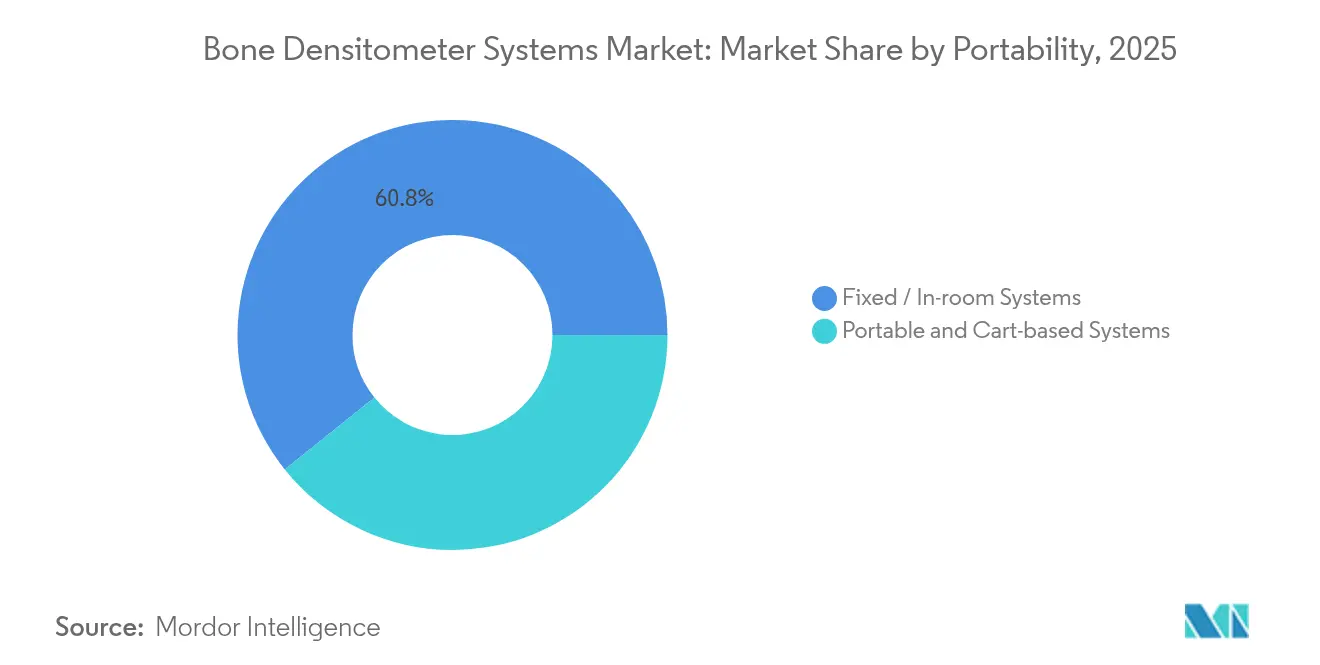
- By portability, Fixed systems accounted for 60.75% of the bone densitometry systems market in 2025; portable and cart-based systems are expanding at a 11.98% CAGR.
- By application, Osteoporosis diagnosis represented 71.95% of the bone densitometry systems market in 2025, while body composition analysis is projected to post an 11.32% CAGR.
- By component, Hardware dominated with a 68.55% share in 2025; the software and analytics segment is growing at a 12.79% CAGR.
- By geography, North America commanded 24.32% of the bone densitometry systems market in 2025, yet Asia Pacific is set to record the fastest 8.19% CAGR.
Note: Market size and forecast figures in this report are generated using Mordor Intelligence’s proprietary estimation framework, updated with the latest available data and insights as of 2026.
Global Bone Densitometer Systems Market Trends and Insights
Drivers Impact Analysis*
| Driver | (~) % Impact on CAGR Forecast | Geographic Relevance | Impact Timeline |
|---|---|---|---|
| Surge In Incidence Of Osteoporosis & Vitamin-D Deficiency | +1.20% | Global, with highest impact in Asia Pacific and aging European populations | Long term (≥ 4 years) |
| Rapidly Ageing Population Base | +0.90% | North America & EU core, with spillover to developed APAC markets | Long term (≥ 4 years) |
| Wider Adoption Of Densitometers In Primary Care Settings | +0.80% | North America & EU, with early adoption in urban APAC centers | Medium term (2-4 years) |
| Continuous DXA & QUS Technology Upgrades | +0.60% | Global, with faster adoption in high-income markets | Medium term (2-4 years) |
| Point-Of-Care Portable DXA Roll-Out In Pharmacies | +0.40% | North America core, pilot programs in EU and APAC | Short term (≤ 2 years) |
| AI-Enabled Opportunistic BMD Reading From CT Archives | +0.30% | North America & EU advanced healthcare systems | Short term (≤ 2 years) |
| Source: Mordor Intelligence | |||
Surge in Incidence of Osteoporosis & Vitamin D Deficiency
The osteoporosis burden now touches an estimated 500 million individuals, and epidemiologists forecast that more than half of all fragility fractures will occur in Asia by 2050. In China alone, 13.54% of adults show DXA-defined osteoporosis, equating to roughly 145.86 million people.[1]Liu Z. et al., “Osteoporosis Prevalence in China,” bmj.comVitamin D deficiency compounds fracture risk and has catalyzed device innovation, such as the FDA-cleared Osteoboost wearable that slows bone loss in post-menopausal women. Health-system costs remain steep: Medicare spent USD 5.7 billion on osteoporotic fractures in 2016, yet only 9% of women with a fracture received a follow-up DXA scan within six months, illustrating persistent screening gaps. High unmet need sustains demand for the bone densitometry systems market across hospitals, imaging centers, and new pharmacy-based programs.
Rapidly Ageing Population Base
Adults aged 65 years or older are set to double globally by 2050, intensifying screening requirements. Medicare has already expanded bone-mass-measurement coverage to include bone-disease-arthritis and relaxed copay rules to boost uptake.[2]Federal Register, “Medicare Coverage of Bone Mass Measurements,” federalregister.gov Countries such as Japan and South Korea, where one-quarter of citizens surpass age 65, are scaling community DXA programs and piloting remote read-outs. Workforce supply lags; technologist vacancy rates reached 6.9% in 2023, pushing providers to adopt AI triage and tele-interpretation to maintain service levels. As fracture incidence rises, hip fractures alone may climb 310% in men and 240% in women. As 2050 accessible scanning becomes an imperative for cost-containment.
Wider Adoption of Densitometers in Primary-Care Settings
Miniaturized DXA units and reimbursement parity are moving scans out of radiology suites. Mobile DXA clinics in the United States have proven financially sustainable while cutting travel barriers for rural seniors. Pharmacist-run screenings identify medium- or high-risk osteoporosis in roughly one-third of participants, a figure that highlights retail health’s screening potential.[3]Summers B., Brock T., “Pharmacy-Based Osteoporosis Screening,” japha.org Regulatory differences persist—many states still insist certified radiologic technologists run peripheral DXA—but quantitative ultrasound, which is radiation-free and easier to operate, sidesteps those constraints. Vendors now deliver touch-screen interfaces and automated calibration to simplify primary-care workflows.
Continuous DXA & QUS Technology Upgrades
Guideline writers stress standardized reference ranges, routine phantom calibration, and cross-manufacturer harmonization. REMS brings radiation-free bone mineral density plus a “Fragility Score,” providing micro-architectural insight beyond conventional T-scores. AI programs that mine routine CT images achieve AUC values near 0.81 for osteoporosis detection, leveraging existing scans to expand case finding without new exposures. These systems, integrated with cloud dashboards, now auto-flag incidental vertebral compression fractures and dispatch result letters to primary physicians, streamlining follow-through care.
Restraints Impact Analysis*
| Restraint | (~) % Impact on CAGR Forecast | Geographic Relevance | Impact Timeline |
|---|---|---|---|
| Radiation & Safety Concerns With Serial Scans | -0.70% | Global, with heightened sensitivity in EU and developed APAC markets | Medium term (2-4 years) |
| High Capital & Lifecycle Cost Of DXA Systems | -0.50% | Emerging markets and rural healthcare systems globally | Long term (≥ 4 years) |
| Shortage Of Trained DXA Technologists | -1.20% | North America & EU core, with spillover to developed APAC markets | Short term (≤ 2 years) |
| Slow Harmonisation Of ISO-10012 Calibration Standards | -0.80% | Global, with highest impact in multi-site healthcare networks | Medium term (2-4 years) |
| Source: Mordor Intelligence | |||
Radiation & Safety Concerns with Serial Scans
Although a DXA exam emits only 0.001–0.01 mSv—similar to one day of background exposure—cumulative doses over decades worry clinicians and younger patients. Regulators responded with refreshed dose-control guidance that obliges manufacturers to embed optimization algorithms and heightened shielding. The attention is steering demand toward radiation-free REMS and ultrasound, while also spurring ultra-low-dose DXA research. Providers increasingly apply ALARA principles and run patient-education campaigns to counter misconceptions that may delay vital scans.
High Capital & Lifecycle Cost of DXA Systems
Premium DXA units list between USD 100,000 and USD 300,000, and service contracts, phantoms, and technologist salaries can push annual operating spend past USD 50,000. In contrast, U.S. Medicare reimburses USD 53.26 for an axial skeleton scan, a mismatch that has forced many independent practices to retire scanners. Consequently, emerging vendors promote USD 50,000 ultrasound platforms and lease-to-own bundles that lower acquisition risk for small providers. Health systems are also pooling assets through hub-and-spoke sharing or mobile fleets that rotate equipment among clinics to maximize utilization.
*Our forecasts treat driver/restraint impacts as directional, not additive. The impact forecasts reflect baseline growth, mix effects, and variable interactions.
Segment Analysis
By Technology: Ultrasound Disruption Challenges DXA Supremacy
The bone densitometry systems market remains anchored by DXA, which secured 63.55% revenue in 2025 thanks to entrenched clinical guidelines and broad payer coverage. Yet quantitative ultrasound is rising quickly with a double-digit CAGR and threatens to erode DXA’s dominance as providers migrate to radiation-free workflows. Quantitative computed tomography retains a foothold for three-dimensional, trabecular-focused research but is too costly for routine assessment. REMS, an ultrasound-derived modality, exemplifies the leap toward portable, AI-ready devices that can operate in retail clinics or bedside settings.
Manufacturers are racing to enhance detector sensitivity, automate phantom calibration, and embed machine learning that generates fracture-risk scores in real time. Several systems now link directly to electronic health records, routing alerts when T-scores drop beyond monitored thresholds. Such integrations help sustain the bone densitometry systems market by embedding measurements into chronic-disease dashboards. Meanwhile, opportunistic screening software mines archived CT scans, a workflow that expands the bone densitometry systems market size without any hardware outlay. As radiation-free modalities gain guideline recognition, buyers weigh total cost-of-ownership, throughput, and AI support when upgrading fleets.


By End User: Imaging Centers Narrow the Hospital Gap
Hospitals still anchor the bone densitometry systems market, holding 52.85% of study volumes in 2025. Their dominance rests on integrated electronic records, on-site specialists, and bundled reimbursement for fracture management pathways. Nonetheless, imaging centers are advancing at 9.77% CAGR as outpatient demand rises and insurers steer low-complexity scans toward cost-efficient settings. Pharmacist-run programs and orthopedic clinics form a third pillar, leveraging compact ultrasound or REMS units that fit small footprints and need limited shielding.
To counter workforce deficits, hospitals increasingly outsource secondary reads to teleradiology pools, while imaging centers deploy AI triage that pre-sorts normal studies, shortening technologist workloads. Rural facilities, unable to justify dedicated scanners, contract rotating mobile services-a model that extends the bone densitometry systems market into new ZIP codes. Providers that blend remote read-outs with automated quality control can maintain ISO compliance even with lean staffing. This distributed care fabric is central to sustaining growth as demographics steepen fracture risk curves.
By Application: From Osteoporosis Diagnosis to Whole-Body Insights
Osteoporosis detection remains the backbone of demand, accounting for 71.95% of the bone densitometry systems market size in 2025. Rising fracture incidence and pay-for-performance incentives to reduce rehospitalizations anchor its dominance. Body-composition analysis is the fastest climber, fueled by sports performance, obesity management, and sarcopenia monitoring among aging adults. Modern DXA and REMS software now deliver visceral-fat and lean-mass segmentation in under two minutes, expanding clinical utility.
Paediatrics, though niche, benefits from the zero-dose profile of REMS for monitoring chronic steroid therapy. Sports medicine programs using whole-body DXA to fine-tune training in elite athletes illustrate diversification. These broadened indications keep the bone densitometry systems market appealing to venture investors and spur vendors to refine multi-parametric dashboards that fit lifestyle-medicine consults.
By Portability: Mobile Innovation Gains Momentum
Fixed scanners still own 60.75% revenue in 2025, yet portable and cart-based units are charting a 11.98% CAGR and widening the bone densitometry systems market footprint. Battery-powered ultrasound and compact DXA carts roll easily between exam rooms or onto community vans. Pharmacy chains deploy them alongside flu-shot booths, offering “scan-while-you-shop” convenience that elevates preventive-care adherence. Mobile fleets in Australia and the United States deliver 30-40 scans per day in remote towns, proving volume economics outside brick-and-mortar imaging centers.
Wireless data upload, cloud PACS, and near-instant AI interpretation compress turnaround from days to minutes. As a result, clinicians can adjust osteoporosis therapy during the same visit, a workflow that bolsters medication adherence and positions portable platforms as chronic-care enablers. The portability wave also penetrates emerging markets where infrastructure is spotty; devices that run off car batteries or solar chargers expand the bone densitometry systems market into village health posts.
By Component: Software & Analytics Capture New Value
Hardware still anchors 68.55% of revenue, but software and analytics are outpacing at a 12.79% CAGR as hospitals chase productivity gains. Cloud-hosted AI now quantifies vertebral deformities, cross-checks calibration drift, and flags outliers needing manual review, functions that reduce repeat scans and elevate reimbursement compliance. Consumables-phantoms, positioning aids, disposable patient covers-offer steady margin but little differentiation.
Integrated dashboards knit together DXA, ultrasound, and CT-derived bone data into unified patient views, a capability increasingly demanded by accountable-care organizations. Vendors bundle subscription licenses into hardware quotes, smoothing cash flows and tightening lock-in. This fusion of hardware excellence and SaaS-style updates positions the bone densitometry systems market for durable digital recurring revenue.
Geography Analysis
North America commanded 24.32% of the bone densitometry systems market in 2025 due to well-established reimbursement, high osteoporosis awareness, and deep installed DXA bases. CMS’s decision to waive patient copays for preventive scans sustains routine testing, although declining fee schedules squeeze outpatient margins. Technologist shortages-vacancies hit 6.9%-push providers to embrace AI and remote read models to maintain throughput. Rural screening remains patchy, fueling growth in mobile vans and pharmacy programs that bring scanners closer to at-risk seniors.
Asia Pacific is the engine of future expansion, clocking an 8.19% CAGR. China alone counts nearly 146 million osteoporotic adults, a prevalence that drives provincial health budgets to subsidize community DXA rooms. Japan mandates DXA in its “Checkup Kensa” for seniors, while South Korea’s national insurance added portable REMS codes in 2025. Vendors such as DMS Group posted 68% sales growth in Asia during 2024, underscoring the region’s appetite for smart, space-saving units
Europe delivers steady, mid-single-digit growth behind harmonized guidelines and robust fracture-liaison services. Italy officially endorsed REMS in 2024, unlocking reimbursement for radiation-free scans. The European Spine Phantom anchors calibration consistency across multination networks, supporting reliable longitudinal comparisons. Middle East & Africa and South America trail in adoption but represent white-space where mobile units and shared-service leasing offset budget constraints and specialist scarcity, broadening the global bone densitometry systems market.

Regulatory Landscape
In the United States, bone densitometers are regulated by the FDA as Class II diagnostic devices under 21 CFR 892.1170, so most systems enter through the 510(k) pathway alongside obligations such as Quality System compliance and postmarket reporting. FDA-recognized consensus standards shape product design and verification for electrical safety and essential performance, including the IEC 60601-1 family (recognized in the US via ANSI/AAMI ES60601-1). This is especially relevant as vendors add AI-enabled analytics and connectivity into densitometry workflows.
In Europe, commercial continuity increasingly depends on compliance with the Medical Device Regulation (EU) 2017/745 (MDR), which replaced the legacy Medical Devices Directive and raised documentation, clinical evaluation, and postmarket requirements. DMS Group's April 2026 announcement that it obtained EU MDR certification for its STRATOS and STRATOS DR bone densitometer product lines illustrates how the MDR transition can affect competition, helping it sustain access to EU tenders while other suppliers work through notified-body capacity constraints.
Competitive Landscape
Market leadership remains with GE HealthCare, Hologic, and DMS Group, whose combined 2024 revenue captured roughly two-thirds of device sales. Hologic’s skeletal-health revenue, however, slid 37.8% in Q1 2025 as purchasers deferred upgrades and shifted toward ultrasound. GE HealthCare responded by layering AI on its Lunar line and launching ecosystem APIs that plug into hospital analytics platforms. DMS Group is pushing Onyx Mobile and the ADAM AI suite to ride the portability wave in Asia.
Emerging specialists such as Echolight (REMS) and Osteometer Meditech (pQUS) court primary-care and pharmacy chains with radiation-free units that bypass shielding rules. Nanox leverages its CT-analysis AI to identify osteoporosis during chest-scan reads, positioning software as a hardware-agnostic disrupter. Strategic plays include cross-licensing calibration algorithms, joint cloud-platform builds, and athlete-wellness sponsorships (e.g., Hologic’s WTA partnership that equips tennis events with Horizon DXA vans). Component resilience is now top of mind after FDA flagged supply-chain vulnerabilities for critical imaging parts in 2024.
As procurement shifts toward bundled hardware-plus-analytics, incumbents without SaaS depth risk share erosion. Conversely, ultrasound entrants must prove longitudinal reproducibility to win guideline parity. Competitive intensity will stay high as buyers weigh portability, AI sophistication, and total cost of ownership when refreshing fleets across the bone densitometry systems market.
Bone Densitometer Systems Industry Leaders
Hologic Inc.
MEDILINK
Swissray International, Inc.
DMS Imaging
GE Healthcare
- *Disclaimer: Major Players sorted in no particular order

Market Opportunities and Future Outlook
A clear whitespace sits in workflow models that expand osteoporosis case-finding without adding scanning capacity, including opportunistic assessment from existing imaging and simplified reporting for non-specialist settings. Research momentum around deep learning for extracting bone biomarkers and fracture risk from routine CT and other imaging, combined with health-system interest in opportunistic screening, supports an approach where densitometer vendors bundle hardware with cloud analytics. Those tools can triage, standardize outputs, and reduce dependence on scarce DXA technologists.
The screening gap remains visible in care pathways (for example, low post-fracture follow-up DXA completion noted in the current report context), so solutions that automate referral prompts and longitudinal tracking can convert unmet need into measurable scan volume across hospitals and imaging centers. Regulatory and guideline anchors are also opening near-term commercial lanes for refreshed and compliant product portfolios. In April 2026, GE Medical Systems Ultrasound & Primary Care Diagnostics, LLC received FDA 510(k) clearance for the Lunar Astra bone densitometer, supporting replacement demand and upgraded installed bases in markets tied to FDA clearance and payer-backed DXA pathways. At the same time, Europe-facing suppliers that clear MDR hurdles gain tender eligibility and reduce disruption risk from the MDR transition, as reflected in DMS Group's April 2026 MDR certification for STRATOS and STRATOS DR. This regulatory readiness aligns with provider demand for standardized service delivery and calibration discipline emphasized by bodies such as the Royal Osteoporosis Society (ROS) in its August 2025 bone densitometry service guidelines.
Recent Industry Developments
- April 2026: DMS Group announced it obtained EU MDR (Regulation (EU) 2017/745) certification for its STRATOS and STRATOS DR bone densitometer product lines. The milestone supports continued access to European tenders and hospital replacement cycles at a time when MDR compliance is a gating factor for procurement. It also raises the competitive bar for suppliers still transitioning legacy portfolios to MDR requirements.
- July 2025: Isle of Wight NHS Trust installed a Hologic Horizon bone density scanner at its community diagnostic centre to support its DXA service and osteoporosis team. The site highlighted advanced capabilities such as vertebral deformity assessment and trabecular bone score (TBS) calculation, reflecting how providers are purchasing platforms with broader clinical utility than BMD alone. Standardizing on a common vendor platform also simplifies training and cross-calibration within regional DXA networks, reinforcing local installed-base advantages.
- June 2024: Hologic issued an urgent medical device correction for Horizon bone densitometry systems, coordinating corrective measures with IQVIA MedTech. The action underscores the importance of robust postmarket surveillance and field-correction capability for densitometry OEMs operating large installed bases. It also increases near-term attention to quality systems and service responsiveness as differentiators during competitive replacements and upgrade decisions.


Research Methodology Framework and Report Scope
Market Definition and Coverage
This market covers revenue generated from sales of bone densitometer systems that measure bone mineral density for screening, diagnosis, and monitoring of skeletal conditions in clinical settings.
Scope exclusions: Refurbished units, stand-alone body composition analyzers, and software-only offerings are not counted.
Segmentation Overview
- By Technology
- Axial Bone Densitometry
- Dual-Energy X-ray Absorptiometry (DEXA)
- Quantitative Computed Tomography (QCT)
- Peripheral Bone Densitometry
- Single-Energy X-ray Absorptiometry (SEXA)
- Peripheral DEXA (pDEXA)
- Radiographic Absorptiometry (RA)
- Quantitative Ultrasound (QUS)
- Peripheral QCT (pQCT)
- Axial Bone Densitometry
- By End User
- Hospitals
- Specialty & Orthopaedic Clinics
- Diagnostic Imaging Centers
- Others
- By Application
- Osteoporosis Diagnosis
- Body Composition Analysis
- Paediatric Bone Health
- Sports Medicine & Performance
- By Portability
- Fixed / In-room Systems
- Portable & Cart-based Systems
- By Component
- Hardware
- Software & Analytics
- Consumables & Accessories
- Geography
- North America
- United States
- Canada
- Mexico
- Europe
- Germany
- United Kingdom
- France
- Italy
- Spain
- Rest of Europe
- Asia Pacific
- China
- Japan
- India
- South Korea
- Australia
- Rest of Asia Pacific
- Middle East & Africa
- GCC
- South Africa
- Rest of Middle East & Africa
- South America
- Brazil
- Argentina
- Rest of South America
- North America
Data Sources, Market Sizing, and Validation
Desk Research
Desk research was used to build the starting structure of the market and to anchor it to real-world patient and procedure signals. We reviewed public health statistics and disease burden references such as CDC materials, NIH resources, and WHO aging and osteoporosis related publications to understand how screening demand forms over time. These were paired with guidelines and position statements from bodies such as the International Osteoporosis Foundation and radiology focused societies to see where densitometry is recommended and how frequently follow-up tests are typically done.
To convert demand signals into a market value view, we also relied on sources such as CMS reimbursement schedules for scan economics, national customs and trade statistics for device movement trends, and peer-reviewed imaging journals for modality usage patterns and technology adoption notes. Company annual reports, regulatory and product documentation, and reputable press were then used to confirm product availability and typical selling pathways. Select paid subscriptions supporting company financials and patent searches were used only to improve completeness of the company universe and to sanity check innovation intensity. The specific desk sources listed here are illustrative, and many other public references were also used for data collection, validation, and clarification.
Primary Interviews and Surveys
Primary work was used to pressure-test the desk assumptions and fill gaps around purchasing cycles, average selling price ranges, and the split of demand across hospitals, imaging centers, and specialty clinics. We spoke with a mix of device-side and user-side experts across major regions so the model reflects differences in reimbursement, access to imaging, and screening behavior. Afterward, the outputs were rechecked when any variable moved outside a realistic band.
Distribution of primary research fieldwork respondents
| Company type | Respondent position | Region |
|---|---|---|
| Top tier: 35% | CXOs: 14% | APAC: 43% |
| Mid tier: 48% | Functional/Unit leaders: 35% | EMEA: 33% |
| Smaller Players: 17% | Managers: 51% | Americas: 24% |
Market-Sizing & Forecasting
The sizing starts with a top-down build where the addressable testing pool is reconstructed using osteoporosis and osteopenia prevalence, the share of eligible patients who get scanned, and follow-up frequency patterns, which are then translated into annual procedure volumes. Next, these volumes are linked to equipment demand through replacement cycles, installed base utilization, and the typical share of scans done on central versus peripheral systems.
Once demand units are shaped, revenue is estimated using blended pricing assumptions that reflect modality mix (DXA, QCT, and quantitative ultrasound), typical configuration differences, and service attachment where it is sold as part of the system package. Bottom-up checks are then used to keep totals realistic, including sampled supplier revenue patterns, channel feedback on order cadence, and country-level plausibility checks against reimbursement economics. When data is thin in smaller countries, we apply proxy ratios from similar health systems and then revalidate with interview feedback.
For forecasting, we mainly use scenario analysis supported by a light multivariate regression on a few stable drivers, such as the growth in the elderly population, screening guideline adoption, reimbursement stability, and hospital and imaging center capital spending cycles. Assumptions are tightened only after we see agreement from multiple expert viewpoints, so the projected curve follows practical buying behavior rather than ideal medical need.
Data Validation & Update Cycle
Validation is done through several checks so outliers do not pass through unnoticed. We compare the model output against independent signals such as procedure economics, modality share direction, and installed base behavior, and then any large variance is traced back to the specific variable that caused it. If the gap cannot be explained cleanly, the assumption is revisited and selective respondents are re-contacted.
Before sign-off, the full workbook is reviewed in steps, including cross-tab checks by region and a consistency scan across years so sudden jumps are questioned and resolved. The report is refreshed annually, and interim updates are triggered when there are material events like reimbursement changes, major product launches, or noticeable shifts in hospital spending. Right before delivery, the analyst performs a final pass so clients receive the most current view available.
Mordor Intelligence's Bone Densitometer Systems Market Size Compared With Other Published Estimates
Published market sizes for bone densitometer systems can look inconsistent because the scope boundary is not always the same, and because price and replacement assumptions are handled differently. Timing also matters since some estimates are anchored to earlier base years and then extended forward without rechecking key demand indicators.
Key gaps usually come from what gets counted as system revenue, whether refurbished units are included, and how modality mix is treated when blending prices across DXA, QCT, and ultrasound based devices. By tracking installed base replacement cycles and price bands, Mordor Intelligence keeps the 2026 total aligned to new system sales only, which reduces inflation from refurbished shipments and software-only revenue that some publications may add.
Benchmark comparison
| Source | Market Size | Gaps in Research Methodology |
|---|---|---|
| Mordor Intelligence | USD 309.34 M (2026) | |
| Industry Publisher A | USD 265.10 M (2025) | Uses a different base year and a nearer-term value, and the scope description is less explicit on excluding refurbished units, which can compress the stated market when compared to a new-systems-only definition. |
| Healthcare Publisher B | USD 274.30 M (2026) | Relies on a product-type segmentation approach and may apply blended pricing with broader attachments, which can shift totals depending on whether service, software, or adjacent imaging components are bundled into the device value. |
The spread across the table is mainly explained by year anchoring and what is treated as system revenue versus adjacent add-ons. When the scope is kept to new densitometer systems and the pricing logic is tied back to modality mix and replacement behavior, the resulting number becomes easier to reproduce and to track over time.


Key Questions Answered in the Report
How large is the bone densitometry systems market in 2026?
The bone densitometry systems market generated USD 309.34 million in 2026 and is projected to reach USD 385.99 million by 2031.
Which technology currently dominates bone density measurement?
Dual-energy X-ray absorptiometry (DXA) leads with 63.55% share, although quantitative ultrasound is gaining ground with a 10.21% CAGR.
Why is Asia Pacific the fastest-growing region?
Rapid population aging, large untreated osteoporosis pools, and expanding insurance coverage underpin an 8.19% CAGR in Asia Pacific.
What are the main restraints limiting broader adoption?
High capital cost, radiation concerns, technologist shortages, and slow calibration-standard harmonization collectively dampen growth momentum.
Page last updated on:


