Bio-Lubricants Market Size and Share
Market Overview
| Study Period | 2021 - 2031 |
|---|---|
| Market Volume (2026) | 809.67 kilotons |
| Market Volume (2031) | 962.10 kilotons |
| Growth Rate (2026 - 2031) | 3.51% CAGR |
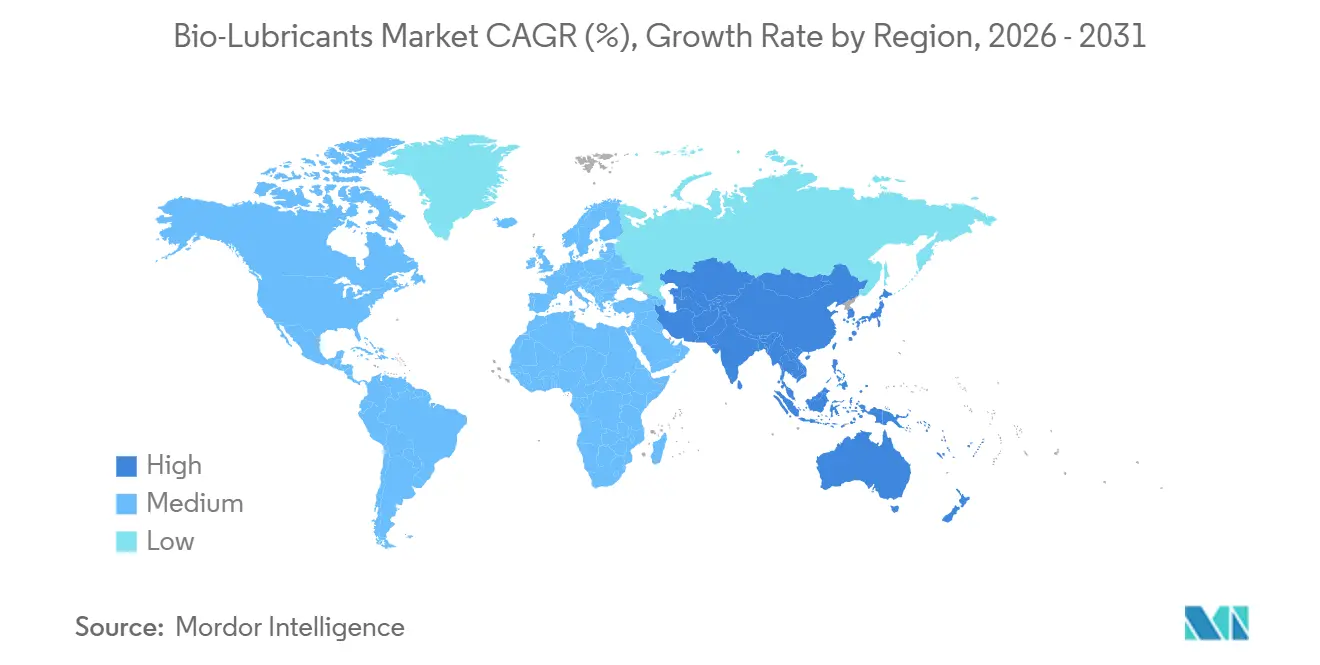
| Fastest Growing Market | Asia Pacific |
| Largest Market | North America |
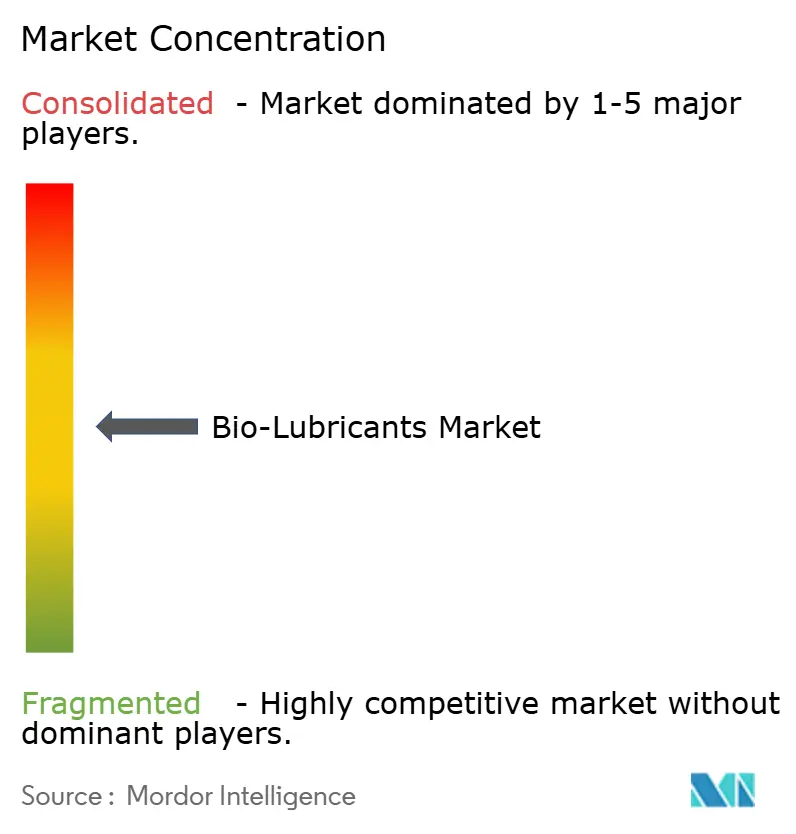
| Market Concentration | Medium |
Major Players *Disclaimer: Major Players sorted in no particular order Image © Mordor Intelligence. Reuse requires attribution under CC BY 4.0. | |
Bio-Lubricants Market Analysis by Mordor Intelligence
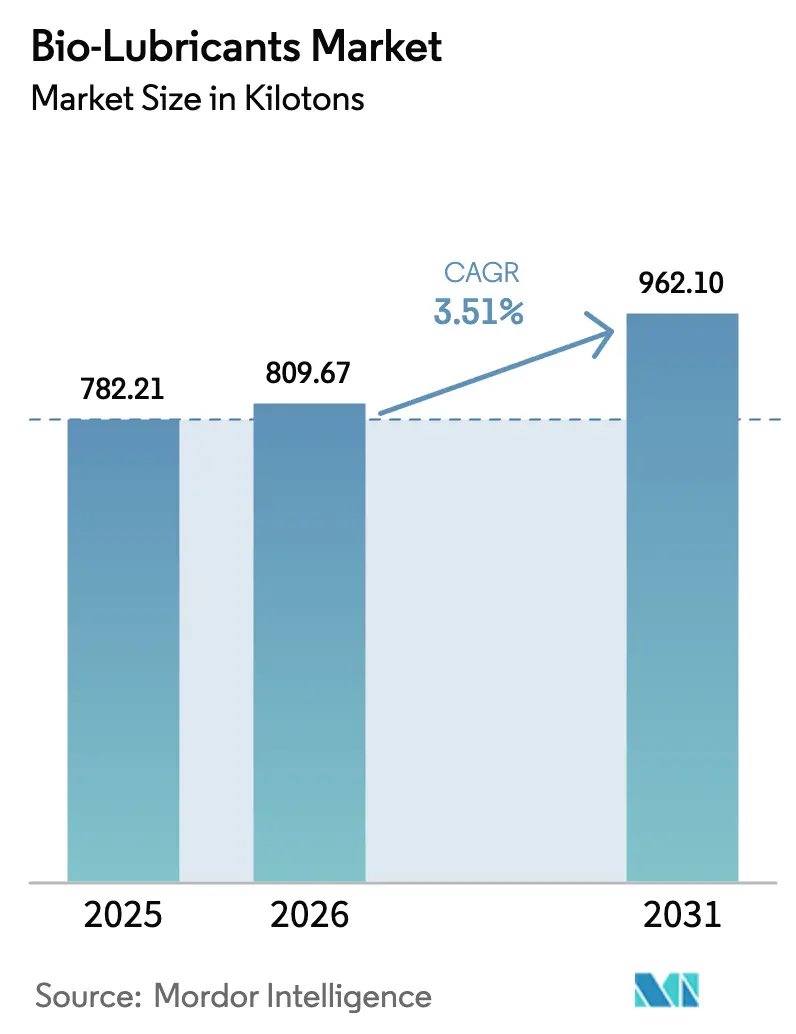
The Bio-Lubricants Market size is expected to increase from 782.21 kilotons in 2025 to 809.67 kilotons in 2026 and reach 962.10 kilotons by 2031, growing at a CAGR of 3.51% over 2026-2031. The volume outlook conceals a structural shift from commodity vegetable-oil formulations toward high-performance synthetic esters, a trend linked to tighter environmental rules, rising offshore-wind build-outs, and OEM warranty clauses that prioritize long-drain fluids. Procurement managers now weigh total-cost-of-ownership calculations more heavily than feedstock cost, especially in marine and wind-turbine gearboxes where unplanned maintenance eclipses lubricant price differentials. North America still supplies the largest share, yet Asia-Pacific delivers the fastest incremental growth as China, India, and South Korea embed biodegradable hydraulic fluids in public infrastructure projects, shipbuilding contracts, and construction-equipment tenders. Competitive intensity remains moderate because the top five suppliers together control only about two-fifths of global volume, leaving ample headroom for regional blenders and vertically integrated oleochemical producers that tailor products for food-processing lines, ultra-low-temperature mining gear, or NSF H1-certified hydraulics.
Key Report Takeaways
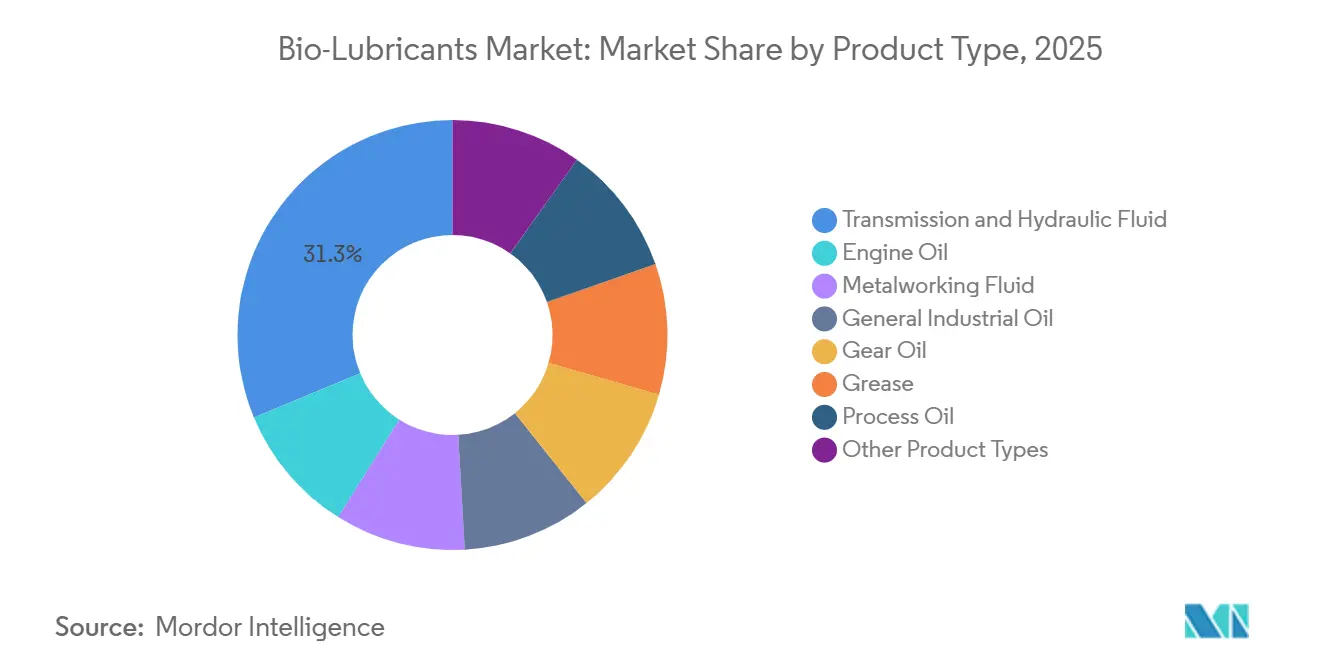
- By product type, transmission and hydraulic fluids led with 31.26% of the bio-lubricants market share in 2025 and are expanding at a 3.61% CAGR to 2031.
- By end-user industry, automotive and other transportation accounted for 36.08% of the bio-lubricants market size in 2025 and are advancing at a 3.72% CAGR through 2031.
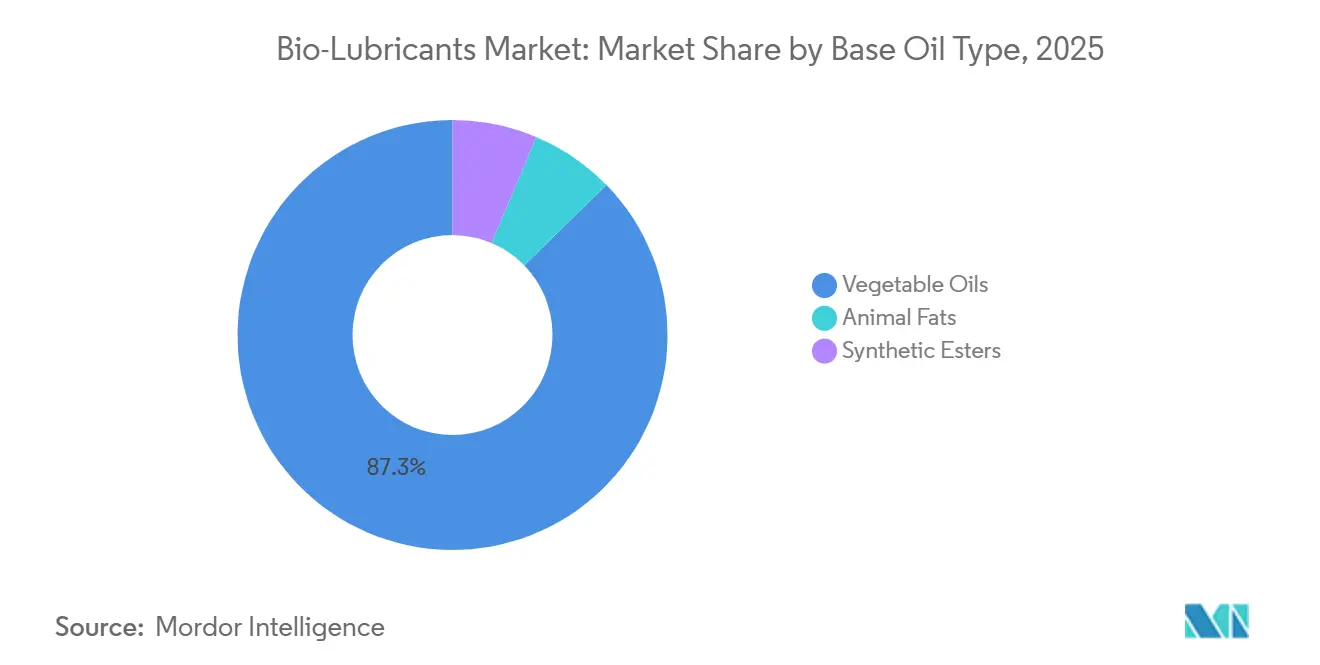
- By base-oil type, vegetable oils supplied 87.29% of the 2025 volume, while synthetic esters posted the fastest 5.97% CAGR to 2031.
- By geography, North America held 36.42% of the 2025 volume; Asia-Pacific records the highest 4.51% CAGR through 2031.
Note: Market size and forecast figures in this report are generated using Mordor Intelligence’s proprietary estimation framework, updated with the latest available data and insights as of January 2026.
Global Bio-Lubricants Market Trends and Insights
Driver Impact Analysis*
| Drivers | (~) % Impact on CAGR Forecast | Geographic Relevance | Impact Timeline |
|---|---|---|---|
| Stringent environmental rules and eco-labels | +1.2% | North America and Europe; coastal Asia-Pacific zones | Medium term (2–4 years) |
| OEM specifications for biodegradable fluids | +0.9% | Global, concentrated in Europe and North America | Short term (≤ 2 years) |
| Corporate net-zero and ESG procurement | +0.7% | Global, led by multinationals in North America and Europe | Long term (≥ 4 years) |
| Offshore-wind gearbox demand | +0.5% | Europe (North Sea, Baltic), Asia-Pacific (China, Taiwan), North America | Medium term (2–4 years) |
| Rising marine-industry demand | +0.6% | Global, strongest in EPA VGP and IMO compliance regions | Short term (≤ 2 years) |
| Source: Mordor Intelligence | |||
Stringent Environmental Regulations And Eco-Labelling Mandates
October 2024 marked a watershed when the U.S. EPA issued Vessel Incidental Discharge Act standards that compel vessels to use environmentally acceptable lubricants at all oil-to-sea interfaces. The EU Ecolabel scheme simultaneously mandates 60% ultimate biodegradability within 28 days and a minimum 25% bio-carbon content, criteria that mineral-oil products cannot meet. State regulations in California and Washington push similar rules onto forestry and construction fleets, while the USDA BioPreferred program extends federal purchasing preference to hydraulic fluids and gear oils. Together, these measures make biodegradable formulations the default choice for public-sector contracts and cascade rapidly into private supply chains. As a result, lubricant suppliers accelerate product-portfolio upgrades to retain ecolabel endorsements and avoid exclusion from large tenders.
OEM Specifications For Biodegradable Hydraulic Fluids
Bosch Rexroth’s RE 90221 guideline from 2025 requires pumps operating above 250 bar to run on HEES or HEPG fluids to keep warranty coverage [1]Bosch Rexroth, “RE 90221 Hydraulic Fluid Requirements,” boschrexroth.com. Caterpillar mirrored the move by embedding biodegradable-fluid clauses in its BF-1 and BF-2 standards used in U.S. Forest Service procurements. Japanese builders align through JCMAS HK norms that bundle ecotoxicity and biodegradability thresholds, ensuring exports meet Western compliance without dual inventories. These mandates shift choice from end users to OEMs, removing ambiguity and accelerating adoption. Field validation with Vickers 35VQ25 and Denison HF-0 protocols confirms ester-based fluids retain film strength over 2,000-hour cycles, bolstering buyer confidence.
Corporate Net-Zero And ESG-Linked Procurement Targets
Scope 3 accounting pushes multinationals to cut embedded emissions, and switching hydraulic fluids offers a measurable 30–50% life-cycle CO₂ reduction that sustainability officers can document[2]European Commission, “Corporate Sustainability Reporting Directive,” europa.eu. The EU Corporate Sustainability Reporting Directive, active since 2024, demands granular supply-chain disclosures, prompting procurement teams to request third-party life-cycle assessments with every lubricant bid. Banks now embed ESG covenants in revolvers that lower interest rates when clients hit emissions targets, further incentivizing the switch. Suppliers with ISO 14040-compliant LCA databases, therefore, win larger master-supply agreements, while smaller blenders without audit-ready data risk disqualification from multinational tenders.
Offshore-Wind Gearbox Demand For Long-Life Bio-Greases
IEC 61400-4:2025 introduces explicit gearbox-lubrication reliability metrics that cite biodegradable options as preferred materials. Vestas and Siemens Gamesa issued joint 2025 guidance recommending polyalphaolefin-ester blends for offshore turbines, citing lower water washout and oxidation compared with rapeseed oils. With annual Chinese offshore additions above 5 GW since 2024 and a 30 GW U.S. pipeline awaiting permits, extended-life bio-grease demand rises sharply. Operators accept USD 5,000–10,000 lubricant premiums because an unscheduled gearbox repair can exceed USD 1 million per turbine, making lubricant performance a clear economic lever.
Restraint Impact Analysis*
| Restraints | (~) % Impact on CAGR Forecast | Geographic Relevance | Impact Timeline |
|---|---|---|---|
| High price premium versus mineral oils | -0.8% | Global, most acute in Asia-Pacific and South America | Short term (≤ 2 years) |
| Oxidative and thermal-stability limits | -0.6% | Global, heavy-duty and high-temperature applications | Medium term (2–4 years) |
| Limited shelf life and microbial risk | -0.4% | Global, especially tropical and subtropical climates | Short term (≤ 2 years) |
| Source: Mordor Intelligence | |||
High Price Premium Versus Mineral Lubricants
Bio-lubricants still command 25–45% premiums, driven by feedstock volatility and the specialized reactors needed for esterification. While new European and North American plants trimmed unit costs in 2025, additive treat rates for ISO 15380 HEES fluids remain 20–30% higher than mineral-oil analogs, offsetting raw-material gains. Price-sensitive users in agriculture and construction often delay adoption until regulators enforce compliance or until field trials demonstrate longer drain intervals that neutralize upfront cost concerns.
Oxidative And Thermal-Stability Limitations
Unsaturated triglycerides oxidize rapidly above 100 °C, generating varnish and shortening drain intervals to 2,000–3,000 hours. Synthetic esters improve oxidative endurance yet still lag PAO-based mineral oils at temperatures beyond 150 °C. Journal of Tribology research in 2024 showed that even hindered-phenol-fortified polyol esters plateau at 1,200-minute oxidation-induction times at 165 °C, roughly 15% below PAO baselines. This gap restricts penetration into heavy-duty diesel engines and high-speed metalworking until additive chemistry narrows the delta.
*Our forecasts treat driver/restraint impacts as directional, not additive. The impact forecasts reflect baseline growth, mix effects, and variable interactions.
Segment Analysis
By Product Type: Hydraulic Fluids Extend Lead As Greases Scale Higher-Margin Niches
Transmission and hydraulic fluids led with a 31.26% volume share in 2025 and will grow at a 3.61% CAGR for 2026-2031, fueled by HEES mandates in mobile equipment and offshore platforms. The bio-lubricants market size for these fluids benefits from EPA VIDA and EU Ecolabel rules that target oil-to-environment interfaces where leakage carries high remediation costs. General industrial oils follow at a steady clip as ISO 14001 audits push plant operators toward low-toxicity alternatives.
Greases, engine oils, and gear oils together hold significant market share, but greases outpace the group as wind-farm operators prioritize 5- to 7-year service intervals. Lithium-complex and calcium-sulfonate thickeners now deliver water resistance that vegetable-oil greases previously lacked, unlocking offshore and food-processing demand. Metalworking fluids remain a laggard segment because thermal loads in high-speed machining still exceed the stability envelope of most bio-based formulations.


By End-User Industry: Automotive Outpaces Heavy Equipment On EV Transmission Demand
Automotive and other transportation applications claimed 36.08% of the 2025 volume and are advancing with the fastest 3.72% CAGR to 2031. OEM factory-fill programs for electric-vehicle gearbox oils underpin this gain because low-viscosity synthetic-ester fluids reduce drivetrain friction and extend range. Heavy equipment remains the single largest hydraulic-fluid consumer, but growth moderates as equipment owners weigh premium prices against lax enforcement outside North America and Europe.
Food and beverage processors lift demand for NSF H1-certified greases and chain oils that naturally align with plant-based chemistry, while wind and hydro power generation continue to absorb high-performance bio-greases despite premium pricing. Metalworking and chemical-manufacturing users adopt selectively, constrained by validation cycles and heat loads that exceed current bio-fluid capabilities.
By Base Oil Type: Vegetable Oils Retain Volume Leadership While Esters Accelerate
Vegetable oils provided 87.29% of global volume in 2025, owing to ready supply chains and cost advantages, yet synthetic esters record a leading 5.97% CAGR as high-pressure hydraulics and offshore gearboxes demand longer life. Hybrid blends that marry 10–20% ester with vegetable triglycerides emerge as a mid-tier solution, balancing cost and performance and easing users into the HEES category.
The bio-lubricants market share held by synthetic esters will expand as new Asian capacity comes online and as additive suppliers optimize anti-wear and antioxidant packages for ester carriers. Animal-fat derivatives remain niche, largely in cold-climate greases where saturated chains enhance low-temperature flow but face supply and perception hurdles in mainstream industrial markets.
Geography Analysis
North America supplied 36.42% of the 2025 volume, anchored by EPA VIDA compliance and USDA BioPreferred purchasing rules that direct federal lubricant budgets toward biodegradable options. Offshore-wind build-outs along the Atlantic seaboard amplify demand for synthetic-ester gearbox oils, while Canadian forestry regulations sustain uptake in mobile hydraulics. Mexican automotive exporters adopt bio-transmission fluids to satisfy U.S. OEM requirements, leveraging NAFTA corridor logistics for rapid supply.
Europe follows closely, leveraging EU Ecolabel criteria and the Corporate Sustainability Reporting Directive to embed bio-lubricants in automotive, marine, and machinery supply chains. Germany, France, and the United Kingdom contribute the bulk of demand, with Baltic and North Sea offshore-wind farms specifying ester-based greases as standard practice. The forthcoming EU carbon-border adjustment mechanism in 2026 indirectly favors regional bio-lubricant producers by penalizing high-carbon imports, tilting procurement toward low-emission formulations.
Asia-Pacific delivers the highest 4.51% CAGR as Chinese and Indian infrastructure projects require biodegradable hydraulics on government-funded sites. Japan’s JCMAS standards drive early adoption within domestic construction fleets, while South Korean shipyards specify EALs in export vessels to align with EPA and IMO guidance. Southeast Asian markets progress more slowly, restrained by price sensitivity, yet offshore-wind capacity additions in Taiwan and Vietnam begin to echo the European experience by integrating bio-lubricants into design specifications.

Competitive Landscape
The bio-lubricants market is moderately fragmented, leaving ample space for regional blenders. Integrated oil majors exploit global distribution and unified branding to win multi-country tenders, yet niche players such as PANOLIN, Renewable Lubricants, and RSC Bio Solutions win higher-margin contracts in offshore wind, food-grade hydraulics, and ultra-low-temperature mining gear by offering customized formulas and rapid field support. Vertical integration provides a hedge against feedstock swings: Cargill, Croda, and Emery Oleochemicals synthesize esters from in-house oleochemical streams, buffering cost volatility and shortening lead times. Patent filings in 2024–2025 climbed sharply, particularly around anti-wear additives optimized for ester carriers, signaling that incumbents view technical differentiation as the primary value lever. Shell’s 2024 patent family covering extended-oxidation hydraulic esters exemplifies this pivot. Strategic partnerships intensify: Shell and Cargill’s 2024 JV marries formulation know-how with oleochemical supply security, while TotalEnergies’ EUR 120 million French plant expansion, due online in Q4 2026, underscores the shift toward European ester capacity. Acquisition pipelines focus on regional blenders with entrenched food-processing or marine customer bases, providing fast access to certified product lists and local regulatory clearances.
Bio-Lubricants Industry Leaders
Shell plc
BP p.l.c.
Exxon Mobil Corporation
TotalEnergies SE
FUCHS
- *Disclaimer: Major Players sorted in no particular order

Recent Industry Developments
- January 2025: TotalEnergies committed EUR 120 million (USD 130 million) to expand synthetic-ester capacity at Oudalle, France, targeting a 50% output lift by Q4 2026 for marine and offshore-wind demand.
- November 2024: Shell and Cargill formed a joint venture to co-develop bio-derived lubricant additives that displace petroleum-based anti-wear agents in HEES fluids.


Research Methodology Framework and Report Scope
Market Definitions and Key Coverage
Our team defines the bio-lubricants market as the yearly consumption of finished lubricating oils and greases whose base stock contains at least fifty percent renewable carbon from vegetable oils, synthetic esters made from plant fatty acids, or animal fats, and that satisfy OECD biodegradability or ISO 15380 criteria. Formulations sold in bulk or packaged form for automotive, industrial, and marine uses are included.
Scope Exclusions: Fluids blended mainly with rerefined mineral oil, water-based machining coolants, and fuel additives lie outside this study.
Segmentation Overview
- By Product Type
- Engine Oil
- Transmission and Hydraulic Fluid
- Metalworking Fluid
- General Industrial Oil
- Gear Oil
- Grease
- Process Oil
- Other Product Types
- By End-user Industry
- Power Generation
- Automotive and Other Transportation
- Heavy Equipment
- Food and Beverage
- Metallurgy and Metalworking
- Chemical Manufacturing
- Other End-user Industries
- By Base Oil Type
- Vegetable Oils
- Animal Fats
- Synthetic Esters
- By Geography
- Asia-Pacific
- China
- India
- Japan
- South Korea
- Rest of Asia-Pacific
- North America
- United States
- Canada
- Mexico
- Europe
- Germany
- United Kingdom
- Italy
- France
- Russia
- Rest of Europe
- South America
- Brazil
- Argentina
- Rest of South America
- Middle East and Africa
- Saudi Arabia
- South Africa
- Rest of Middle East and Africa
- Asia-Pacific
Detailed Research Methodology and Data Validation
Primary Research
Mordor analysts interviewed lubricant formulators, OEM oil-approval managers, fleet maintenance supervisors, and regional distributors across North America, Europe, and Asia Pacific. These conversations validated service-interval assumptions, clarified typical price premiums over mineral oils, and highlighted regulatory triggers that accelerate switching, especially in forestry and inland-waterway equipment.
Desk Research
We began by mapping the demand pool with open datasets such as United States EPA Vessel General Permit filings, EU ECHA REACH substance tonnages, UN Comtrade HS-3403 trade flows, USDA soy and rapeseed oil balances, and statistics from trade bodies like the Union of the European Lubricants Industry. Corporate 10-K filings, patent families accessed through Questel, and news archives on Dow Jones Factiva helped fill supplier and pricing gaps. Market fingerprints from these public and paid sources provided first estimates of product mix, regional adoption, and average selling prices.
D&B Hoovers and Marklines then delivered company-level volumes that anchor segment splits, while periodic reviews of peer-reviewed journals clarified performance limits that still restrain wider uptake in heavy-duty engines.
The sources named are illustrative; many additional public registers, port data sets, and technical papers informed cross-checks through the project.
Market-Sizing & Forecasting
A top-down reconstruction begins with vegetable and animal oil production, adjusted for industrial diversion rates and trade, to calculate the renewable base oil pool. Penetration-rate based demand pools for hydraulic systems, automotive driveline oils, and marine EALs are then applied. Supplier roll-ups of sampled volume multiplied by average selling price provide a selective bottom-up lens that tunes totals and flags outliers. Key variables inside the model include crude vegetable oil prices, OEM biodegradability mandates, new off-highway equipment shipments, regional ESG procurement budgets, and differential excise incentives. We forecast these drivers through multivariate regression, benchmarked against consensus from primary experts, before applying scenario adjustments for feedstock volatility.
Data Validation & Update Cycle
Outputs pass three layers of variance and anomaly checks, followed by peer review. Reports refresh every twelve months, and interim updates trigger when feedstock prices swing more than fifteen percent or when new eco-label legislation is enacted. A final analyst pass ensures clients receive the latest view.
Why Our Bio-Lubricants Baseline Commands Reliability
Published figures often differ because firms pick varying scopes, units, and refresh cadences.
Some count only revenue, others focus on tonnage, and many fold in semi-synthetic blends.
Benchmark comparison
| Market Size | Anonymized source | Primary gap driver |
|---|---|---|
| 782.6 kilotons (2025) | Mordor Intelligence | - |
| USD 3.19 billion (2025) | Global Consultancy A | Revenue-only model, includes semi-synthetic blends and bio-based process oils |
| USD 2.40 billion (2025) | Industry Publication B | Excludes Asia-Pacific SME volumes and marine greases |
| USD 3.44 billion (2024) | Regional Consultancy C | Uses constant 2019 price deck, no feedstock supply elasticity adjustment |
These comparisons show that when scope, price logic, and update frequency diverge, so do numbers.
By grounding estimates in traceable volumes, regularly refreshed drivers, and balanced price ladders, Mordor Intelligence gives decision-makers a dependable, transparent baseline they can replicate and challenge with confidence.


Key Questions Answered in the Report
How large will global demand for bio-lubricants be by 2031?
It is projected to reach 962.10 kilotons, up from 809.67 kilotons in 2026.
Which product category is growing fastest?
Transmission and hydraulic fluids expand at a 3.61% CAGR through 2031 on the back of HEES mandates.
What region shows the highest growth momentum?
Asia-Pacific posts the fastest 4.51% CAGR through 2031 due to infrastructure spending and construction-equipment standards.
Why are synthetic esters gaining share?
They deliver superior oxidative stability and longer drain intervals that justify their higher cost in wind, marine, and high-pressure hydraulics.
What keeps some users from switching?
Price premiums of 25–45%, shorter shelf life, and oxidative-stability limits in high-temperature applications restrain broader adoption.
Page last updated on:


