Market Overview
| Study Period | 2021 - 2031 |
|---|---|
| Forecast Data Period | 2026 - 2031 |
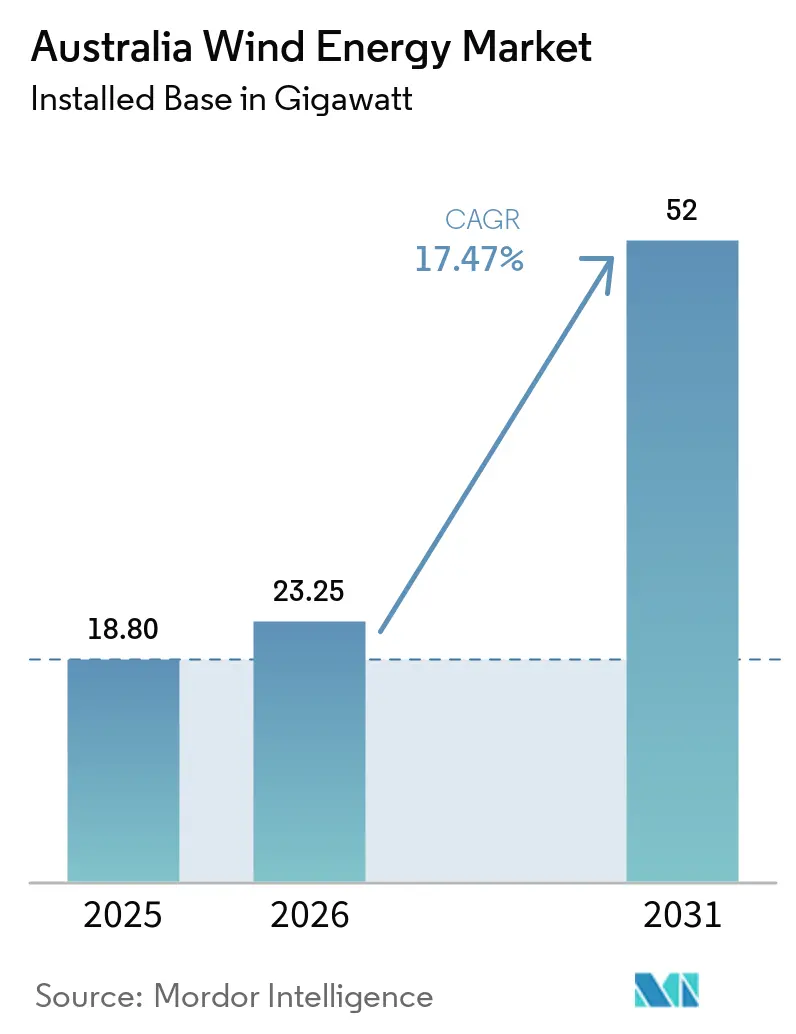
| Base Year Market Size (2025) | 18.80 gigawatt |
| Market Volume (2026) | 23.25 gigawatt |
| Market Volume (2031) | 52 gigawatt |
| Growth Rate (2026 - 2031) | 17.47% CAGR |
| Market Concentration | Medium |
Major Players *Disclaimer: Major Players sorted in no particular order Image © Mordor Intelligence. Reuse requires attribution under CC BY 4.0. | |
Australia Wind Energy Market Analysis by Mordor Intelligence
The Australia Wind Energy Market size in terms of installed base is projected to expand from 18.80 gigawatt in 2025 and 23.25 gigawatt in 2026 to 52 gigawatt by 2031, registering a CAGR of 17.47% between 2026 to 2031.
Capacity expansion is accelerating as utilities replace aging coal assets, corporates lock in 24/7 renewable power purchase agreements, and hydrogen developers co-locate electrolyzers with high-capacity-factor wind sites.[1]Clean Energy Regulator, “Large-Scale Renewable Energy Target,” cleanenergyregulator.gov.au Onshore projects still dominate, but the first offshore exploration permits issued for Gippsland and Bass Strait mark a pivotal shift toward deep-water deployment over the next decade. Turbine platforms above 6 MW are now the OEM standard, lifting capacity factors and trimming levelized cost of energy across most resource regimes. Transmission build-out in Renewable Energy Zones and timely First Nations engagement remain the gating factors that separate shovel-ready projects from revenue-generating assets.[2]Australian Energy Market Operator, “2024 Integrated System Plan,” aemo.com.au
Key Report Takeaways
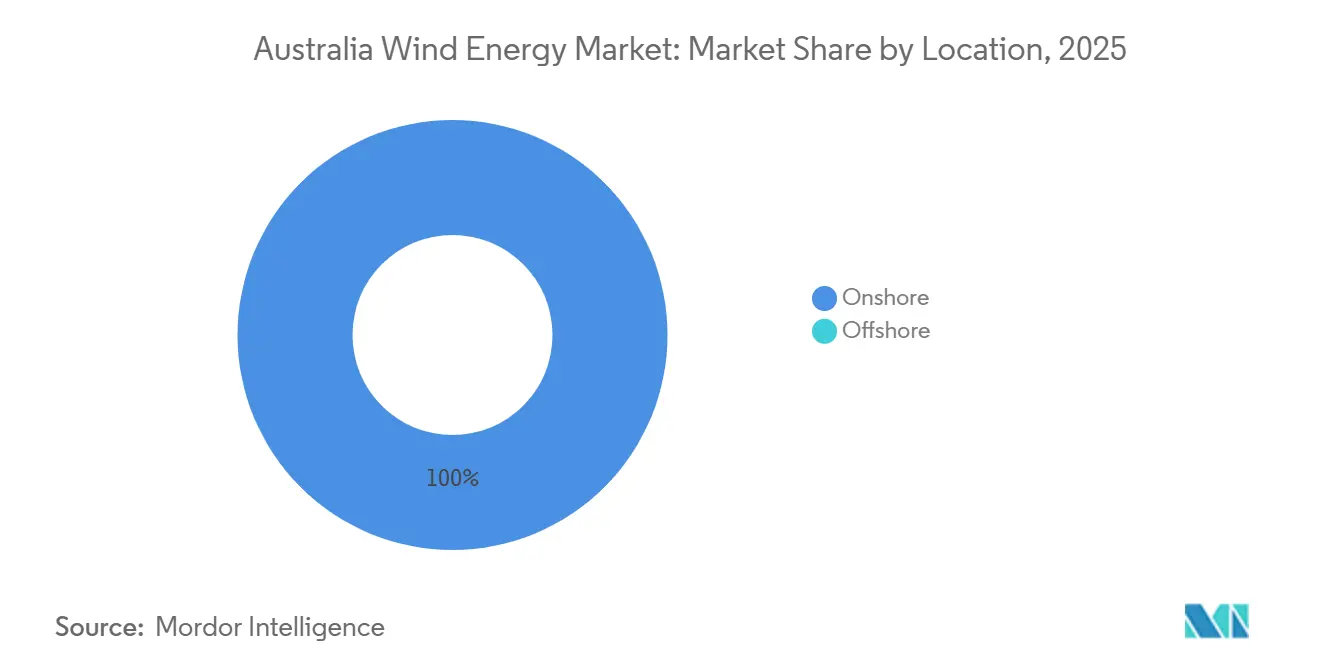
- By location, onshore wind held 100% of Australia's wind energy market share in 2025, while offshore is expected to advance at a 27.8% CAGR through 2031 as licensing and port upgrades mature.
- By turbine capacity, platforms above 6 MW captured 30% of the Australian wind energy market size in 2026 and are projected to expand at 30.2% CAGR between 2026 and 2031, outpacing the 3-6 MW segment.
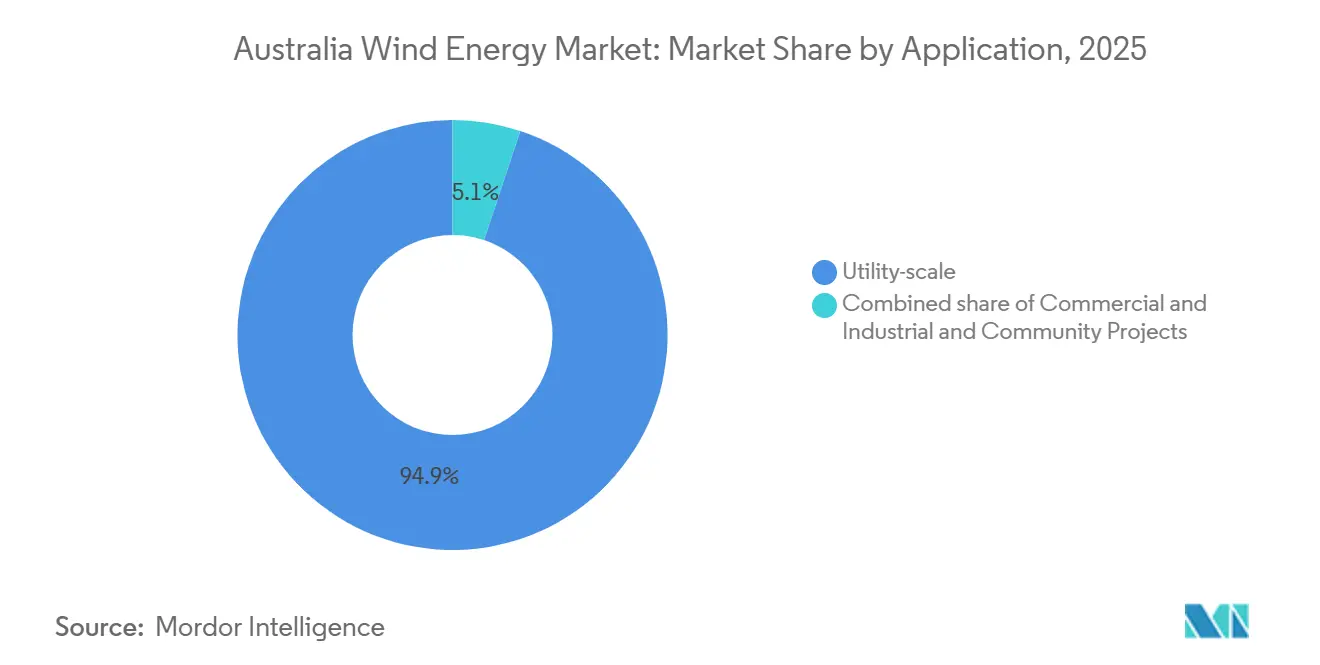
- By application, the utility-scale captured 94.9% of Australia's wind energy market size in 2025, and the commercial and industrial segment is expected to grow at an 18.3% CAGR through 2031 on the back of behind-the-meter installations.
Note: Market size and forecast figures in this report are generated using Mordor Intelligence’s proprietary estimation framework, updated with the latest available data and insights as of 2026.
Australia Wind Energy Market Trends and Insights
Drivers Impact Analysis*
| Driver | (~) % Impact on CAGR Forecast | Geographic Relevance | Impact Timeline |
|---|---|---|---|
| Utility decarbonisation mandates | +3.7% | National, with concentration in NSW, Victoria, Queensland | Medium term (2-4 years) |
| Corporate 24/7 renewable-PPAs surge | +3.3% | National, strongest in mining regions (Queensland, Western Australia, South Australia) | Short term (≤ 2 years) |
| Grid-connected hydrogen project pipeline | +2.4% | Hunter Valley (NSW), Pilbara (WA), Bell Bay (Tasmania) | Long term (≥ 4 years) |
| Repowering of 1990s onshore fleet | +2.1% | South Australia, Victoria, early NSW installations | Medium term (2-4 years) |
| Large-scale Renewable Energy Target (LRET) | +3.0% | National | Short term (≤ 2 years) |
| Source: Mordor Intelligence | |||
Utility Decarbonisation Mandates
State-scheduled coal closures are compressing reserve margins, prompting utilities to procure 1-2 GW of new wind each year to stay within reliability standards.[3]NSW Government, “Eraring Power Station Closure Timeline,” nsw.gov.au AGL Energy’s commitment to 100% renewables by 2036 illustrates how policy has morphed from compliance to strategic capacity booking. AEMO’s Integrated System Plan indicates 9 GW of firm capacity retirements by 2033, and wind paired with storage is the simplest replacement pathway.[4]Australian Energy Market Operator, “2024 Integrated System Plan,” aemo.com.au LGC shortfall penalties that hit USD 69.5 in 2024 have sharpened board-level focus on locking in long-tenor PPAs. As a result, the Australian wind energy market is moving toward multi-gigawatt annual build rates that dwarf historical Renewable Energy Target installations.
Corporate 24/7 Renewable PPAs Surge
Global miners, telecom carriers, and cloud operators now demand hourly matched renewable supply, shifting preference from intermittent LGC purchases to firmed wind-solar-storage contracts. BHP’s deal for the 157 MW Kaban hub and NBN Co’s Macarthur arrangement show early adopters monetizing hedges against wholesale volatility. Robust evening and morning wind output makes the technology essential for a balanced 24/7 portfolio. Hourly certificates also improve auditability under Science Based Targets, further cementing wind’s role in corporate decarbonization. Together, these agreements anchor bankable offtake structures that lower project-finance risk across the Australian wind energy market.
Grid-Connected Hydrogen Project Pipeline
The government's ambition to rank among the top three hydrogen exporters by 2030 is translating into large co-located wind-electrolyzer complexes in South Australia and Western Australia. Projects such as Murchison's 5 GW platform plan to convert curtailed wind into green ammonia for Asian buyers. ARENA's USD 50 million grant program accelerates front-end engineering studies that derisk hybrids. Because electrolyzers can soak up excess generation, developers can build bigger wind plants without waiting for transmission expansion. That upside magnifies the long-term growth runway for the Australian wind energy market.
Repowering of 1990s Onshore Fleet
Early wind farms with sub-1 MW turbines are nearing design life, creating a repowering window that can triple nameplate capacity on existing grid footprints. Modern 7 MW units deliver taller hub heights and larger rotors, boosting site capacity factors above 45%. Because environmental approvals and land leases already exist, repowering offers faster execution than greenfield builds. Ambiguity around fresh LGC eligibility remains a speed bump, yet Victoria’s REZ framework now prioritizes repower bids for unused connection capacity. The segment promises 500-800 MW of incremental upside by 2028, reinforcing domestic turbine demand.
Restraints Impact Analysis*
| Restraint | (~) % Impact on CAGR Forecast | Geographic Relevance | Impact Timeline |
|---|---|---|---|
| Transmission bottlenecks in REZs | -2.7% | Central-West Orana (NSW), New England (NSW), North Queensland | Short term (≤ 2 years) |
| Local supply-chain inflation (steel, cranes) | -1.9% | National, acute at port cities (Newcastle, Melbourne, Fremantle) | Medium term (2-4 years) |
| First Nations land-access litigation risk | -1.6% | Northern Territory, Queensland, Western Australia | Medium term (2-4 years) |
| Slow offshore planning approvals (NOPSEMA) | -1.8% | Gippsland (Victoria), Hunter (NSW), Illawarra (NSW) | Long term (≥ 4 years) |
| Source: Mordor Intelligence | |||
Transmission Bottlenecks in REZs
Connection queues exceed 15 GW across Central-West Orana and Western Victoria, pushing average wait times to 18 months as network upgrades slip behind construction schedules. Developers pay USD 1.42-2.13 million each month to warehouse turbines until energization, eroding project IRRs. Although AEMO’s 2024 plan earmarks AUD 8.5 billion for new lines, regulatory sign-off under the AER stretches 24-36 months. Delays weigh most heavily on independently financed projects that lack state underwriting, tempering near-term additions to the Australian wind energy market.
Local Supply-Chain Inflation (Steel, Cranes)
Between 2023 and 2025, imported steel and heavy-lift crane costs climbed 28% as the country sources 85% of turbine components overseas. Vestas reports that balance-of-system costs in Australia now run 15-20% higher than in Europe, driven by scarce 1,600-tonne cranes and long mobilization times. Local-content mandates that require 50% domestic expenditure in Victoria and Queensland add further premiums. OEM restructuring abroad, evidenced by Siemens Gamesa’s Denmark plant closure, has extended blade lead times by up to 12 months. These factors narrow developer margins and slow final investment decisions, trimming growth for the Australian wind energy market.
*Our forecasts treat driver/restraint impacts as directional, not additive. The impact forecasts reflect baseline growth, mix effects, and variable interactions.
Segment Analysis
By Location: Onshore Strength, Offshore Inflection
Onshore capacity totaled 18.80 GW in 2025 and is projected to climb at 17.5% CAGR through 2031, cementing its role as the anchor of the Australia wind energy market size. Central-West Orana in New South Wales and Western Victoria REZs continue to host the lion’s share of greenfield builds. Repowering initiatives in South Australia also add cost-effective megawatts without fresh grid studies. Developers value accelerated approvals and proven logistics in these mature corridors, keeping onshore pipelines oversubscribed.
Regulators approved the first offshore exploration permits in 2024, unlocking 2.2 GW under the Star of the South project for commissioning in 2028. Bass Strait wind speeds averaging 10 m/s offer North-Sea-like yields, and a dedicated USD 355 million government port-upgrade fund shortens supply-chain ramp-up. Should permitting stay on schedule, offshore installations could capture 10-15% of incremental capacity by 2030, providing the diversity grid operators need for firming initiatives and lifting the profile of the Australian wind energy market.


By Turbine Capacity: Rise of the 7 MW-Class
The 3-6 MW class commanded 64.8% share of the Australian wind energy market size in 2025, thanks to legacy V136-4.2 MW and SG 5.0-145 fleets. Yet platforms above 6 MW are set to expand at 30.2% CAGR through 2031, lifting average capacity factors and cut-through economics. V162-7.2 MW machines installed at Rye Park deliver 15% more annual energy production than 4 MW predecessors on the same terrain, proving scalability even at inland sites. GE Vernova's two-piece blade design eases transport on tight regional roads, making high-output turbines feasible in remote mining corridors.
Units under 3 MW are fading as developers phase out early-2000s assets. Replacement orders now revolve around 6-8 MW products that share components with future offshore lines, enabling OEMs to amortize R&D across multiple markets. The trend raises Australia's wind energy market share for the >6 MW segment while marginalizing smaller classes.
By Application: Utility-Scale Core, C&I Uptick
Utility-scale projects held 94.9% of installed capacity in 2025, driven by long-tenor PPAs with state-owned retailers such as CleanCo Queensland and Snowy Hydro. These off-balance-sheet agreements underpin multi-hundred-megawatt builds like the 1,026 MW MacIntyre complex, preserving bankability amid merchant-price swings.
Commercial and industrial buyers are adding wind behind the meter at an 18.3% CAGR, shaving network charges and hedging carbon liabilities. Mining groups alone consume 15% of national electricity and increasingly see embedded wind as the lowest-cost abatement pathway. Community schemes, while small, benefit from state grants that encourage cooperative ownership and local benefit sharing. Collectively, these niches diversify revenue streams within the Australian wind energy market.
Geography Analysis
South Australia, New South Wales, and Victoria accounted for 78% of wind installed capacity in 2025, but resource saturation and network constraints are shifting investment toward Queensland and Western Australia. Central-West Orana’s 3 GW queue illustrates pent-up demand pending HumeLink energization, while Western Victoria leverages existing 500 kV corridors to connect the 756 MW Golden Plains farm with minimal delay.
Queensland’s pipeline swelled to 4.5 GW after MacIntyre and Kaban reached financial close, aligning with the state’s 80% renewable target by 2035. Western Australia’s Mid West corridor boasts 45% capacity factors and proximity to Perth, attracting investors eyeing both grid and hydrogen export synergies. Tasmania’s 1.2 GW Robbins Island cluster will feed Victoria via the bi-pole Marinus Link, broadening geographic diversity once operational in 2028.
The Gippsland and Bass Strait offshore zones alter the traditional inland distribution, providing 2-3 GW within 50 km of load centers and sidestepping overland bottlenecks. Government port funding and fast-track approvals suggest these sites will redefine regional project pipelines and amplify growth in the Australian wind energy market.
Competitive Landscape
Five developers, Neoen, Acciona, Tilt Renewables, CWP Renewables, and Infigen Energy, controlled roughly 55% of operating megawatts in 2025, yet none topped 15%, signaling moderate concentration with room for challengers. Differentiation rests on securing robust PPAs, demonstrating First Nations consultation fluency, and tailoring turbine choice to micro-climate variance. Neoen’s 24/7 PPA with BHP shows how corporate contracts displace LGC-only revenues and free developers from spot-price volatility.
OEM rivalry has intensified as Vestas and GE Vernova localize assembly to satisfy content rules and cut freight costs, while Siemens Gamesa’s restructuring ceded ground to Goldwind and Nordex in the >6 MW bracket. Hybrid wind-solar-storage models like Goyder South proved able to shave 15% off LCOE by optimizing dispatch, pointing to future battlegrounds where project design sophistication underpins returns.
Offshore zones present high barriers that favor European majors Ørsted and Copenhagen Infrastructure Partners, both armed with floating-foundation know-how and deep capital pools. Developers that master Australia’s evolving regulatory overlay and supply-chain localization will dominate the next growth wave in the Australian wind energy market.
Australia Wind Energy Industry Leaders
Tilt Renewables
Vestas Wind Systems A/S
Neoen SA
Goldwind Australia
Iberdrola Australia (Infigen)
- *Disclaimer: Major Players sorted in no particular order

Recent Industry Developments
- May 2026: The Victorian Government has approved WestWind Energy's USD 3.56 billion Warracknabeal Energy Park. Expected to become the largest wind farm in the Southern Hemisphere, the project will include up to 219 turbines, two large-scale batteries, and will generate sufficient electricity to power approximately 1.2 million homes.
- November 2025: FairWind finalized the acquisition of Australia’s Cosmic Group, adding 100 technicians to its workforce. This acquisition strengthens FairWind’s wind installation and maintenance capabilities in the Asia-Pacific region, with Australia, New Zealand, and Japan serving as a regional hub for its global operations.
- October 2025: Neoen inaugurated the 412 MW Goyder South Wind Farm, making it the largest wind farm in South Australia. This development increased wind generation capacity by over 20%, contributing to the goal of achieving 100% net renewables by 2027. The project includes long-term power purchase agreements (PPAs) delivering approximately 1.5 TWh annually.
- July 2025: MMA Offshore officially rebranded as Cyan Renewables after completing an USD 0.78 billion acquisition. The company opened a Melbourne office to support Australia’s offshore wind sector, further solidifying its offshore wind services presence in the Asia-Pacific region.


Australia Wind Energy Market Report Scope
The Australian wind energy market report includes:
By Location
| Onshore |
| Offshore |
By Turbine Capacity
| Up to 3 MW |
| 3 to 6 MW |
| Above 6 MW |
By Application
| Utility-scale |
| Commercial and Industrial |
| Community Projects |
By Component (Qualitative Analysis)
| Nacelle/Turbine |
| Blade |
| Tower |
| Generator and Gearbox |
| Balance-of-System |
| By Location | Onshore |
| Offshore | |
| By Turbine Capacity | Up to 3 MW |
| 3 to 6 MW | |
| Above 6 MW | |
| By Application | Utility-scale |
| Commercial and Industrial | |
| Community Projects | |
| By Component (Qualitative Analysis) | Nacelle/Turbine |
| Blade | |
| Tower | |
| Generator and Gearbox | |
| Balance-of-System |


Key Questions Answered in the Report
How quickly is wind capacity expanding in Australia?
Installed capacity is rising from 23.25 GW in 2026 to hit 52 GW by 2031, expanding at a 17.47% CAGR.
Which turbine class is gaining the most traction?
Platforms above 6 MW are the fastest-growing, projected to expand at 30.2% CAGR through 2031 as developers favor higher capacity factors.
What role will offshore wind play this decade?
Gippsland and Bass Strait zones could capture 10-15% of new capacity by 2030 once permitting and port upgrades are completed.
Why are corporate buyers important for new projects?
24/7 renewable PPAs from miners, telecoms, and data centers provide bankable revenues that substitute for declining LGC incentives.
What is the biggest near-term bottleneck?
Transmission congestion in Renewable Energy Zones is delaying energization by up to 18 months and eroding developer margins.
How concentrated is the developer landscape?
The top five companies control roughly 55% of operating megawatts, allowing new entrants to secure projects while indicating moderate consolidation.
Page last updated on:


