
Australia Educational Tourism Market Size and Share
Market Overview
| Study Period | 2021 - 2031 |
|---|---|
| Forecast Data Period | 2026 - 2031 |
| Base Year Market Size (2025) | USD 22.18 Billion |
| Market Size (2026) | USD 22.55 Billion |
| Market Size (2031) | USD 31.93 Billion |
| Growth Rate (2026 - 2031) | 7.21 % |
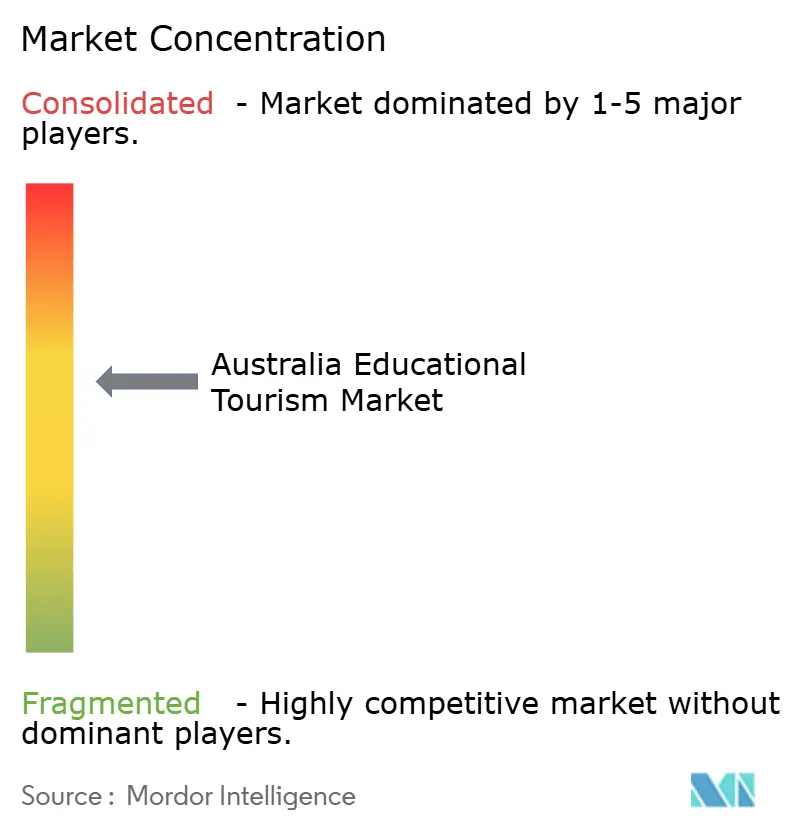
| Market Concentration | Medium |
Major Players *Disclaimer: Major Players sorted in no particular order Image © Mordor Intelligence. Reuse requires attribution under CC BY 4.0. | |
Australia Educational Tourism Market Analysis by Mordor Intelligence
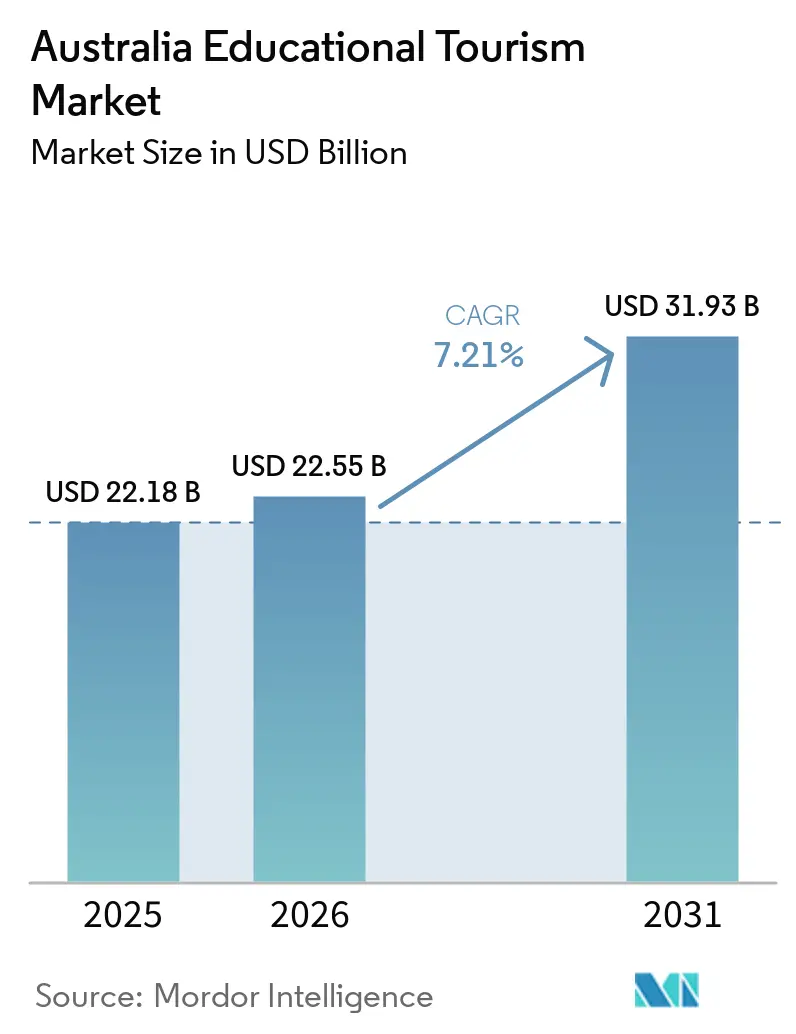
The Australia educational tourism market is expected to grow from USD 22.18 billion in 2025 to USD 22.55 billion in 2026 and is forecast to reach USD 31.93 billion by 2031 at a 7.21% CAGR over 2026–2031. In 2025, the international education sector contributed AUD 55 billion (USD 36.86 billion) in education-related travel exports, maintaining its position as a key export earner. International student enrolments exceeded 850,000 in 2025, driven by degree travel, work-study mobility, and domestic academic travel. India and China accounted for 40% of international students in 2026, influencing recruitment strategies, product offerings, and capacity planning. Record Working Holiday Visa issuance in FY2024-25 expanded the market beyond degree students to include short-course and blended travel demand. However, tighter visa regulations and housing shortages are creating challenges. Growth increasingly favors providers with strong compliance, credible brands, and accommodation partnerships[1].
Key Report Takeaways
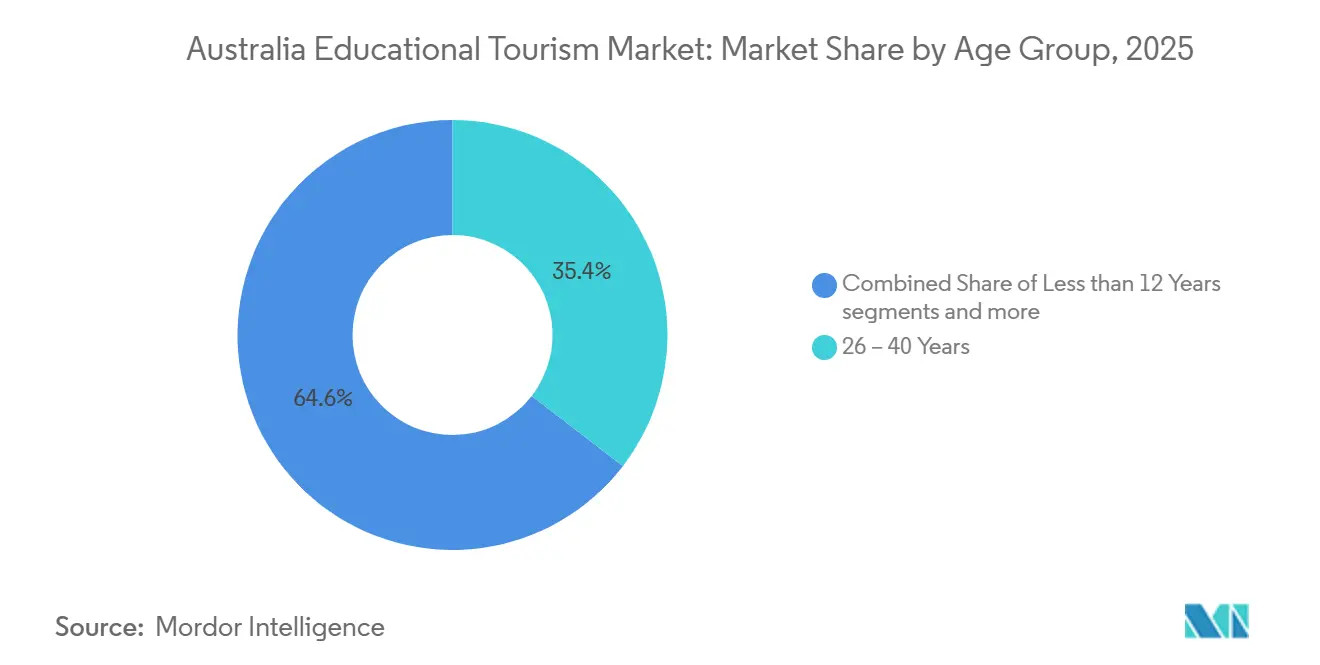
- By age group, the 26 - 40 years segment held 35.44% of the Australia educational tourism market share in 2025, while the 13 - 25 years segment is projected to grow at an 8.46% CAGR through 2031.
- By education type, post-graduation accounted for 36.13% of the Australia educational tourism market share in 2025 and is also forecast to record the fastest growth at an 8.15% CAGR through 2031.
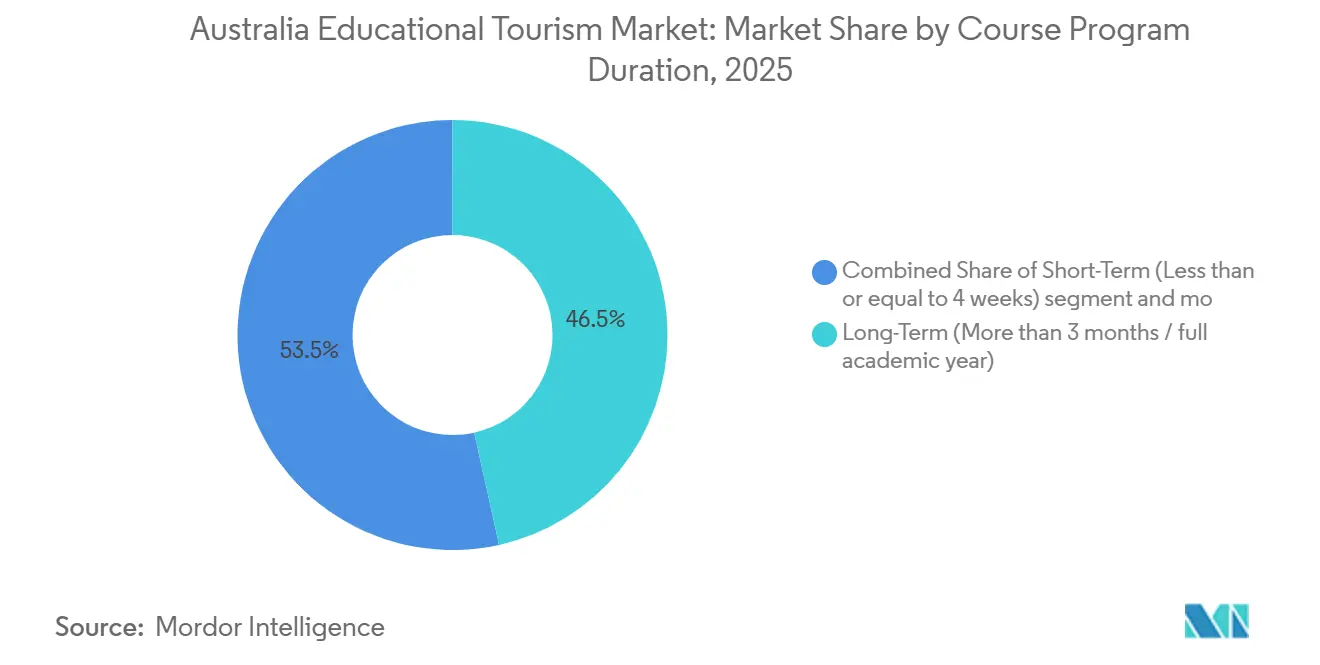
- By course and program duration, long-term programs represented 46.53% of the Australia educational tourism market value in 2025, while medium-term programs are expected to expand at a 7.81% CAGR through 2031.
- By booking channel, education agents and counselors represented 45.81% of the Australia educational tourism market share in 2025, while online and digital platforms are forecast to grow fastest at an 8.91% CAGR through 2031.
- By tourism type, international tourism accounted for 75.43% of the Australia educational tourism market size in 2025, while domestic tourism is projected to advance at a 7.94% CAGR through 2031.
Note: Market size and forecast figures in this report are generated using Mordor Intelligence’s proprietary estimation framework, updated with the latest available data and insights as of January 2026.
Australia Educational Tourism Market Trends and Insights
Drivers Impact Analysis*
| Drivers | (~) % Impact on CAGR Forecast | Geographic Relevance | Impact Timeline |
|---|---|---|---|
| Australia’s strong education export sector supports sustained educational tourism growth | +1.8% | Concentration on New South Wales and Victoria | Long term (≥ 4 years) |
| Rising demand from China and India is accelerating inbound student mobility | +1.4% | East Asia and South Asia | Medium term (2-4 years) |
| Blended work-study-travel demand grows, bolstered by Working Holiday Visa programs | +0.8% | Especially United Kingdom, France, Ireland, Indonesia, and China | Medium term (2-4 years) |
| National education strategies ensure regulatory stability and oversee sector expansion | +0.5% | National, with early gains in regional universities and TAFEs | Long term (≥ 4 years) |
| Being geographically close to Asia reduces travel costs and enhances accessibility | +0.5% | Asia-Pacific core, with spillover to South Asia and Southeast Asia | Short term (≤ 2 years) |
| Australia's distinct STEM and environmental programs set it apart as a unique destination | +0.6% | Especially India, Southeast Asia, and China | Long term (≥ 4 years) |
| Source: Mordor Intelligence | |||
Australia’s strong education export sector supports sustained educational tourism growth
Australia is a global hub for international students, with education-related travel exports expected to grow significantly by 2025[2]. This reflects a strong export model where tuition fees, local spending, and research contributions combine into a unified economic asset. The sector also supports substantial employment across the country, reinforcing its importance beyond the broader education economy. A notable aspect is that a significant share of export revenue in FY2024–25 was generated by international students participating in Australia’s labor market. Their contribution strengthens the sector’s sustainability, improves retention rates, and extends economic benefits beyond academic programs.
Rising demand from China and India is accelerating inbound student mobility
China remained the largest source of international students in Australia, followed by India, with both countries accounting for a significant share of the enrolment base. In a notable shift, India surpassed China in monthly student visa approvals, reflecting changing mobility trends. Education export income from these countries underscored their critical role in Australia's educational tourism market. A decline in higher education applications from China has shifted focus toward India and Southeast Asia for future enrolments. This change is prompting providers to emphasize stronger conversions, compliance quality, and program alignment with migration-linked demand from India.
Blended work-study-travel demand grows, bolstered by Working Holiday Visa programs
Australia has significantly expanded its educational tourism market by issuing a record number of Working Holiday Visas in FY2024-25. Policy changes implemented since 2021, such as increased age limits for partner countries and easier access for United Kingdom nationals, have broadened the pool of travelers combining work with short educational programs. Many of these visitors enroll in short-term English courses, certificates, or skills-based programs without requiring a student visa, driving growth in shorter-duration segments. A notable 50.6% increase in Indonesian Working Holiday grants during the same period highlights untapped demand from Southeast Asia for blended education and travel offerings. Providers offering integrated packages, including English training, vocational modules, regional experiences, and accommodation, are well-positioned to cater to this expanding segment within Australia’s educational tourism market.
National education strategies ensure regulatory stability and oversee sector expansion
The Commonwealth Register of Institutions and Courses for Overseas Students ensure quality standards for international education in Australia, setting it apart from lower-cost alternatives. TEQSA and ASQA regulate higher education and vocational training providers, offering a structured compliance framework despite stricter migration rules. Public oversight, reflected in policies like Ministerial Direction No. 115, the Genuine Student framework, and the freeze on new CRICOS registrations for many VET providers until 2026, focuses on maintaining provider quality and system credibility. This regulatory environment favors established universities, public TAFEs, and larger pathway operators, as they manage compliance complexities more effectively than smaller entrants[3]. Over time, this approach strengthens brand trust and promotes controlled growth among regional institutions and public providers, avoiding unchecked expansion by weaker operators.
Restraints Impact Analysis*
| Restraints | (~) % Impact on CAGR Forecast | Geographic Relevance | Impact Timeline |
|---|---|---|---|
| Tightened immigration policies reduced international student visa approvals significantly | -1.2% | South Asia and Southeast Asia | Short term (≤ 2 years) |
| Student accommodation shortages limit enrolment expansion capacity | -0.8% | New South Wales and Victoria, extending into Queensland | Medium term (2-4 years) |
| Declining VET visa applications weakened long-stay educational tourism pipelines | -0.7% | South Asia and Southeast Asia | Short term (≤ 2 years) |
| Competing destinations offer lower costs and simpler visa processes | -0.5% | Key source markets, especially India | Medium term (2-4 years) |
| Source: Mordor Intelligence | |||
Tightened immigration policies reduced international student visa approvals significantly
Policy changes introduced since late 2023 have disrupted visa conversions and increased challenges in Australia's educational tourism market, particularly affecting South Asia and Southeast Asia. Indian student visa applications have significantly declined, with a corresponding drop in visa grants over the same period. The student visa application fee increased in July 2024 and again in July 2025, making Australia the most expensive globally and reducing demand for shorter courses. High refusal rates in certain source markets have further pressured genuine applicants, leading them to reconsider timing, affordability, and destination preferences. These measures aim to eliminate weak providers and non-genuine applications but have narrowed the pipeline for educational tourism, especially in segments reliant on efficient visa processing[4].
Student accommodation shortages limit enrolment expansion capacity
Housing remains a significant bottleneck in Australia's educational tourism market, as bed supply has not kept pace with growing enrollment. Purpose-Built Student Accommodation (PBSA) availability is limited, with New South Wales facing a tighter situation compared to the national average. Sydney has experienced sharp increases in PBSA rents, adding to living cost pressures amid stricter visa financial checks. Government policies now link enrollment flexibility to progress in student housing, making accommodation a critical capacity control factor. This issue is most pronounced in Sydney and Melbourne but is also affecting other education hubs. Providers are competing to attract students who increasingly expect clear housing pathways before traveling.
*Our forecasts treat driver/restraint impacts as directional, not additive. The impact forecasts reflect baseline growth, mix effects, and variable interactions.
Segment Analysis
By Age Group: Working-Age Demand Anchors Enrolments, Youth Cohort Accelerating
The 26 - 40 Years age group accounted for 35.44% of the Australia educational tourism market in 2025, making it the largest segment. This group is strongly linked to postgraduate mobility, reskilling, and migration planning. Demand from Indian and Chinese nationals highlights the connection between education, work rights, employability, and access to urban labor markets. Their focus on fields like management, information technology, and health sciences supports longer stays and higher spending. The Australia-India ECTA enhances this segment's appeal by offering up to 4 years of post-study work rights for PhD graduates, attracting professionals seeking quality education and future mobility. This age group remains a key driver of demand in the market.
The 13 - 25 Years segment is projected to grow at an 8.46% CAGR through 2031, making it the fastest-growing age group. Growth is supported by school-group travel, undergraduate pathways, foundation programs, and direct university entry, particularly from South Asia, Southeast Asia, and China. Pathway colleges and digital recruitment systems further facilitate access for younger applicants. The Less than 12 Years segment, though small, benefits from school exchanges and structured educational travel programs, especially in Queensland and New South Wales. The Over 40 Years segment remains niche but is gradually expanding due to executive education, professional development courses, and alumni returning for short postgraduate programs.

By Education Type: Postgraduate Programs Dominate, Pathway Segment Expands
Post-graduation accounted for 36.13% of Australia's educational tourism market size in 2025 and is projected to grow at an 8.15% CAGR through 2031. This growth highlights the demand for master’s coursework in management, engineering, information technology, and health sciences, driven by strong employment outcomes. By January 2026, Management and Commerce were the most popular higher education fields, followed by Information Technology. This trend reflects the increasing connection between postgraduate travel and skill-shortage occupations. Higher education enrollments grew by 9% in 2025, reaching 545,000, indicating that policy changes in VET and ELICOS had not hindered degree-level growth. Postgraduate studies remain central to Australia's educational tourism market.
The graduation segment held the second-largest share, supported by pathway colleges, foundation programs, and university-linked transfer models operated by organizations such as Navitas and Kaplan. Secondary education, though smaller in volume, benefits international school enrollments and organized study travel. Primary education tourism, still in its early stages, is gaining attention through school exchange programs and parent-led academic travel. Transnational academic partnerships between Indian and Australian universities are expanding the pipeline, offering blended study routes that can transition into onshore postgraduate demand. This structure strengthens the progression from foundational pathways to postgraduate travel within Australia's educational tourism market.
By Course and Program Duration: Long-Term Enrolments Lead, Medium-Term Gaining Ground
Long-term programs held a 46.53% share in 2025, highlighting their central role in Australia's educational tourism market. Degree students and vocational learners in extended programs generate stable housing demand, sustained local spending, and consistent use of transport and tourism services. This segment is particularly significant in major cities with large-scale universities, pathway colleges, and public institutions. These programs also align with the migration goals of many Indian and Chinese students, especially those pursuing postgraduate studies or professional retraining. Despite stricter policies, long-duration enrollments remain the foundation of the market.
Medium-term programs are projected to grow at a 7.81% CAGR through 2031, driven by demand for executive courses, language immersion, school tours, bootcamps, and professional upskilling modules. Increased Working Holiday Visa issuances contribute to this growth, as some participants engage in short educational programs without entering the formal student visa system. Short-term programs, while the smallest segment, are gaining traction as providers develop flexible micro-credentials and English-language offerings tailored to seasonal travel patterns. The pause on new CRICOS registrations for many VET providers may redirect demand toward non-VET short and medium programs outside the most constrained pipeline segment. This shift allows the market to diversify duration formats, even as long-stay routes continue to dominate.
By Booking Channel: Agent Intermediaries Dominate, Digital Platforms Reshaping Access
Education agents and counselors accounted for 45.81% of the market share in 2025, highlighting the Australian educational tourism sector's dependence on intermediaries. These agents assist with recruitment, visa guidance, provider matching, and accommodation coordination, particularly benefiting Indian, Chinese, and Vietnamese students who face complex application processes. Consolidation efforts, such as IDP Education’s acquisition of Intake Education in October 2025, have strengthened this model. Agent networks continue to thrive due to their trustworthiness, language skills, and local market expertise, which institutions find challenging to replicate through direct channels. Despite increasing digitization, counselor-led bookings remain essential in the market.
Online and digital platforms are expected to grow at a CAGR of 8.91% through 2031, reflecting a shift in how universities engage with international students. In 2025, Adelaide University implemented a recruitment system using the Adobe Experience Platform to prioritize international student conversion. Similarly, UNSW invested in Adobe Journey Optimizer and piloted ChatGPT Edu to enhance personalized communication and student lifecycle management. While direct enrollment and institution-to-institution pathways remain relevant, they represent a smaller share compared to agent and platform-led channels. The evolving channel mix has not diminished the importance of intermediaries, who continue to play a significant role in driving conversions within the Australian educational tourism market.
By Tourism Type: International Segment Drives Revenue, Domestic Gradually Broadening
International tourism held a 75.43% share in 2025, highlighting the reliance of the Australia educational tourism market on inbound learners for revenue. In FY2024–25, China and India contributed AUD 13.7 billion (USD 9.18 billion) and AUD 9.3 billion (USD 6.23 billion), respectively, to education export income, showcasing their significance as key inbound markets. Around one-third of this export value was generated by international students working in Australia, demonstrating their broader economic impact beyond tuition fees. The combination of study, work, and tourism drives demand across accommodation, retail, transport, and regional travel, making international mobility the primary value driver for the market.
Domestic tourism is projected to grow at a 7.94% CAGR through 2031, expanding opportunities for school excursions, cultural exchanges, and vocational travel. Demand is increasing among Australian students and regional residents seeking educational experiences in science, culture, heritage, and environmental sites. Although smaller, this segment provides a buffer for providers as visa restrictions tighten for some inbound groups. It also supports regional destinations offering field-based learning in areas such as marine studies, desert ecology, and Indigenous knowledge. As domestic tourism grows, the market becomes less reliant on international demand, though inbound travel is expected to remain dominant throughout the forecast period.
Geography Analysis
China remains the largest source of international students, contributing significantly to Australia's education export income. India follows closely, with its growing importance driven by work rights and migration opportunities. This trend is shifting program preferences toward postgraduate studies, IT, engineering, and health-related fields. While both countries dominate the market, India's role is becoming increasingly central, influencing recruitment strategies and program planning.
Southeast Asia is another key region, with Vietnam, the Philippines, Nepal, and Indonesia playing vital roles. Nepal's contribution to export income highlights its significance relative to its economy. The Philippines and Vietnam connect study demand with health, skills, and vocational mobility trends. Indonesia shows rising interest in blended travel and education, supported by increased Working Holiday grants. These markets help offset fluctuations in demand from China and strengthen the regional base of the educational tourism market.
New South Wales and Victoria generate the majority of Australia's education export income, accounting for a substantial share of revenue. Queensland and Western Australia, though smaller, are growing due to infrastructure development and proximity to Southeast Asia. Adelaide is gaining traction through its university platform, active recruitment in India, and improved connectivity. Geographic diversification is becoming more feasible, though Sydney and Melbourne remain central hubs. The CRICOS framework supports this diversification by ensuring consistent quality standards across states and providers.
Competitive Landscape
The Australia educational tourism market is moderately concentrated, with the top players holding significant market share. Navitas Ltd focuses on embedded pathway colleges, while IDP Education Ltd emphasizes testing, counseling, and placement. Kaplan International English Australia, TAFE NSW International, and Academies Australasia Group address pathway, language, and vocational demands. The market remains competitive, but operators with strong brands, compliance capabilities, and recruitment networks hold an advantage. Visa scrutiny and quality controls favor established firms by increasing operational costs for new entrants.
Key players have made strategic moves to strengthen their positions. IDP Education acquired the British Council’s IELTS business in India and Intake Education, enhancing its testing and recruitment capabilities. A partnership with Adelaide University expanded its institutional reach. Navitas secured exclusive pathway arrangements with partner colleges, improving visa approval terms for students. Kaplan rebranded its Adelaide platform and focused on STEM and Allied Health pathways to meet postgraduate and pathway demand from India.
Opportunities exist in domestic educational travel and short courses for professionals from India, Nepal, and the Philippines. Flexible micro-credentials, regional field experiences, and culturally tailored domestic programs remain underdeveloped. Digital recruitment is becoming a competitive tool, as seen with Griffith University’s adoption of Salesforce Agentforce Education Cloud to enhance engagement. TAFE NSW International’s infrastructure investments and Manufacturing Centers of Excellence support vocational training. Competition is expected to remain strong among established operators, with growth depending on aligning compliance, housing, digital strategies, and India-focused product development.
Australia Educational Tourism Industry Leaders
-
Navitas Ltd
-
IDP Education Ltd
-
Kaplan International English Australia
-
TAFE NSW International
-
Academies Australasia Group Ltd
- *Disclaimer: Major Players sorted in no particular order
Recent Industry Developments
- May 2026: Australia's Department of Education will suspend new CRICOS registrations and course additions for VET providers enrolling international students from May 2026 to May 2027. Public institutions, including TAFEs and Table A universities, are exempt. This measure aims to remove low-quality operators from the international education system.
- April 2026: IDP Education expanded its student placement services to Malaysia, enhancing its counselling network and diversifying revenue sources beyond traditional Anglophone markets.
- February 2026: Adelaide University partnered with IDP Education to develop its international recruitment strategy for the 2026 intake. This collaboration establishes IDP as a key growth partner for Australia's newest Group of Eight university.
- January 2026: Australia reclassified India's visa evidence level under the Simplified Student Visa Framework, increasing documentation requirements and extending processing times for Indian applicants. The change, confirmed in India's Rajya Sabha, has led to longer wait times for visa processing.
Australia Educational Tourism Market Report Scope
| Less than 12 Years |
| 13 - 25 Years |
| 26 - 40 Years |
| Over 40 Years |
| Primary |
| Secondary |
| Graduation |
| Post-Graduation |
| Short-Term (Less than or equal to 4 weeks) |
| Medium-Term (1 - 3 months) |
| Long-Term (More than 3 months / full academic year) |
| Direct Enrolment |
| Education Agents & Counselors |
| Online & Digital Platforms |
| Others |
| Domestic |
| International |
| By Age Group | Less than 12 Years |
| 13 - 25 Years | |
| 26 - 40 Years | |
| Over 40 Years | |
| By Education Type | Primary |
| Secondary | |
| Graduation | |
| Post-Graduation | |
| By Course and Program Duration | Short-Term (Less than or equal to 4 weeks) |
| Medium-Term (1 - 3 months) | |
| Long-Term (More than 3 months / full academic year) | |
| By Booking Channel | Direct Enrolment |
| Education Agents & Counselors | |
| Online & Digital Platforms | |
| Others | |
| By Tourism Type | Domestic |
| International |
Key Questions Answered in the Report
How large is educational tourism in Australia in 2026?
The Australia educational tourism market stood at USD 22.55 billion in 2026 and is projected to reach USD 31.93 billion by 2031 at a 7.21% CAGR.
What is driving student travel demand into Australia most strongly?
Education export strength, continued inflows from India and China, Working Holiday Visa-led blended mobility, and differentiated STEM offerings are the main demand drivers.
Why is India becoming more important than before for providers?
India represented 17% of international students in 2026, contributed AUD 9.3 billion (USD 6.23 billion) in FY2024-25 export income, and is increasingly linked to postgraduate and work-rights-led demand.
Which education segment is the strongest by level of study?
Post-Graduation led with 36.13% share in 2025 and is also the fastest-growing education type at 8.15% CAGR through 2031.
What are the main risks holding back enrolment growth?
Tighter visa rules, higher application costs, record refusal pressure in some source markets, and major student housing shortages are the key limits on expansion.
Which part of Australia is attracting the most educational travel demand?
New South Wales and Victoria remained the leading destinations in FY2024-25, generating AUD 20.35 billion (USD 13.64 billion) and AUD 17.253 billion (USD 11.56 billion) in education export income, supported by their large university base, pathway providers, and stronger student services ecosystem.