
Australia Casino Tourism Market Size and Share
Market Overview
| Study Period | 2021 - 2031 |
|---|---|
| Forecast Data Period | 2026 - 2031 |
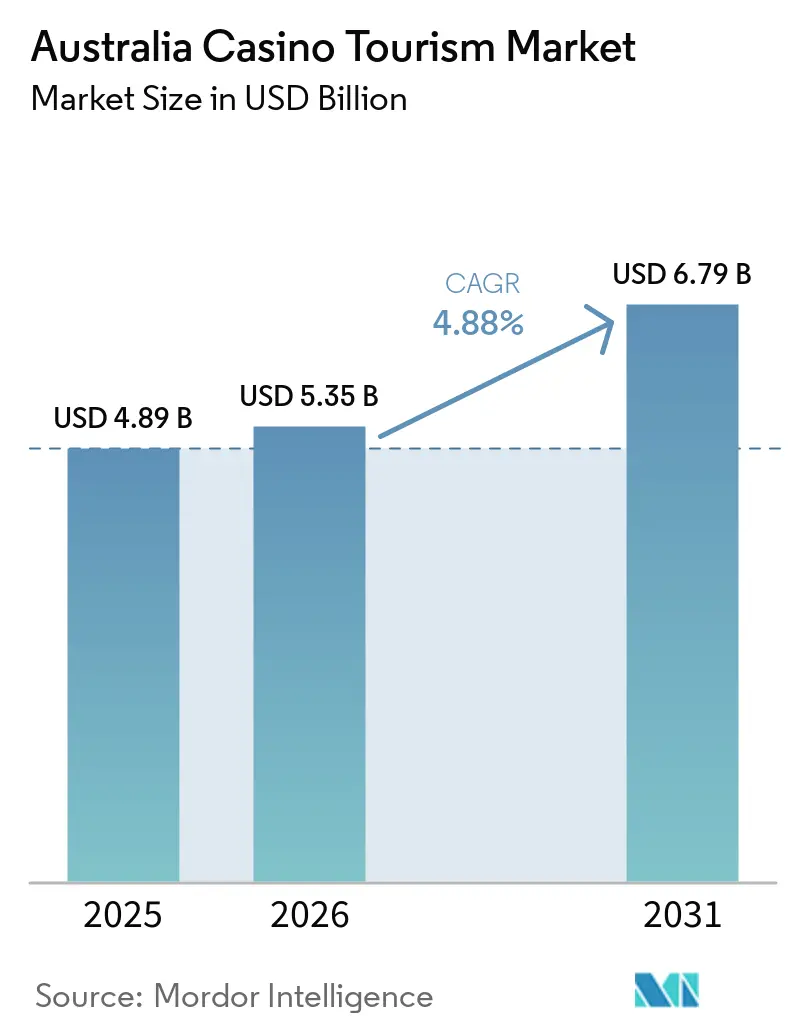
| Base Year Market Size (2025) | USD 4.89 Billion |
| Market Size (2026) | USD 5.35 Billion |
| Market Size (2031) | USD 6.79 Billion |
| Growth Rate (2026 - 2031) | 4.88 % |
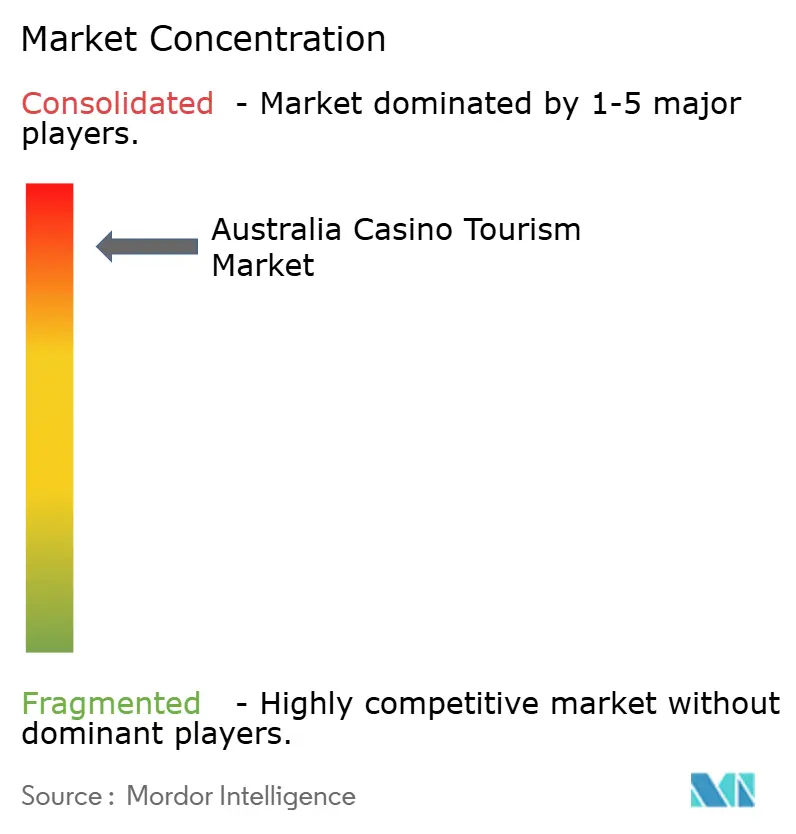
| Market Concentration | High |
Major Players *Disclaimer: Major Players sorted in no particular order Image © Mordor Intelligence. Reuse requires attribution under CC BY 4.0. | |
Australia Casino Tourism Market Analysis by Mordor Intelligence
The Australia Casino Tourism Market was valued at USD 4.89 billion in 2025 and is estimated to grow from USD 5.35 billion in 2026 to reach USD 6.79 billion by 2031, at a CAGR of 4.88% during the forecast period (2026–2031). The market is transitioning from recovery to an investment-driven phase, with operators focusing on hotels, dining, entertainment, and events to diversify revenue beyond gaming. Large integrated resort projects, such as the Queen’s Wharf Brisbane development, which opened its first phase in August 2024, are driving this shift by adding significant tourism assets[1]. Stricter oversight is in place as the reformed AML and CTF framework, effective March 31, 2026, raises compliance standards across the sector. Tourism demand remains strong, with recreational, cultural, and gambling services contributing AUD 9.3 billion (USD 6.2 billion) to tourism consumption in FY25. Tourism GDP reached AUD 81.1 billion (USD 54.4 billion) at current prices. The market has growth opportunities through a higher-value visitor mix, increased non-gaming revenue, and disciplined capital investments by key operators.
Key Report Takeaways
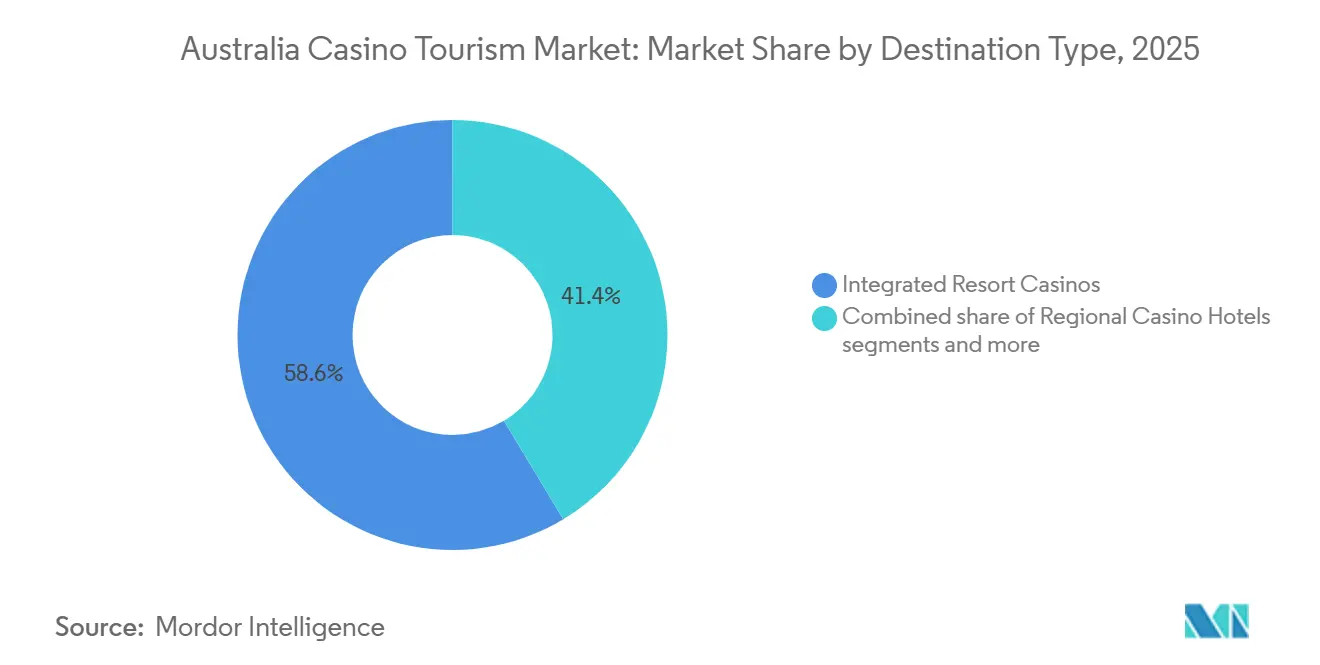
- By destination type, integrated resort casinos held 58.62% share of the Australia Casino Tourism Market in 2025, while the same segment is projected to grow at a CAGR of 5.23% through 2031.
- By traveler origin, domestic drive-in travelers accounted for 50.54% share of the Australia Casino Tourism Market in 2025, while international inbound travelers are projected to expand at a CAGR of 5.74% through 2031.
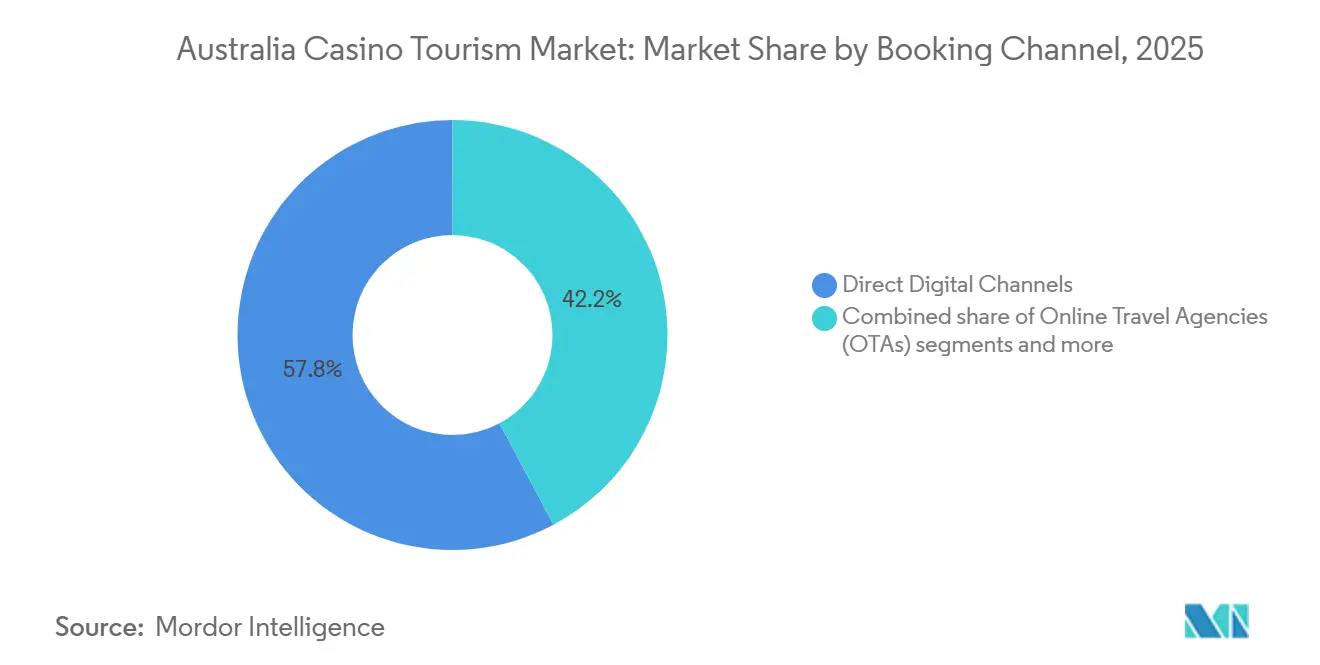
- By booking channel, direct digital channels held 56.62% share of the Australia Casino Tourism Market in 2025, while casino loyalty / VIP programs are forecast to grow at a CAGR of 6.25% through 2031.
- By geography, New South Wales held 37.93% share of the Australia Casino Tourism Market in 2025, while Queensland is projected to expand at a CAGR of 6.86% through 2031.
Note: Market size and forecast figures in this report are generated using Mordor Intelligence’s proprietary estimation framework, updated with the latest available data and insights as of January 2026.
Australia Casino Tourism Market Trends and Insights
Drivers Impact Analysis*
| Drivers | (~) % Impact on CAGR Forecast | Geographic Relevance | Impact Timeline |
|---|---|---|---|
| Premium integrated-resort repositioning and capex revival | +2.1% | National, led by Melbourne, Sydney, Perth, Brisbane | Medium term (2-4 years) |
| Domestic short-break and fly-in leisure resilience | +1.3% | National, highest density in New South Wales, Queensland, Victoria | Short term (≤ 2 years) |
| Inbound recovery from China and broader Asia | +1.8% | New South Wales, Queensland, Victoria, with secondary gains in Western Australia and South Australia | Medium term (2-4 years) |
| Business-events conversion around integrated resorts | +1.2% | Queensland, Victoria, New South Wales | Medium term (2-4 years) |
| New air-route depth into secondary casino gateways | +0.8% | Western Australia, Northern Territory, Queensland | Short term (≤ 2 years) |
| Higher-yield direct booking mix and loyalty-led capture | +0.9% | National | Long term (≥ 4 years) |
| Source: Mordor Intelligence | |||
Premium integrated-resort repositioning and capex revival
Australia's casino tourism market is shifting away from reliance on gaming-floor volume. Queen’s Wharf Brisbane exemplifies this change as an integrated resort combining hotel, casino, dining, and event facilities. Its first phase opened in August 2024, with the Queensland Government promoting it as a key tourism and urban development asset. This reflects the market's focus on mixed-use resort spending rather than gaming traffic alone[2]. Integrated resorts attract visitors by offering hotel stays, dining, entertainment, and retail in one location. This diversified spending strengthens the market, especially when regulatory controls limit gaming activities.
Domestic short-break and fly-in leisure resilience
Domestic demand drives the Australian casino tourism market, with properties near major urban centers such as Sydney and Melbourne benefiting from steady visitation. Short-break leisure trips support consistent demand, even when international recovery varies. Domestic visitors and interstate fly-in travelers exhibit different behaviors, with fly-in travelers typically spending more on hotel stays and food and beverages. This diversification reduces reliance on a single traveler type, providing operators with multiple ways to maintain occupancy and venue usage. Resilient short-break demand helps integrated resorts sustain occupancy and spending during periods of uneven international visitor recovery.
Inbound recovery from China and broader Asia
Australia's casino tourism market is experiencing growth, driven by increased spending from high-spending travelers, particularly from China and other Asian countries. Despite Chinese arrivals remaining below pre-pandemic levels, their spending has risen significantly compared to the previous year, indicating a shift toward a more affluent visitor demographic. Tourism Australia's ATE messaging emphasizes a preference for smaller, customized travel groups over traditional larger group formats. This shift aligns with the evolving strategies of Australian casino resorts, which are diversifying revenue streams beyond gaming activities. Resorts now focus on generating income through accommodations, dining, wellness, and entertainment offerings, reflecting broader changes in visitor preferences and market dynamics.
Business-events conversion around integrated resorts
The casino tourism market in Australia is increasingly driven by demand for conventions and events. Queen’s Wharf Brisbane recently opened an Event Center, described as Brisbane’s largest hotel ballroom, which reported limited availability for the rest of 2024 shortly after its launch. Queensland’s "Destination 2045" agenda, supported by state policies and budget allocations, emphasizes attracting events, improving aviation access, and generating tourism demand. This strategy is significant for the casino tourism market, as event attendees typically spend on accommodation, dining, nightlife, and entertainment. Such spending patterns help integrated resorts optimize revenue during weekdays, shoulder periods, and off-peak times.
Restraints Impact Analysis*
| Restraints | (~) % Impact on CAGR Forecast | Geographic Relevance | Impact Timeline |
|---|---|---|---|
| Carded play, cash limits, and compliance-led friction | -1.5% | National, most acute in New South Wales, Victoria, Western Australia, Tasmania | Short term (≤ 2 years) |
| AML/CTF remediation costs and licence oversight | -1.2% | National, most acute for The Star and SkyCity | Medium term (2-4 years) |
| Online wagering and local pokies substitution | -0.8% | National, concentrated in New South Wales | Long term (≥ 4 years) |
| VIP premium-play softness and slower China high-roller normalization | -0.7% | New South Wales, Victoria, with secondary impact in Queensland | Medium term (2-4 years) |
| Source: Mordor Intelligence | |||
Carded play, cash limits, and compliance-led friction
Australia's casino tourism market faces increased operational friction following regulatory changes. Measures such as carded play, stricter identification, enhanced due diligence, and cash controls aim to mitigate harm and financial crime risks but can disrupt the guest experience. In New South Wales, gaming venues with more than 20 gaming machine entitlements must now have Responsible Gambling Officers, adding a visible compliance layer[3]. These regulations do not reduce market demand but may limit spontaneous play and slow gaming floor activity. Operators dependent on seamless mass play are likely to experience greater challenges compared to those with diversified income from hotels, dining, and events.
AML/CTF remediation costs and licence oversight
Australia's casino tourism market faces financial challenges from crime remediation and license oversight. AUSTRAC's updated framework, effective in 2026, enforces stricter requirements for customer due diligence, governance, documentation, and independent evaluations[4]. Crown completed its AUSTRAC fine payment in FY25, while SkyCity Adelaide initiated a multi-year compliance upgrade following its settlement. These efforts highlight that remediation impacts multiple operators. Compliance programs demand significant capital, management focus, and operational resources, diverting attention from guest-focused investments. The market continues to grow despite elevated compliance costs and stricter investment return thresholds.
*Our forecasts treat driver/restraint impacts as directional, not additive. The impact forecasts reflect baseline growth, mix effects, and variable interactions.
Segment Analysis
By Destination Type: Integrated Resorts Drive Revenue Concentration
Integrated Resort Casinos held a 58.62% market share in 2025, making them the largest destination type in the Australian casino tourism market. They are also the fastest-growing segment, with a projected 5.23% CAGR through 2031. These properties attract visitors by combining accommodations, dining, entertainment, retail, and events into one location. The first phase opening of Queen’s Wharf Brisbane in August 2024 added new hotel, dining, event, and casino facilities, reinforcing the trend toward integrated resorts. The market increasingly favors destinations offering a complete resort experience rather than just gaming.
Boardwalk and waterfront properties remain significant, blending leisure settings with gaming access and appealing to domestic short-break visitors. Regional casino hotels play a key role as full-service hospitality anchors in local tourism systems. Daytrip and limited-stay casinos cater to price-sensitive domestic guests and shorter visits. While all these formats contribute to the Australian casino tourism market, integrated resorts maintain an advantage by spreading compliance costs and fixed overheads across multiple revenue streams. This structural benefit is expected to sustain high revenue concentration throughout the forecast period.

By Traveler Origin: Domestic Volume Meets International Yield
Domestic Drive-In Travelers held a 50.54% share in 2025, highlighting the Australian casino tourism market's reliance on local and nearby demand. Their proximity reduces travel costs and encourages frequent visits, ensuring consistent footfall at major casino hubs. Domestic Fly-In Travelers, though a smaller segment, contribute significantly through hotel stays and higher non-gaming expenditures, increasing trip value. This balance supports steady domestic volume and higher-yield interstate visits, helping urban resorts maintain occupancy even during uneven international traffic.
International inbound travelers are the fastest-growing segment in the Australian casino tourism market, with a projected 5.74% CAGR through 2031. Chinese visitors spent AUD 11.25 billion (USD 7.54 billion) as of December 2025, complementing strong overall growth in total international visitor expenditure. These figures indicate the market benefits more from high-value inbound travelers than from arrival recovery alone. The industry is focusing on direct bookings, enhanced accommodation, and curated resort experiences for international guests, prioritizing yield quality alongside visitor numbers.
By Booking Channel: Digital Dominance Enables Personalized Yield Management
Direct Digital Channels accounted for 56.62% of bookings in 2025, making them the leading route in Australia's casino tourism market. This shift allows operators greater control over rate integrity, guest communication, and pre-arrival cross-selling while reducing reliance on third-party intermediaries. Operators are prioritizing cleaner customer data and improved compliance visibility, positioning direct distribution as a strategic capability rather than just a cost-effective sales channel. This advantage is particularly significant for large operators with extensive hotels, dining, entertainment, and loyalty ecosystems.
Casino Loyalty and VIP Programs represent the fastest-growing booking channels, with the market size projected to grow at a 6.25% CAGR through 2031. This growth highlights the increasing importance of guest data, repeat visits, and personalized offers. Group and convention bookings remain vital, as integrated resorts bundle rooms, event spaces, dining, and entertainment, especially were state tourism policies support event attraction. Offline agents and broad OTA distribution continue to serve first-time travelers and price-sensitive bookings but lack control over guest lifetime value. As a result, the industry is expected to allocate more spending to first-party channels during the forecast period.
Geography Analysis
New South Wales accounted for 37.93% of Australia's casino tourism market share in 2025, making it the largest geographic segment. This is due to the presence of Crown Sydney and The Star Sydney in Sydney, which attracts a mix of domestic and international visitors. However, stricter responsible gambling policies in NSW have increased compliance requirements, potentially impacting gaming activity despite steady visitation.
Queensland is the fastest-growing region in the market, with a projected CAGR of 6.86% through 2031. Growth is driven by Queen’s Wharf Brisbane and the state’s tourism strategy, which focuses on improving aviation access, attracting events, and investing in the visitor economy. The addition of new supply and policy support positions Queensland to convert short-term visits into extended resort stays, potentially narrowing its gap with NSW in the coming years.
Victoria remains a key player in the market, with Crown Melbourne benefiting from strong domestic tourism and business events. Melbourne’s diverse calendar of conferences, arts, and events ensures demand extends beyond gaming. The Rest of Australia also contributes significantly, with Crown Perth in Western Australia, SkyCity Adelaide in South Australia, casinos in Tasmania, and regional venues in the Northern Territory and the ACT. In its 2025 Annual Report, SkyCity reported Adelaide revenue of AUD 212.2 million (USD 142.2 million), highlighting that resilient local visitation helped anchor the property despite a challenging economic climate and increased VIP customer churn from strict compliance upgrades. While the market is concentrated, its reach extends beyond a single city or resort model.
Competitive Landscape
The Australian casino tourism market is dominated by Crown Resorts and The Star Entertainment Group, which together control a significant share of revenues. Crown holds a larger share, while The Star follows, creating a market heavily influenced by these two operators. This dominance allows them greater control over compliance, customer data, hotel inventory, and capital allocation. Strategic decisions by these companies can quickly impact the market, where competition focuses on resort quality, customer insights, and financial flexibility rather than the number of licenses.
Ownership and capital structures in the market have been undergoing adjustments. Bally’s Corporation made a strategic capital investment in The Star through convertible notes and subordinated debt to stabilize its operations and avoid administration. The Star later sold its stake in the Destination Brisbane Consortium, removing future equity obligations tied to Queen’s Wharf Brisbane. These actions reflect ongoing efforts to repair balance sheets and reshape portfolios, with asset control and funding access remaining critical to competitive positioning.
Smaller and regional operators, while relevant, lack the influence of the top two groups. Properties like Lasseters Hotel Casino are focusing on redevelopment to enhance their appeal as resort destinations. The market is increasingly divided between large integrated resorts with strong capital access and smaller properties relying on location, local loyalty, and targeted upgrades. Regulatory barriers, including stringent AML and CTF requirements, protect existing license holders by demanding higher governance standards. This combination of market concentration, compliance pressures, and selective reinvestment is expected to maintain a tightly structured market through 2031.
Australia Casino Tourism Industry Leaders
-
Crown Resorts Limited
-
The Star Entertainment Group Limited
-
SkyCity Entertainment Group / SkyCity Adelaide
-
Federal Group
-
Mindil Beach Casino Resort
- *Disclaimer: Major Players sorted in no particular order
Recent Industry Developments
- April 2026: : The Star Entertainment Group sold its 50% stake in Queen’s Wharf Brisbane (Destination Brisbane Consortium) to CTFE and FEC for AUD 53 million (USD 35.5 million), fully exiting the joint venture and eliminating further equity obligations.
- March 2026: AUSTRAC’s updated AML/CTF framework requires regulated entities, including banks and casinos, to prove their systems mitigate financial crime risks. The outcomes-based regime holds senior management accountable for governance and mandates the formal appointment of a qualified compliance officer.
- January 2026: Crown Resorts implemented Canary Technologies at its properties in Melbourne, Sydney, and Perth, enhancing the direct guest journey with mobile check-in, guest messaging, and digital upselling features.
- December 2025: Bally’s Corporation and the Mathieson family acquired over 61% of The Star Entertainment Group after securing regulatory approvals, marking a significant ownership change in the sector.
Australia Casino Tourism Market Report Scope
| Integrated Resort Casinos |
| Boardwalk / Waterfront Casino Destinations |
| Regional Casino Hotels |
| Limited-Stay / Day-Trip Casinos |
| Domestic Drive-In Travelers |
| Domestic Fly-In Travelers |
| International Inbound Travelers |
| Direct Digital Channels |
| Online Travel Agencies (OTAs) |
| Casino Host / VIP Programs |
| Group & Convention Booking |
| Offline Travel Agents |
| New South Wales |
| Victoria |
| Queensland |
| Rest Of Australia |
| By Destination Type | Integrated Resort Casinos |
| Boardwalk / Waterfront Casino Destinations | |
| Regional Casino Hotels | |
| Limited-Stay / Day-Trip Casinos | |
| By Traveler Origin | Domestic Drive-In Travelers |
| Domestic Fly-In Travelers | |
| International Inbound Travelers | |
| By Booking Channel | Direct Digital Channels |
| Online Travel Agencies (OTAs) | |
| Casino Host / VIP Programs | |
| Group & Convention Booking | |
| Offline Travel Agents | |
| By Geography | New South Wales |
| Victoria | |
| Queensland | |
| Rest Of Australia |
Key Questions Answered in the Report
What is the expected value of Australia casino tourism by 2031?
The Australia casino tourism market is forecast to reach USD 6.79 billion by 2031, rising from USD 5.35 billion in 2026 at a 4.88% CAGR over 2026-2031.
Which destination type leads revenue generation in Australia?
Integrated Resort Casinos lead the market with 58.62% share in 2025 and remain the fastest-growing destination type at 5.23% CAGR through 2031.
Why is Queensland growing faster than other states?
Queensland is projected to grow at 6.86% CAGR through 2031, supported by Queen’s Wharf Brisbane, event-led demand, and state-backed aviation and tourism initiatives.
Who are the main operators in Australian casino tourism?
Crown Resorts and The Star Entertainment Group dominate the sector, with estimated 2025 shares of 59.5% and 24.9%, respectively, based on the supplied draft.
What is driving demand beyond gaming floors?
Growth is increasingly coming from hotels, dining, entertainment, conventions, and premium stay experiences, especially at integrated resorts.
What is the biggest operational risk for casino resorts in Australia?
The key risk remains tighter AML and CTF compliance, including stronger due diligence, governance, and operating controls that raise cost and add customer friction.