Market Overview
| Study Period | 2020 - 2031 |
|---|---|
| Forecast Data Period | 2026 - 2031 |
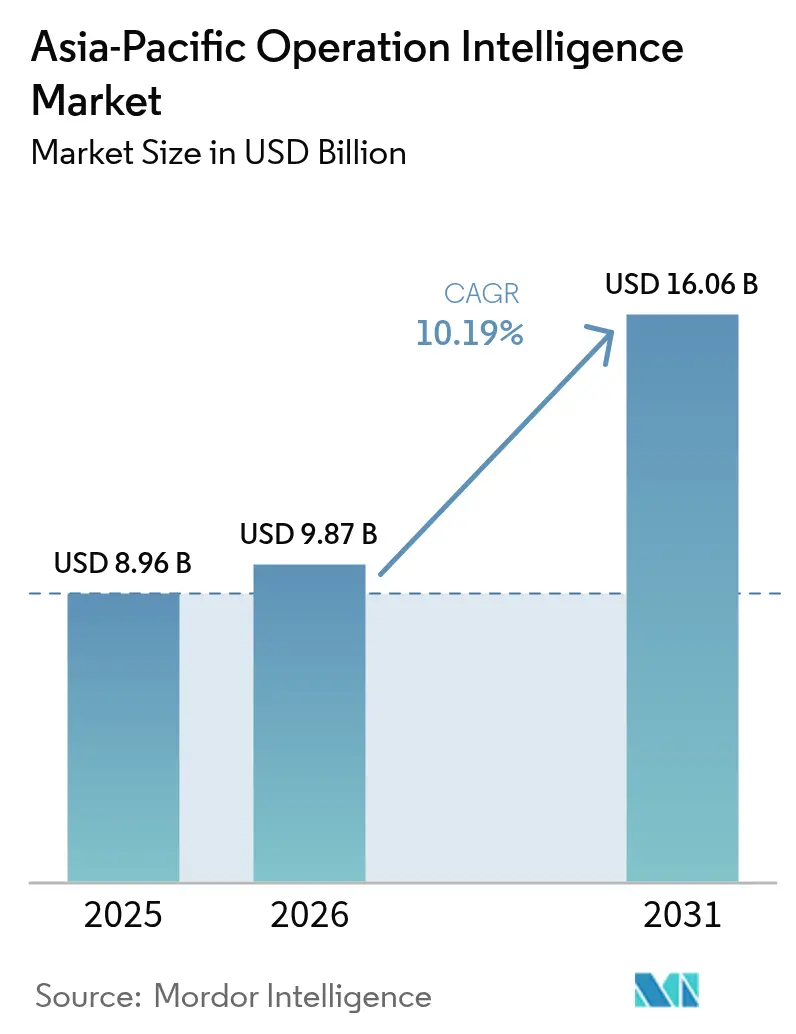
| Base Year Market Size (2025) | USD 8.96 Billion |
| Market Size (2026) | USD 9.87 Billion |
| Market Size (2031) | USD 16.06 Billion |
| Growth Rate (2026 - 2031) | 10.19% CAGR |
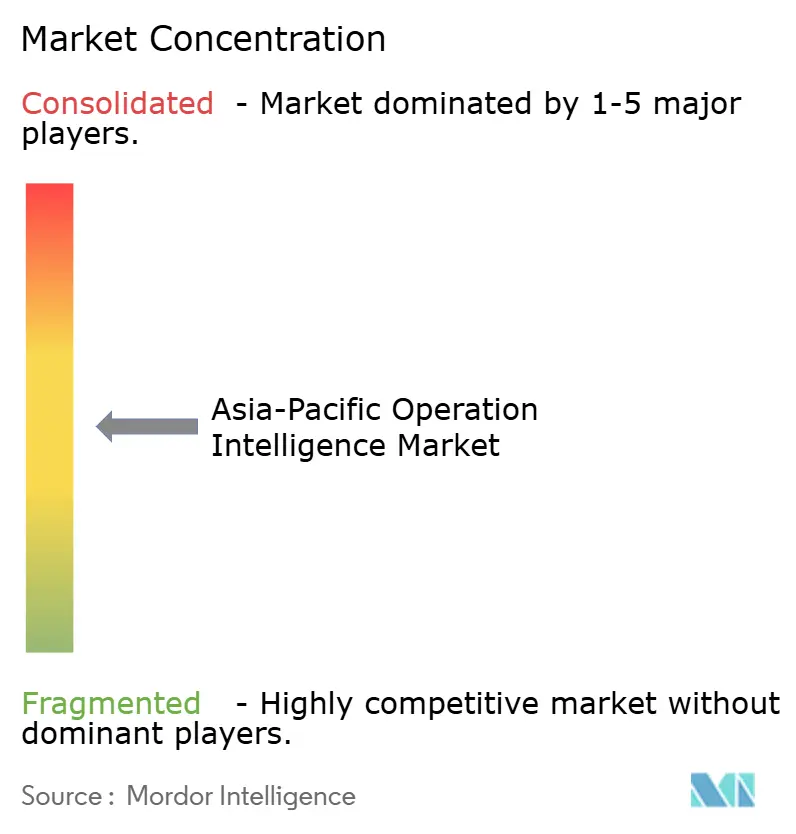
| Market Concentration | Medium |
Major Players*Disclaimer: Major Players sorted in no particular order Image © Mordor Intelligence. Reuse requires attribution under CC BY 4.0. | |
Asia-Pacific Operation Intelligence Market Analysis by Mordor Intelligence
The Asia-Pacific operation intelligence market size was valued at USD 8.96 billion in 2025 and estimated to grow from USD 9.87 billion in 2026 to reach USD 16.06 billion by 2031, at a CAGR of 10.19% during the forecast period (2026-2031). This expansion is fueled by a rapid transition from batch reporting to event-driven analytics that merges IoT telemetry, complex-event processing, and edge-based machine-learning inference. Demand for sovereign-cloud and hybrid deployments is rising as China’s Personal Information Protection Law and India’s Digital Personal Data Protection Act restrict cross-border streaming of production data. Region-wide 5G private-network initiatives trim sensor-to-cloud latency below 10 milliseconds, allowing predictive-maintenance and vision-guided robotics that had previously been throttled by Wi-Fi jitter. Energy-management analytics are accelerating on the back of carbon-accounting mandates in Japan, Singapore, and Australia, while integration complexity and talent shortages remain near-term headwinds.
Key Report Takeaways
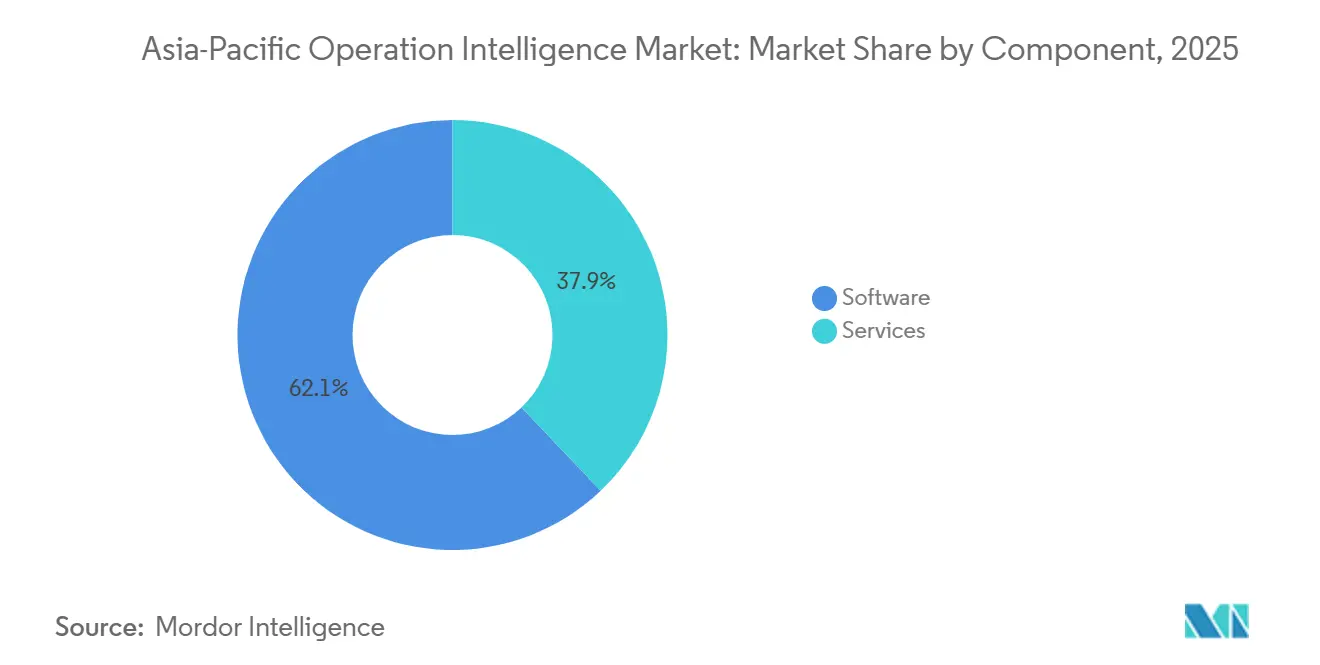
- By component, software led with a 62.10% f the Asia-Pacific operation intelligence market size in 2025, whereas services are forecast to advance at an 11.23% CAGR to 2031.
- By deployment type, cloud captured 71.05% of the Asia-Pacific operation intelligence market size in 2025, while hybrid architectures are projected to grow fastest at 11.58% CAGR through 2031.
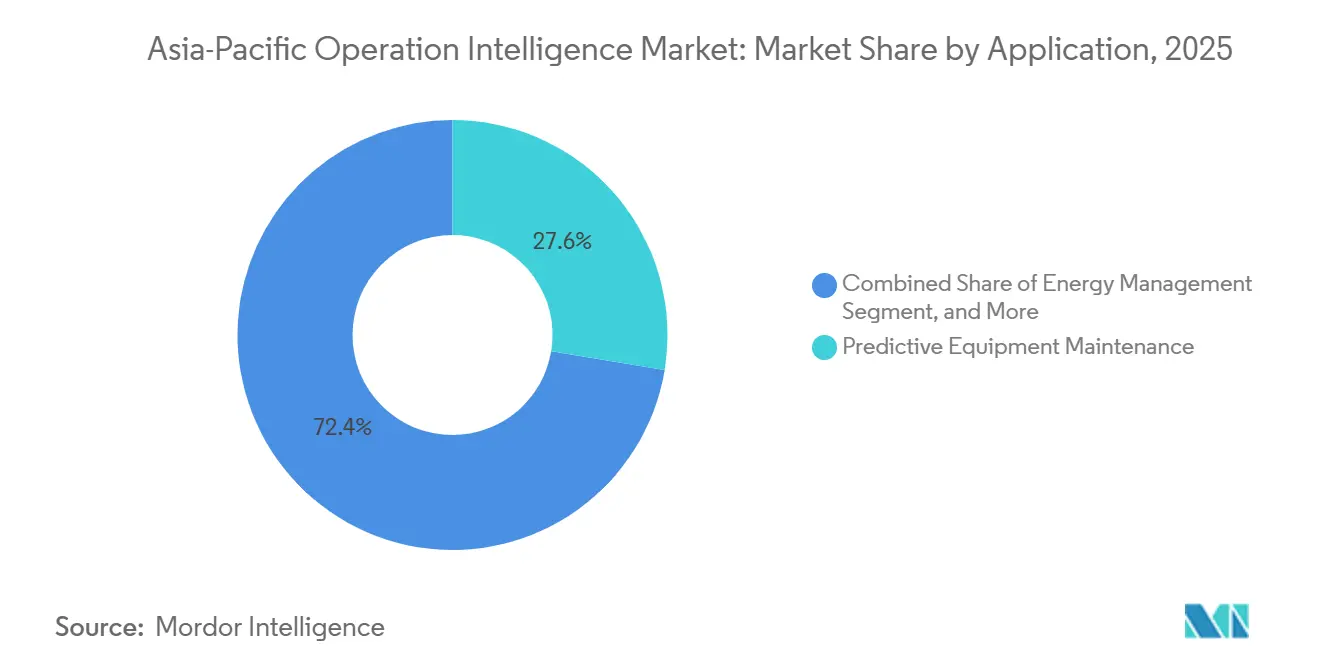
- By application, predictive equipment maintenance accounted for 27.60% f the Asia-Pacific operation intelligence market size in 2025; energy management is expected to expand at a 10.83% CAGR to 2031.
- By end-user vertical, manufacturing held 20.35% f the Asia-Pacific operation intelligence market size in 2025, yet energy and utilities will register the highest growth with a 10.62% CAGR through 2031.
Note: Market size and forecast figures in this report are generated using Mordor Intelligence’s proprietary estimation framework, updated with the latest available data and insights as of 2026.
Asia-Pacific Operation Intelligence Market Trends and Insights
Drivers Impact Analysis*
| Driver | (~) % Impact on CAGR Forecast | Geographic Relevance | Impact Timeline |
|---|---|---|---|
| Proliferation of IoT devices generating real-time data streams | +2.1% | China, India, Southeast Asia core; spillover to ANZ | Medium term (2-4 years) |
| Government-led 5G private-network roll-outs in Asia-Pacific smart factories | +1.8% | Thailand, Malaysia, Singapore, South Korea; expanding to China tier-2 cities | Short term (≤ 2 years) |
| Growing need for real-time operational visibility in manufacturing and logistics | +1.6% | Global Asia-Pacific, with concentration in China, Japan, India manufacturing hubs | Medium term (2-4 years) |
| Increasing demand for "green" OI in carbon-compliance reporting | +1.3% | Japan, Singapore, Australia; emerging in China, South Korea | Long term (≥ 4 years) |
| Rapid adoption of cloud-based big-data analytics platforms | +1.5% | Global Asia-Pacific, led by China, India, Southeast Asia | Short term (≤ 2 years) |
| Rising adoption of event-driven micro-services architecture | +1.2% | China, India, Japan technology hubs; gradual spread to Southeast Asia | Medium term (2-4 years) |
| Source: Mordor Intelligence | |||
Proliferation Of IoT Devices Generating Real-Time Data Streams
Industrial facilities across Asia-Pacific continue to embed sensors in production assets, assembly-line robots, and utility infrastructure. Midea Group’s smart-appliance factories in Foshan now stream 14 terabytes of time-series data each day from 87,000 connected actuators, cutting scrap by 19% in 2024.[1]Midea Group, “Sustainability Report 2024,” midea.com BMW Brilliance’s Shenyang plant ingests vibration and thermal signals from 12,000 CNC spindles to forecast bearing failures 72 hours ahead and reduce unplanned downtime by 34%.[2]BMW AG, “BMW Group Annual Report 2024,” bmwgroup.com Edge gateways that aggregate sensor bursts before cloud upload have trimmed egress costs by as much as 70% while still meeting sub-second response requirements. The resulting data deluge is pushing enterprises toward stream-native architectures anchored in Apache Kafka and MQTT, strengthening long-term demand for scalable operation intelligence market platforms.
Government-Led 5G Private-Network Roll-Outs In Asia-Pacific Smart Factories
Thailand’s regulator allocated 100 MHz in the 3.7 GHz band for private 5G in 2024, enabling Charoen Pokphand Foods to support 4,500 devices with guaranteed 10-millisecond latency at its Saraburi complex. South Korea subsidized up to 40% of private-5G infrastructure costs for small and mid-size manufacturers, catalyzing 230 deployments across Gyeonggi and Ulsan industrial parks. Singapore’s 5G testbed at Jurong Innovation District lets 18 manufacturers stream 4K video from helmet cameras to cloud-vision models for augmented-reality maintenance. Toyota’s Guangzhou plant synchronizes press-shop and welding operations in real time over 5G, cutting work-in-process inventory by 22%. These roll-outs reinforce the operation intelligence market by making deterministic, wire-free data transport a factory-floor default.
Growing Need For Real-Time Operational Visibility In Manufacturing And Logistics
Supply-chain disruptions have accelerated adoption of unified dashboards that stitch together shop-floor, warehouse, and in-transit data. DHL Supply Chain integrated RFID, conveyor sensors, and yard-management feeds across 47 warehouses in China, India, and Southeast Asia, shrinking order-to-ship cycle time by 18%. Maersk’s terminals in Singapore and Tanjung Pelepas optimize berth schedules using quay-crane telemetry and truck-positioning data, improving vessel turnaround by 14% in the first half of 2024. Hyundai Motor’s Ulsan complex ingests real-time GPS and temperature data from 1,200 supplier trucks to cut line stoppages by 29%. JD Logistics leverages traffic, weather, and customer-availability feeds to reduce failed deliveries by 23% across tier-2 cities. Such results underline why enterprises continue to scale investment in the operation intelligence market.
Increasing Demand For “Green” OI In Carbon-Compliance Reporting
Singapore’s Climate Impact X registry requires hourly disclosure of Scope 1-3 emissions, motivating factories to collect energy metrics at the machine level. Yokogawa’s CI Server aggregates smart-meter and historian data to deliver ISO 14064-compliant carbon footprints, enabling corrective action inside 48 hours. Japan’s revised Energy Conservation Act obliges large sites to submit monthly efficiency reports, driving automation of data capture.[3]India Ministry of Electronics and IT, “Production-Linked Incentive Scheme,” meity.gov.in Australia lifted its carbon price to AUD 75 (USD 50) per ton in 2024, prompting Rio Tinto to deploy real-time route analytics that trimmed diesel use by 11% in Pilbara mines. These regulations are redefining investment priorities across the operation intelligence market.
Restraints Impact Analysis*
| Restraint | (~) % Impact on CAGR Forecast | Geographic Relevance | Impact Timeline |
|---|---|---|---|
| Integration complexity with legacy OT systems | -1.4% | Global Asia-Pacific, acute in Japan, South Korea brownfield sites | Medium term (2-4 years) |
| Shortage of skilled data-engineering and DevOps talent | -1.2% | India, China, Southeast Asia; less severe in Japan, ANZ | Short term (≤ 2 years) |
| Escalating data-sovereignty regulations limiting cross-border streaming | -0.9% | China, India, Indonesia; emerging in Vietnam, Thailand | Long term (≥ 4 years) |
| High latency in rural areas limiting edge analytics quality | -0.7% | Indonesia, India tier-2/3 cities, Philippines, Vietnam rural zones | Medium term (2-4 years) |
| Source: Mordor Intelligence | |||
Integration Complexity With Legacy OT Systems
Brownfield factories in Japan and South Korea often rely on Mitsubishi MELSEC, Omron FINS, and serial Modbus links that lack native IP connectivity. Retrofitting a single cell with protocol-translation gateways costs USD 8,000-15,000 and can take up to 14 months once validation and cybersecurity hardening are included. Siemens disclosed that 62% of its 2024 Asia-Pacific integration projects faced delays caused by undocumented ladder logic and missing electrical drawings. A typical automotive line may run 14 field-bus standards, each needing custom drivers. Air-gapped facilities in defense elevate cost further because all analytics must execute on-premise, increasing total cost of ownership by up to 60%.
Shortage Of Skilled Data-Engineering And DevOps Talent
LinkedIn postings for “OT data engineer” increased by 47% year-over-year in 2024, yet the median time-to-fill still exceeded 90 days in India and China. Hybrid cloud-edge deployments require proficiency in Kubernetes, Terraform, and MQTT as well as PLC programming, a combination possessed by fewer than 3% of IT professionals in the region. Salary premiums of 35-50% above standard software engineer pay compress systems integrator margins and slow new project launches. Academic curricula remain heavily siloed, compelling employers to invest up to nine months in on-the-job cross-training. Unless supply improves, the talent gap could curb near-term growth in the operation intelligence market.
*Our forecasts treat driver/restraint impacts as directional, not additive. The impact forecasts reflect baseline growth, mix effects, and variable interactions.
Segment Analysis
By Component: Services Surge As Integration Backlogs Mount
Software retained a 62.10% revenue share in 2025, anchored by real-time analytics engines such as Apache Flink and TIBCO StreamBase that transform multi-protocol telemetry into actionable insights. However, services are projected to outpace software at an 11.23% CAGR through 2031 as companies seek expert help to map business processes to event-driven architectures aligned with ISA-95. Integration engagements that retrofit decades-old SCADA lines with MQTT gateways accounted for 42% of 2024 services revenue, and average project value at Hitachi Vantara reached USD 1.8 million. Support contracts are also expanding as enterprises shift from perpetual licenses to subscription bundles that guarantee 99.9% uptime.
Demand for machine-learning inference directly inside streaming pipelines is sharpening focus on unified development stacks. Alibaba Cloud’s DataWorks and Databricks Delta Live Tables let data engineers orchestrate both batch ETL and low-latency scoring without managing multiple tools. This convergence accelerates deployment cycles and improves stickiness for platform vendors, further enlarging the operation intelligence market.


By Deployment Type: Hybrid Gains As Sovereignty Trumps Cost
Cloud held 71.05% of revenue in 2025, buoyed by the pay-as-you-go convenience of hyperscale IoT suites. Yet hybrid architectures are forecast to rise at an 11.58% CAGR because regulatory friction and latency constraints make full off-premise hosting impractical for many time-sensitive workloads. China’s data-localization rules require that production telemetry stay on domestic servers unless security reviews are passed, a process that can add 6-12 months to rollout timelines. Huawei’s FusionPlant, which combines on-premise edge nodes with domestic cloud regions, saw installs climb 52% in 2024.
In India, logistics operators keep driver and customer data in-country to comply with the Digital Personal Data Protection Act, while forwarding non-sensitive route analytics to global regions for fleet-wide optimization. Hybrid models also mitigate 80-150 millisecond RTTs common in Indonesia’s Java corridor by performing anomaly detection and closed-loop control locally before forwarding aggregates to a central lake. The resulting architectural mix positions hybrid as the fastest-growing slice of the operation intelligence market.
By Application: Energy Management Accelerates On Carbon Mandates
Predictive equipment maintenance accounted for 27.60% of 2025 revenue, enabled by vibration, thermal, and oil-analysis sensors that spot bearing or transformer issues days in advance. Energy management, however, is expected to post a 10.83% CAGR as carbon-pricing schemes motivate asset-level tracking of Scope 2 emissions. Rio Tinto’s Pilbara mines deployed real-time route analytics that saved 180,000 tons of CO₂ in 2024. Supply-chain optimization reached 19% of revenue thanks to end-to-end visibility dashboards at DHL and Maersk, while security analytics represented 14% as vision models enforce PPE compliance on the shop floor.
Retailers are embedding foot-traffic sensors and Bluetooth beacons to shorten checkout queues and personalize offers, driving 12% of revenue. Fraud-detection use cases in banking and insurance command 11%, demonstrated by DBS Bank’s system that highlights anomalies across 14 million daily transactions. Collectively, these expanding workflows reinforce the diversified growth profile of the operation intelligence market.
By End-User Vertical: Energy And Utilities Electrify Growth
Manufacturing maintained a 20.35% share in 2025 as automotive and electronics plants adopted digital twins that mirror their physical lines in real-time. Yet the energy and utilities sector is projected to deliver a 10.62% CAGR because grid operators must juggle renewables, storage, and flexible loads. OCBC Bank’s graph analytics platform processes 22 million daily transactions to unmask cross-border money-laundering rings, illustrating the sophistication of financial services deployments. Retail and e-commerce captured 15% by leveraging in-store sensors to optimize inventory turns, while telecom operators use operational intelligence to predict 5G congestion and automate incident response.
Transportation and logistics accounted for 11% of revenue, highlighted by Changi Airport’s unified telemetry hub, which shaved 12 minutes off the average connection time. Government smart-city projects, healthcare patient-flow management, and defense predictive maintenance round out the remainder, underscoring the breadth of the operation intelligence market.
Geography Analysis
China remains the largest consumer of operational-intelligence solutions, propelled by CNY 180 billion (USD 25 billion) in smart-manufacturing subsidies under the Made in China 2025 program. Alibaba Cloud’s DataWorks bookings climbed 41% across Guangdong, Jiangsu, and Zhejiang as electronics and automotive firms standardized on a single data pipeline template. Huawei’s FusionPlant gained traction in Sichuan and Henan, where local authorities reimburse up to 30% of digital-upgrade spend. Japan’s market skews on-premise because manufacturers are risk-averse and adherence to local residency guidelines is high; Hitachi reported a 29% jump in integration revenue as factories modernized vintage PLCs.
India is the fastest-growing sub-region, thanks to production-linked incentives that encourage the adoption of digital twins in electronics, pharmaceuticals, and textiles. Tata Consultancy Services secured 14 multi-plant engagements worth USD 87 million within a year. South Korea’s 5G subsidies translated into 230 new private-network deployments, ensuring sub-10-millisecond control loops for collaborative robots. Singapore exhibits the region’s highest cloud penetration, whereas Indonesia, Vietnam, and the Philippines favor hybrid setups due to bandwidth constraints. Australia and New Zealand are leveraging higher carbon prices to justify real-time emission analytics. Taiwan’s semiconductor fabs continue to drive demand for high-precision process control that interfaces with ASML lithography gear.
South Korea's private-5G subsidies catalyzed 230 deployments in Gyeonggi and Ulsan industrial parks, enabling manufacturers to achieve sub-10-millisecond latency for collaborative robots and automated guided vehicles. Southeast Asia presents a bifurcated landscape, for instance, Singapore leads in cloud adoption, with 78% of operational-intelligence workloads running on AWS, Azure, or Google Cloud, while Indonesia, Vietnam, and the Philippines favor hybrid architectures due to bandwidth constraints and nascent data-center ecosystems
Competitive Landscape
The Asia-Pacific operation intelligence market is moderately fragmented: the top five vendors, Alibaba Cloud, Microsoft, IBM, Huawei, and Hitachi, controlled a significant share of 2024 revenue. Hyperscalers emphasize managed services and integration with broader cloud portfolios, while regional specialists differentiate through domain expertise in process industries and local-language support. Alibaba Cloud’s vertical templates cut greenfield deployment timelines from nine months to twelve weeks. Microsoft embeds Azure IoT Edge into Siemens Industrial Edge devices to eliminate gateway management overhead. IBM’s Instana integration won a USD 32 million contract with a Japanese tier-1 automotive supplier to predict failures 48 hours in advance.
White-space opportunities abound among mid-tier manufacturers in Indonesia and Vietnam, where connectivity remains patchy yet Industry 4.0 subsidies are generous. Databricks extended its lakehouse architecture to continuous streaming, and Confluent’s managed Kafka service reduces barrier-to-entry for firms lacking in-house stream-processing talent. Patent filings rose 38% in 2024, with Huawei, NEC, and Fujitsu focusing on edge-inference optimization and federated learning. Standards bodies such as the Industrial Internet Consortium are aligning on OPC UA-over-TSN and MQTT Sparkplug B, a move that may commoditize middleware and shift competition to application-layer analytics.
Asia-Pacific Operation Intelligence Industry Leaders
Splunk Inc.
SAP SE
Schneider Electric SE
Rolta India Limited
Hewlett Packard Enterprise Company
- *Disclaimer: Major Players sorted in no particular order

Recent Industry Developments
- November 2025: Microsoft Azure committed USD 340 million to roll out its IoT Operations platform at 12 new edge sites in India, Indonesia, and Vietnam. The localized compute keeps industrial data inside national borders and still delivers sub-20-millisecond response times for closed-loop control. Forty-seven pilots in automotive and electronics plants have already gone live, and early users are cutting cloud-egress bills by 28%–35%
- August 2025: Hitachi Vantara and Siemens AG formed a USD 280 million joint venture that marries Hitachi’s Lumada analytics with the Siemens Industrial Edge runtime. The program targets brownfield factories in Japan, South Korea, and Taiwan, supplying pre-certified modules that shrink retrofit timelines for legacy S7 and MELSEC PLCs from 14 months to about 6 months
- June 2025: Alibaba Cloud introduced DataWorks Industrial Edition in Jakarta, Bangkok, and Kuala Lumpur, backed by a USD 420 million investment in three data centers that satisfy local data-residency rules. Pre-built templates for automotive, electronics, and food processing let manufacturers spin up end-to-end analytics pipelines in as little as 8–10 weeks rather than the nine-month norm
- March 2025: Schneider Electric and Tata Consultancy Services opened an operational-intelligence center of excellence in Pune with USD 125 million earmarked over three years. The facility will co-create energy-management and carbon-reporting solutions for pharmaceutical and chemical plants that must meet FDA 21 CFR Part 11 and ISO 27001 standards, with a goal of 60 deployments across India and Southeast Asia by the close of 2026


Asia-Pacific Operation Intelligence Market Report Scope
The Asia-Pacific operation intelligence market report is segmented by Component (Software, and Services), Deployment Type (Cloud, On-Premise, Hybrid), Application (Predictive Equipment Maintenance, Security and Surveillance Analytics, Customer-Experience Management, Supply-Chain and Logistics Optimisation, Energy Management, Fraud Detection and Risk Management, IT Operations Analytics, Other Application), End-User Vertical (Retail and E-Commerce, Manufacturing, Banking, Financial Services and Insurance (BFSI), Government and Public Sector, Information Technology and Telecommunications, Defence and Aerospace, Transportation and Logistics, Healthcare and Life Sciences, Energy and Utilities, Other End-user Vertical), and Geography (China, Japan, India, South Korea, Australia and New Zealand, Southeast Asia, Rest of Asia-Pacific). The Market Forecasts are Provided in Terms of Value (USD).
By Component
| Software | Real-time Analytics Platforms |
| Data-visualisation Tools | |
| Complex-event-processing Engines | |
| Services | Consulting and Advisory |
| Integration and Deployment | |
| Support and Maintenance |
By Deployment Type
| Cloud |
| On-Premise |
| Hybrid |
By Application
| Predictive Equipment Maintenance |
| Security and Surveillance Analytics |
| Customer-experience Management |
| Supply-chain and Logistics Optimisation |
| Energy Management |
| Fraud Detection and Risk Management |
| IT Operations Analytics |
| Other Application |
By End-user Vertical
| Retail and E-commerce |
| Manufacturing |
| Banking, Financial Services and Insurance (BFSI) |
| Government and Public Sector |
| Information Technology and Telecommunications |
| Defence and Aerospace |
| Transportation and Logistics |
| Healthcare and Life Sciences |
| Energy and Utilities |
| Other End-user Vertical |
By Country
| China |
| Japan |
| India |
| South Korea |
| Australia and New Zealand |
| Southeast Asia |
| Indonesia |
| Malaysia |
| Philippines |
| Singapore |
| Thailand |
| Vietnam |
| Rest of Asia-Pacific |
| By Component | Software | Real-time Analytics Platforms |
| Data-visualisation Tools | ||
| Complex-event-processing Engines | ||
| Services | Consulting and Advisory | |
| Integration and Deployment | ||
| Support and Maintenance | ||
| By Deployment Type | Cloud | |
| On-Premise | ||
| Hybrid | ||
| By Application | Predictive Equipment Maintenance | |
| Security and Surveillance Analytics | ||
| Customer-experience Management | ||
| Supply-chain and Logistics Optimisation | ||
| Energy Management | ||
| Fraud Detection and Risk Management | ||
| IT Operations Analytics | ||
| Other Application | ||
| By End-user Vertical | Retail and E-commerce | |
| Manufacturing | ||
| Banking, Financial Services and Insurance (BFSI) | ||
| Government and Public Sector | ||
| Information Technology and Telecommunications | ||
| Defence and Aerospace | ||
| Transportation and Logistics | ||
| Healthcare and Life Sciences | ||
| Energy and Utilities | ||
| Other End-user Vertical | ||
| By Country | China | |
| Japan | ||
| India | ||
| South Korea | ||
| Australia and New Zealand | ||
| Southeast Asia | ||
| Indonesia | ||
| Malaysia | ||
| Philippines | ||
| Singapore | ||
| Thailand | ||
| Vietnam | ||
| Rest of Asia-Pacific | ||


Key Questions Answered in the Report
How large is the Asia Pacific operation intelligence market in 2026?
It is valued at USD 9.87 billion and is forecast to climb to USD 16.06 billion by 2031, reflecting a 10.19% CAGR.
Which deployment model is growing fastest?
Hybrid architectures are projected to expand at an 11.58% CAGR as firms balance cloud elasticity with data-sovereignty and latency needs.
Which application segment is set to grow most rapidly?
Energy-management analytics will advance at a 10.83% CAGR, spurred by carbon-pricing and disclosure mandates across Japan, Singapore, and Australia.
What is the principal restraint on adoption?
Integration complexity with legacy OT systems, especially on brownfield lines using proprietary field-bus protocols, remains the most significant hurdle.
Which country shows the highest growth momentum?
India is the fastest-growing market, underpinned by production-linked incentives that reward plants adopting digital-twin and real-time monitoring solutions.
Page last updated on:


