Market Overview
| Study Period | 2017 - 2030 |
| Base Year For Estimation | 2024 |
| Forecast Data Period | 2025 - 2030 |
| Market Size (2025) | USD 1.97 Billion |
| Market Size (2030) | USD 2.77 Billion |
| Growth Rate (2025 - 2030) | 7.06% CAGR |
| Market Concentration | Low |
Major Players*Disclaimer: Major Players sorted in no particular order Image © Mordor Intelligence. Reuse requires attribution under CC BY 4.0. |
|

Asia-Pacific Micronutrient Fertilizer Market Analysis
The Asia-Pacific Micronutrient Fertilizer Market size is estimated at 1.97 billion USD in 2025, and is expected to reach 2.77 billion USD by 2030, growing at a CAGR of 7.06% during the forecast period (2025-2030).
The Asia-Pacific micronutrient fertilizer industry is experiencing significant transformation driven by evolving agricultural practices and soil health concerns. Recent soil analysis data from the Centre for Science and Environment (CSE) reveals alarming deficiency levels in essential micronutrients, with boron deficiency at 47%, iron at 37%, and zinc at 39% in major agricultural regions. These deficiencies are particularly pronounced in volcanic, acidic, and calcareous soils, affecting crucial crops like peanuts, soybeans, papaya, and citrus. The situation has prompted agricultural institutions and government bodies to implement comprehensive soil health monitoring programs and establish guidelines for micronutrient fertilizer application.
Water management and irrigation practices are playing an increasingly crucial role in micronutrient delivery and absorption. Current data indicates that approximately 80% of freshwater usage in major agricultural markets is dedicated to farming activities, with about 49% of the total cultivated area now under irrigation systems. The adoption of advanced irrigation technologies, particularly micro-irrigation systems, has revolutionized the application of trace element fertilizer, enabling more precise and efficient nutrient delivery. Modern fertigation techniques are being integrated with traditional farming practices to optimize nutrient uptake and minimize waste.
Technological advancements in fertilizer formulations and application methods are reshaping the industry landscape. The Food and Fertilizer Technology Centre for the Asian and Pacific Region has established new application guidelines, recommending specific concentrations such as 0.5% iron sulfate and 0.1% copper sulfate for foliar application to effectively address deficiency symptoms. These precise recommendations have led to the development of more sophisticated micronutrient fertilizer products, including chelated forms and specialty blends designed for specific crop requirements and soil conditions. Agricultural technology companies are investing in research to develop enhanced formulations that offer better nutrient absorption and utilization efficiency.
Regulatory frameworks and environmental considerations are significantly influencing market dynamics. Several governments have implemented stricter regulations on fertilizer usage and composition, focusing on environmental protection and sustainable agriculture practices. For instance, the introduction of the "Action Plan for the Zero Increase of Fertilizer Use" in China demonstrates the growing emphasis on optimizing nutrient application rather than increasing volume. This regulatory environment has spurred innovation in the industry, leading to the development of eco-friendly formulations and precision agriculture solutions that minimize environmental impact while maintaining agricultural productivity. The increasing demand for trace element fertilizer is also driving this innovation, as farmers seek to improve crop yields sustainably.
Asia-Pacific Micronutrient Fertilizer Market Trends
The significant expansion in the cultivation of major growing crops is anticipated to boost the growth of the fertilizers market
- Field crop cultivation dominates the Asia-Pacific region, accounting for more than 95% of the total crop area. Rice, wheat, and corn are the major field crops produced in the region, together accounting for about 38% of the total crop area in 2022. The rising area under cultivation is expected to increase the need for fertilizer usage in the country.
- The Asia-Pacific region, which include China, India, Pakistan, and Australia, is among the world's largest wheat producers. China and India are also the world's largest wheat producers and consumers. Wheat is one of the major staple foods of this region, driving the increase increase in demand and consumption. Notably, the area under wheat cultivation increased by 638.6 thousand ha from 2018 to 2022. In 2022, China accounted for the production of 138 million metric tons of wheat, making it the largest wheat producer in the world, and India recorded wheat production of 103 million metric tons.
- Rice is the largest cultivated field crop in the region. Its cultivation alone accounted for about 16.44% of the total agricultural land in 2022. Rice is the staple food of Asia and most parts of the Pacific region. China was projected to produce 147 million tons of rice, and India was expected to harvest 124 million tons of rice in 2022. India was also expected to consume 109 million tons while exporting a world-leading 19.5 million tons.
- The surge in both domestic and international demand for field crops has prompted an expansion in the cultivation area dedicated to these crops. This significant increase in cultivated land is expected to have a direct and positive impact on the Asia-Pacific fertilizer market throughout the 2023-2030 period.

Understand The Key Trends Shaping This Market
Download PDF
Rapeseed/canola accounted for the highest average nutrient application rate of 9.2 kg/hectare in 2022
- The demand for micronutrients has grown in recent years due to the accelerated rates of nutrient removal in high-yielding crops. Micronutrient deficiency is widespread in Asia-Pacific, which is one of the major regions affected by this deficiency. Zinc, manganese, and copper are estimated to be the major types of nutrients applied largely for field crops, accounting for 12 kg/hectare, 9.1 kg/hectare, and 7.2 kg/hectare, respectively, in 2022.
- The lack of awareness about the benefits of using micronutrient fertilizers among the farming community in developing countries and the high cost associated with the purchase of these fertilizers are some of the factors limiting the growth of micronutrient fertilizers in the region.
- By crop type, rapeseed/canola accounted for the highest average nutrient application rate of 9.2 kg/hectare in 2022, followed by corn/maize and rice, accounting for 6.7 kg/hectare and 5.4 kg/hectare, respectively. The impact of specific micronutrients differs among crops and across the region. For instance, in the case of wheat, the major micronutrient deficiencies are copper and manganese. In countries like China, India, and Japan, boron and molybdenum are identified as deficient in wheat. Similarly, in rapeseed/canola, the major deficiencies are zinc, manganese, and copper.
- As farmers aim to get more out of every planted hectare, the popularity of micronutrients in the production of crops has increased rapidly in the recent past. High micronutrient deficiency and increasing demand for crops have encouraged farmers to adopt more micronutrients to increase soil health and enhance crop productivity.

OTHER KEY INDUSTRY TRENDS COVERED IN THE REPORT
- The growing demand for fruits and vegetables is driving the expansion of horticulture cultivation area in Asia-Pacific
- India possesses one of the most expansive irrigated regions, relying on a comprehensive infrastructure of canals, reservoirs, and tube wells to bolster its diverse agricultural sector
- The deficiency of boron, zinc, manganese, and molybdenum is extremely common in cruciferous vegetables
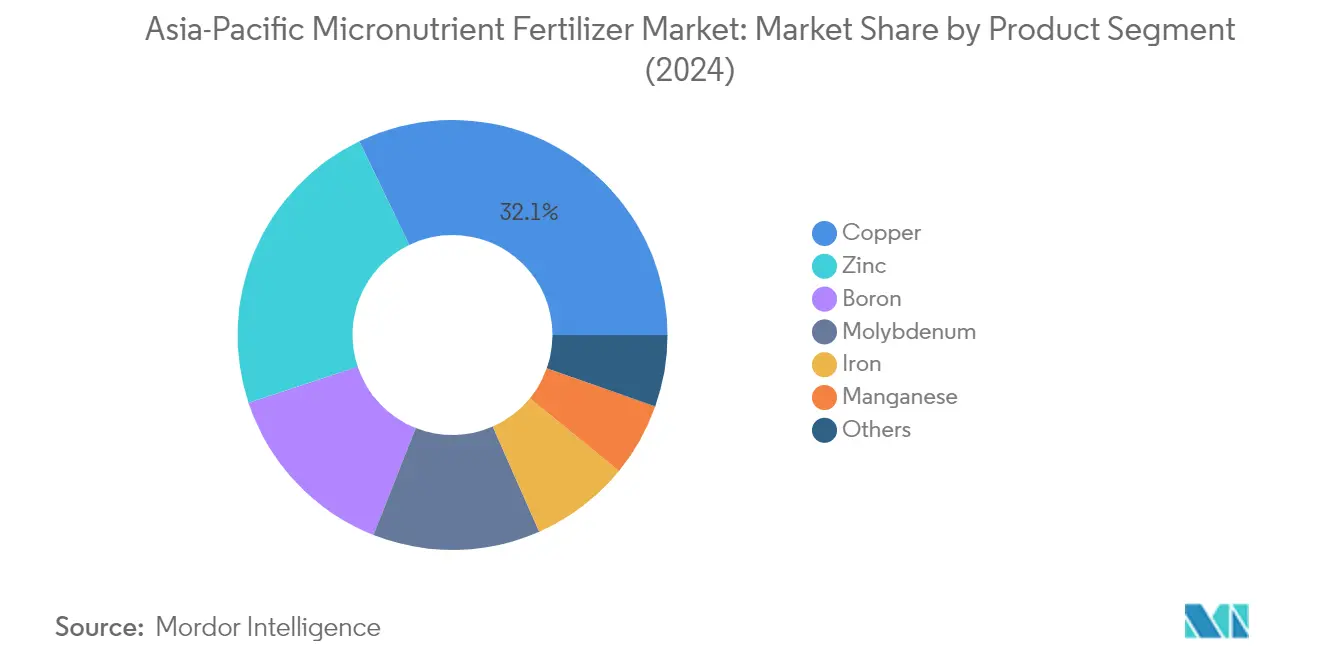
Segment Analysis: Product
Copper Segment in Asia-Pacific Micronutrient Fertilizer Market
Copper emerges as the dominant segment in the Asia-Pacific micronutrient fertilizer market, commanding approximately 32% market share in 2024. This significant market position can be attributed to copper's critical role as a catalyst in crucial plant reactions during growth stages and its essential function in protein formation. The conventional copper fertilizers constitute about 56% of the market, while specialty copper fertilizers make up the remaining portion, with copper sulfate being the preferred source due to its cost-effectiveness and widespread market availability. Field crops represent the primary consumers of copper micronutrient fertilizers, accounting for nearly 75% of the total copper fertilizer consumption, followed by horticultural crops at around 25%.
Boron Segment in Asia-Pacific Micronutrient Fertilizer Market
The boron segment demonstrates remarkable growth potential in the Asia-Pacific micronutrient fertilizer market, projected to expand at approximately 8% CAGR during 2024-2029. This robust growth trajectory is primarily driven by the region's soil characteristics, particularly in areas with reduced water content and higher nitrogen levels that limit boron uptake by plants. The increasing adoption of boron fertilizers is further supported by its crucial role in plant root development and its ability to facilitate potassium uptake through root enzyme activation. The segment's growth is also bolstered by the rising awareness among farmers about boron's importance in quality food production and enhanced productivity on infertile soils.
Remaining Segments in Product Segmentation
The other significant segments in the Asia-Pacific micronutrient fertilizer market include zinc, iron, manganese, and molybdenum, each serving distinct agricultural needs. Zinc plays a vital role in plant growth and development, particularly in enzyme production and stem elongation. Iron serves as a crucial catalyst in chlorophyll formation and contains numerous enzymes essential for plant growth. Manganese contributes significantly to photosynthesis and chlorophyll formation, while molybdenum proves particularly valuable for nitrogen fixation in leguminous crops. These segments collectively form a comprehensive micronutrient portfolio, addressing various crop-specific deficiencies and soil conditions across the region.
Segment Analysis: Application Mode
Soil Application Segment in Asia-Pacific Micronutrient Fertilizer Market
Soil application continues to dominate the Asia-Pacific micronutrient fertilizer market, commanding approximately 96% of the total market value in 2024. This overwhelming market share can be attributed to the widespread use of conventional fertilizers, which are exclusively applied through soil application methods. The segment's dominance is particularly evident in field crops, where boron, zinc, and iron are the most commonly applied micronutrients through soil application. The preference for soil application stems from its cost-effectiveness, established application infrastructure, and farmers' familiarity with traditional application methods. Additionally, the emergence of advanced specialty fertilizers, including controlled-release (CRF) and slow-release (SRF) variants, has further strengthened the soil application approach by offering gradual nutrient release over extended periods, ensuring consistent crop nutrition while minimizing nutrient losses.
Fertigation Segment in Asia-Pacific Micronutrient Fertilizer Market
The fertigation segment is emerging as the fastest-growing application method in the Asia-Pacific micronutrient fertilizer market, with an expected growth rate of approximately 8% during 2024-2029. This growth is primarily driven by the increasing adoption of micro-irrigation systems and the rising popularity of water-soluble fertilizers in the region. Fertigation's efficiency in delivering nutrients directly to the root zone, coupled with its ability to ensure uniform nutrient distribution and minimize nutrient losses, makes it particularly attractive for modern agricultural practices. The segment's growth is further supported by the expanding use of liquid fertilizers, which account for about 51% of specialty fertilizer applications through fertigation, as they dissolve quickly and prevent clogging in drip systems. The method's compatibility with both water-soluble and liquid variants of specialty micronutrient fertilizers positions it favorably for continued growth in the forecast period.
Remaining Segments in Application Mode
The foliar application segment represents a crucial component of the Asia-Pacific micronutrient fertilizer market, offering unique advantages in addressing immediate nutrient deficiencies in crops. This method is particularly effective for delivering micronutrients directly to plant tissues, making it invaluable for correcting nutrient deficiencies during critical growth stages. Foliar application has gained significant traction in horticultural crops, where it enhances fruit quality and size. The method's popularity is further enhanced by its efficiency in delivering nutrients when soil conditions limit nutrient uptake through roots. Liquid micronutrients dominate the foliar application segment, as they provide superior coverage and absorption compared to other formulations, making this method particularly effective for addressing acute nutrient deficiencies in high-value crops.
Segment Analysis: Crop Type
Field Crops Segment in Asia-Pacific Micronutrient Fertilizer Market
Field crops maintain their dominance in the Asia-Pacific micronutrient fertilizer market, commanding approximately 84% of the total market value in 2024. This substantial market share is primarily driven by the extensive cultivation of staple crops across the region, with the area dedicated to field crops projected to reach 651.5 million hectares by 2030. The segment's prominence is further reinforced by the expanding cultivation of high fertilizer-consuming crops such as wheat, cotton, paddy, sugarcane, and maize. Within the field crop segment, specialty micronutrient fertilizers hold a slightly larger market share compared to conventional fertilizers, with zinc emerging as the most crucial micronutrient, accounting for about 26% of the market volume. The segment's growth is particularly notable in countries like China and India, where intensive farming practices and the need to address widespread micronutrient deficiencies in soil continue to drive demand.
Turf & Ornamental Segment in Asia-Pacific Micronutrient Fertilizer Market
The turf and ornamental segment is experiencing the most rapid growth in the Asia-Pacific micronutrient fertilizer market, with an expected growth rate of approximately 9% during the forecast period. This accelerated growth is primarily attributed to the rising number of gardens, golf courses, and the expanding tourism sector across the region. The segment's growth is particularly driven by the increasing demand for indoor aesthetic plants, home gardens, and the flourishing nursery sector. Iron, manganese, and zinc deficiencies are commonly observed in this segment, leading to increased adoption of trace element fertilizers. The segment's expansion is further supported by the growing urbanization trend and rising disposable incomes, which have led to increased investment in landscaping and ornamental plant cultivation. Additionally, the development of specialized micronutrient formulations specifically designed for turf and ornamental applications has contributed to the segment's robust growth trajectory.
Remaining Segments in Crop Type
The horticultural crops segment represents a significant portion of the Asia-Pacific micronutrient fertilizer market, serving as a crucial bridge between field crops and turf/ornamental applications. This segment encompasses a wide range of fruits and vegetables, with particular emphasis on crops like citrus, mangoes, and grapes that have high micronutrient requirements. The segment has gained increased attention due to the rising consumer awareness about food quality and nutritional value, especially in the post-pandemic era. The adoption of advanced farming techniques, including precision agriculture and protected cultivation, has further enhanced the importance of micronutrient applications in horticultural crops. The segment also benefits from the growing trend of vertical farming and urban agriculture, where optimal nutrient management is crucial for achieving higher yields in limited spaces.
Asia-Pacific Micronutrient Fertilizer Market Geography Segment Analysis
Micronutrient Fertilizer Market in India
India dominates the Asia-Pacific micronutrient fertilizer market, commanding approximately 41% market share in 2024. The country's prominence in the market stems from its widespread adoption of intensive and modern cropping practices with high-yielding cultivars. The Centre for Science and Environment (CSE) has identified significant soil deficiencies in boron (47%), iron (37%), and zinc (39%), driving the demand for micronutrient fertilizer supplementation. The agricultural sector's shift toward balanced nutrition farming practices and expanding field crop acreage has further catalyzed market growth. Field crops, particularly cereals and pulses, constitute the primary application segment, accounting for nearly 95% of micronutrient fertilizer consumption. The current nutrient subsidy structure heavily subsidizes primary fertilizer nutrients, which has created a unique market dynamic influencing the adoption patterns of micronutrient fertilizers. Despite these challenges, the implementation of the Integrated Plant Nutrition Management (IPNM) Bill 2023 has introduced new regulatory frameworks that are reshaping the micro-fertilizer sector.
Micronutrient Fertilizer Market in Australia
Australia's micronutrient fertilizer market is projected to demonstrate robust growth, with an expected CAGR of approximately 9% from 2024 to 2029. The market's expansion is primarily driven by increasing awareness among farmers about micronutrient deficiencies in soils and their impact on crop health and yields. Boron deficiency is particularly prevalent along Australia's west coast, where soils tend to be dry, sandy, or volcanic, making it the second most utilized micronutrient in the country. The market has witnessed a significant shift toward advanced specialty fertilizers, especially in addressing iron deficiency chlorosis, which affects crop health by limiting chlorophyll production. The country's agricultural sector has shown increasing sophistication in nutrient management practices, with farmers adopting more precise application methods and timing strategies. The integration of smart farming technologies has enabled more efficient micronutrient application, while the growing focus on sustainable agriculture has promoted the use of enhanced efficiency fertilizers. The market has also benefited from strong research and development initiatives, leading to the introduction of innovative micronutrient formulations tailored to Australian soil conditions.
Micronutrient Fertilizer Market in China
China's micronutrient fertilizer market demonstrates unique characteristics shaped by its diverse agricultural landscape and specific soil challenges. Nearly half of China's arable soils face zinc deficiency issues, significantly impacting agricultural production and crop yields. The country has implemented strategic initiatives to address these deficiencies, particularly in northern regions where aerobic and calcareous soils predominate. Iron deficiency has emerged as a critical concern, especially affecting field crops in these areas. The government's "Action Plan for the Zero Increase of Fertilizer Use" has introduced new dynamics in the market, promoting more efficient and targeted use of micronutrients. The market structure shows a strong preference for conventional fertilizers, though there's a growing trend toward specialty products, particularly in the horticultural sector. The country's vast agricultural research network continues to drive innovations in micronutrient delivery systems, while the expansion of precision farming practices has enhanced the efficiency of micronutrient applications.
Micronutrient Fertilizer Market in Indonesia
Indonesia's micronutrient fertilizer market exhibits distinctive characteristics influenced by its tropical agricultural conditions and diverse crop portfolio. The country's upland soils, including alluvial soils, Regosols, Lithosols, and Aridisols, show significant zinc deficiency patterns, particularly in West Java's key agricultural regions. The market demonstrates a strong preference for conventional copper fertilizers, driven by their cost-effectiveness and widespread availability compared to chelated alternatives. The agricultural sector's focus on quality food production has spurred increased adoption of micronutrient fertilizers, particularly in regions practicing intensive farming. The government's agricultural development programs have emphasized the importance of balanced nutrient management, leading to greater awareness about micronutrient applications. The market has also witnessed evolution in application methods, with foliar feeding gaining prominence, especially in horticultural crops. The country's extensive network of agricultural extension services has played a crucial role in educating farmers about the benefits of micronutrient supplementation.
Micronutrient Fertilizer Market in Other Countries
The micronutrient fertilizer market in other Asia-Pacific countries presents a diverse landscape with varying adoption patterns and growth trajectories. Countries like Japan, Pakistan, the Philippines, Thailand, and Vietnam each demonstrate unique market characteristics influenced by their specific agricultural practices and soil conditions. Japan's market shows a strong inclination toward specialty fertilizers, particularly in the horticultural sector, while Pakistan's market is driven by the need to address widespread nutrient deficiencies in its agricultural soils, highlighting the importance of micronutrients fertilizer in Pakistan. The Philippines has focused on enhancing the nutritional quality of its staple crops through micronutrient supplementation, while Thailand's market is shaped by its intensive rice cultivation practices. Vietnam's market demonstrates growing sophistication in micronutrient application technologies, particularly in its key agricultural regions. These markets collectively contribute to the region's dynamic micronutrient fertilizer landscape, each addressing specific agricultural challenges while adapting to evolving farming practices and environmental considerations.
Get Analysis on Important Geographic Markets
Download PDF
Asia-Pacific Micronutrient Fertilizer Industry Overview
Top Companies in Asia-Pacific Micronutrient Fertilizer Market
The competitive landscape is characterized by major players like Yara International ASA, Chambal Fertilizers & Chemicals Ltd, Zuari Agro Chemicals Ltd, and Coromandel International Ltd actively pursuing innovation and expansion strategies. Companies are increasingly focusing on developing specialized micronutrient fertilizer formulations tailored for specific crops and soil conditions, with a notable trend toward water-soluble and chelated products. Strategic partnerships with agricultural research institutions and local distributors have become crucial for market penetration and product development. Operational agility is demonstrated through investments in smart farming technologies and digital platforms for providing crop-specific recommendations. Companies are also expanding their manufacturing capabilities and distribution networks, particularly in emerging agricultural markets, while simultaneously strengthening their research and development capabilities to address evolving farmer needs.
Market Dominated by Regional Agricultural Conglomerates
The Asia-Pacific micronutrient fertilizer market exhibits a fragmented structure with a mix of global agricultural input companies and regional specialists. Large agricultural conglomerates with diversified product portfolios dominate the market, leveraging their established distribution networks and brand recognition. These companies typically maintain integrated operations spanning production, formulation, and distribution, while also offering complementary agricultural products and services. The market is characterized by strong regional players who have a deep understanding of local agricultural practices and maintain close relationships with farming communities.
The competitive dynamics are shaped by the presence of both multinational corporations and domestic players, with local companies having significant market share in their respective regions. Market consolidation is primarily driven by established players acquiring regional companies to expand their geographical presence and product portfolio. Strategic alliances between international and local players are becoming increasingly common, combining global technical expertise with local market knowledge. The industry also witnesses vertical integration strategies, with companies expanding across the value chain to ensure supply security and maintain quality control.
Innovation and Distribution Network Drive Success
Success in the market increasingly depends on companies' ability to develop innovative micronutrient fertilizer solutions that address specific regional soil deficiencies and crop requirements. Incumbents are focusing on strengthening their research capabilities, developing precision agriculture solutions, and expanding their product portfolio to include specialty micronutrient formulations. Building strong relationships with agricultural extension services and farmer communities has become crucial for market penetration. Companies are also investing in educational initiatives to increase awareness about micronutrient deficiencies and their impact on crop yields.
For contenders looking to gain market share, developing cost-effective solutions while maintaining product quality is essential. Success factors include establishing efficient distribution networks, providing technical support to farmers, and offering customized solutions for different agro-climatic zones. Companies need to navigate complex regulatory environments across different countries while maintaining compliance with environmental standards. The ability to provide integrated nutrient management solutions, combined with digital farming technologies, will be crucial for future growth. Building strategic partnerships with local agricultural institutions and farmer cooperatives can help in overcoming market entry barriers and establishing brand presence. Additionally, understanding the Coromandel price dynamics can offer competitive advantages in pricing strategies.
Asia-Pacific Micronutrient Fertilizer Market Leaders
-
Chambal Fertilizers & Chemicals Ltd
-
Coromandel International Ltd.
-
Indian Farmers Fertiliser Cooperative Limited
-
Yara International ASA
-
Zuari Agro Chemicals Ltd
- *Disclaimer: Major Players sorted in no particular order

Need More Details on Market Players and Competitors?
Download PDF
Asia-Pacific Micronutrient Fertilizer Market News
- November 2019: IFFCO Launches its Nano Technology based Products nano nitrogen, nano zinc and nano copper for on- field trials as part of its efforts to cut United Statesge of chemical fertilisers and boost farmers' income.
- February 2019: Haifa Group announced the opening of a new trading company in China. The establishment of the new Haifa subsidiary in China will enable the group to significantly expand its offerings to China agriculture sector.
- February 2019: Coromandel International announced a strategic partnership with Agrinos. The partnership allows Coromandel to widen its product offerings of complete plant nutrition solutions, organic fertilizers, and specialty nutrients. Coromandel, in partnership with Agrinos, will offer growers high-technology inputs under the brand name ARITHRI.
Free With This Report
Along with the report, We also offer a comprehensive and exhaustive data pack with 25+ graphs on area under cultivation and average application rate per hectare. The data pack includes Globe, North America, Europe, Asia-Pacific, South America, and Africa.


List of Tables & Figures
- Figure 1:
- CULTIVATION OF FIELD CROPS IN HECTARE, ASIA-PACIFIC, 2017 - 2022
- Figure 2:
- CULTIVATION OF HORTICULTURAL CROPS IN HECTARE, ASIA-PACIFIC, 2017 - 2022
- Figure 3:
- CONSUMPTION OF MICRONUTRIENTS BY FIELD CROPS IN KG/HECTARE, ASIA-PACIFIC, 2022
- Figure 4:
- CONSUMPTION OF MICRONUTRIENTS BY HORTICULTURAL CROPS IN KG/HECTARE, ASIA-PACIFIC, 2022
- Figure 5:
- AGRICULTURAL LAND EQUIPPED FOR IRRIGATION IN HECTARE, ASIA-PACIFIC, 2022
- Figure 6:
- MICRONUTRIENTS FERTILIZER CONSUMPTION IN METRIC TON, ASIA-PACIFIC, 2017 - 2030
- Figure 7:
- MICRONUTRIENTS FERTILIZER CONSUMPTION IN USD, ASIA-PACIFIC, 2017 - 2030
- Figure 8:
- MICRONUTRIENTS FERTILIZER CONSUMPTION BY PRODUCT IN METRIC TON, ASIA-PACIFIC, 2017 - 2030
- Figure 9:
- MICRONUTRIENTS FERTILIZER CONSUMPTION BY PRODUCT IN USD, ASIA-PACIFIC, 2017 - 2030
- Figure 10:
- MICRONUTRIENTS FERTILIZER CONSUMPTION VOLUME BY PRODUCT IN %, ASIA-PACIFIC, 2017 VS 2023 VS 2030
- Figure 11:
- MICRONUTRIENTS FERTILIZER CONSUMPTION VALUE BY PRODUCT IN %, ASIA-PACIFIC, 2017 VS 2023 VS 2030
- Figure 12:
- BORON FERTILIZER CONSUMPTION IN METRIC TON, ASIA-PACIFIC, 2017 - 2030
- Figure 13:
- BORON FERTILIZER CONSUMPTION IN USD, ASIA-PACIFIC, 2017 - 2030
- Figure 14:
- BORON FERTILIZER CONSUMPTION VALUE BY CROP TYPE IN %, ASIA-PACIFIC, 2023 VS 2030
- Figure 15:
- COPPER FERTILIZER CONSUMPTION IN METRIC TON, ASIA-PACIFIC, 2017 - 2030
- Figure 16:
- COPPER FERTILIZER CONSUMPTION IN USD, ASIA-PACIFIC, 2017 - 2030
- Figure 17:
- COPPER FERTILIZER CONSUMPTION VALUE BY CROP TYPE IN %, ASIA-PACIFIC, 2023 VS 2030
- Figure 18:
- IRON FERTILIZER CONSUMPTION IN METRIC TON, ASIA-PACIFIC, 2017 - 2030
- Figure 19:
- IRON FERTILIZER CONSUMPTION IN USD, ASIA-PACIFIC, 2017 - 2030
- Figure 20:
- IRON FERTILIZER CONSUMPTION VALUE BY CROP TYPE IN %, ASIA-PACIFIC, 2023 VS 2030
- Figure 21:
- MANGANESE FERTILIZER CONSUMPTION IN METRIC TON, ASIA-PACIFIC, 2017 - 2030
- Figure 22:
- MANGANESE FERTILIZER CONSUMPTION IN USD, ASIA-PACIFIC, 2017 - 2030
- Figure 23:
- MANGANESE FERTILIZER CONSUMPTION VALUE BY CROP TYPE IN %, ASIA-PACIFIC, 2023 VS 2030
- Figure 24:
- MOLYBDENUM FERTILIZER CONSUMPTION IN METRIC TON, ASIA-PACIFIC, 2017 - 2030
- Figure 25:
- MOLYBDENUM FERTILIZER CONSUMPTION IN USD, ASIA-PACIFIC, 2017 - 2030
- Figure 26:
- MOLYBDENUM FERTILIZER CONSUMPTION VALUE BY CROP TYPE IN %, ASIA-PACIFIC, 2023 VS 2030
- Figure 27:
- ZINC FERTILIZER CONSUMPTION IN METRIC TON, ASIA-PACIFIC, 2017 - 2030
- Figure 28:
- ZINC FERTILIZER CONSUMPTION IN USD, ASIA-PACIFIC, 2017 - 2030
- Figure 29:
- ZINC FERTILIZER CONSUMPTION VALUE BY CROP TYPE IN %, ASIA-PACIFIC, 2023 VS 2030
- Figure 30:
- OTHERS FERTILIZER CONSUMPTION IN METRIC TON, ASIA-PACIFIC, 2017 - 2030
- Figure 31:
- OTHERS FERTILIZER CONSUMPTION IN USD, ASIA-PACIFIC, 2017 - 2030
- Figure 32:
- OTHERS FERTILIZER CONSUMPTION VALUE BY CROP TYPE IN %, ASIA-PACIFIC, 2023 VS 2030
- Figure 33:
- MICRONUTRIENTS MICRONUTRIENTS FERTILIZER CONSUMPTION BY APPLICATION MODE IN METRIC TON, ASIA-PACIFIC, 2017 - 2030
- Figure 34:
- MICRONUTRIENTS MICRONUTRIENTS FERTILIZER CONSUMPTION BY APPLICATION MODE IN USD, ASIA-PACIFIC, 2017 - 2030
- Figure 35:
- MICRONUTRIENTS MICRONUTRIENTS FERTILIZER CONSUMPTION VOLUME BY APPLICATION MODE IN %, ASIA-PACIFIC, 2017 VS 2023 VS 2030
- Figure 36:
- MICRONUTRIENTS MICRONUTRIENTS FERTILIZER CONSUMPTION VALUE BY APPLICATION MODE IN %, ASIA-PACIFIC, 2017 VS 2023 VS 2030
- Figure 37:
- FERTIGATION APPLICATION OF MICRONUTRIENTS FERTILIZER IN METRIC TON, ASIA-PACIFIC, 2017 - 2030
- Figure 38:
- FERTIGATION APPLICATION OF MICRONUTRIENTS FERTILIZER IN USD, ASIA-PACIFIC, 2017 - 2030
- Figure 39:
- FERTIGATION APPLICATION OF MICRONUTRIENTS FERTILIZER IN VALUE BY CROP TYPE IN %, ASIA-PACIFIC, 2023 VS 2030
- Figure 40:
- FOLIAR APPLICATION OF MICRONUTRIENTS FERTILIZER IN METRIC TON, ASIA-PACIFIC, 2017 - 2030
- Figure 41:
- FOLIAR APPLICATION OF MICRONUTRIENTS FERTILIZER IN USD, ASIA-PACIFIC, 2017 - 2030
- Figure 42:
- FOLIAR APPLICATION OF MICRONUTRIENTS FERTILIZER IN VALUE BY CROP TYPE IN %, ASIA-PACIFIC, 2023 VS 2030
- Figure 43:
- SOIL APPLICATION OF MICRONUTRIENTS FERTILIZER IN METRIC TON, ASIA-PACIFIC, 2017 - 2030
- Figure 44:
- SOIL APPLICATION OF MICRONUTRIENTS FERTILIZER IN USD, ASIA-PACIFIC, 2017 - 2030
- Figure 45:
- SOIL APPLICATION OF MICRONUTRIENTS FERTILIZER IN VALUE BY CROP TYPE IN %, ASIA-PACIFIC, 2023 VS 2030
- Figure 46:
- MICRONUTRIENTS MICRONUTRIENTS FERTILIZER CONSUMPTION BY CROP TYPE IN METRIC TON, ASIA-PACIFIC, 2017 - 2030
- Figure 47:
- MICRONUTRIENTS MICRONUTRIENTS FERTILIZER CONSUMPTION BY CROP TYPE IN USD, ASIA-PACIFIC, 2017 - 2030
- Figure 48:
- MICRONUTRIENTS MICRONUTRIENTS FERTILIZER CONSUMPTION VOLUME BY CROP TYPE IN %, ASIA-PACIFIC, 2017 VS 2023 VS 2030
- Figure 49:
- MICRONUTRIENTS MICRONUTRIENTS FERTILIZER CONSUMPTION VALUE BY CROP TYPE IN %, ASIA-PACIFIC, 2017 VS 2023 VS 2030
- Figure 50:
- MICRONUTRIENTS FERTILIZER CONSUMPTION BY FIELD CROPS IN METRIC TON, ASIA-PACIFIC, 2017 - 2030
- Figure 51:
- MICRONUTRIENTS FERTILIZER CONSUMPTION BY FIELD CROPS IN USD, ASIA-PACIFIC, 2017 - 2030
- Figure 52:
- MICRONUTRIENTS FERTILIZER CONSUMPTION VALUE BY PRODUCT IN %, ASIA-PACIFIC, 2023 VS 2030
- Figure 53:
- MICRONUTRIENTS FERTILIZER CONSUMPTION BY HORTICULTURAL CROPS IN METRIC TON, ASIA-PACIFIC, 2017 - 2030
- Figure 54:
- MICRONUTRIENTS FERTILIZER CONSUMPTION BY HORTICULTURAL CROPS IN USD, ASIA-PACIFIC, 2017 - 2030
- Figure 55:
- MICRONUTRIENTS FERTILIZER CONSUMPTION VALUE BY PRODUCT IN %, ASIA-PACIFIC, 2023 VS 2030
- Figure 56:
- MICRONUTRIENTS FERTILIZER CONSUMPTION BY TURF & ORNAMENTAL IN METRIC TON, ASIA-PACIFIC, 2017 - 2030
- Figure 57:
- MICRONUTRIENTS FERTILIZER CONSUMPTION BY TURF & ORNAMENTAL IN USD, ASIA-PACIFIC, 2017 - 2030
- Figure 58:
- MICRONUTRIENTS FERTILIZER CONSUMPTION VALUE BY PRODUCT IN %, ASIA-PACIFIC, 2023 VS 2030
- Figure 59:
- MICRONUTRIENTS MICRONUTRIENTS FERTILIZER CONSUMPTION BY COUNTRY IN METRIC TON, ASIA-PACIFIC, 2017 - 2030
- Figure 60:
- MICRONUTRIENTS MICRONUTRIENTS FERTILIZER CONSUMPTION BY COUNTRY IN USD, ASIA-PACIFIC, 2017 - 2030
- Figure 61:
- MICRONUTRIENTS MICRONUTRIENTS FERTILIZER CONSUMPTION VOLUME BY COUNTRY IN %, ASIA-PACIFIC, 2017 VS 2023 VS 2030
- Figure 62:
- MICRONUTRIENTS MICRONUTRIENTS FERTILIZER CONSUMPTION VALUE BY COUNTRY IN %, ASIA-PACIFIC, 2017 VS 2023 VS 2030
- Figure 63:
- MICRONUTRIENTS FERTILIZER CONSUMPTION IN METRIC TON, AUSTRALIA, 2017 - 2030
- Figure 64:
- MICRONUTRIENTS FERTILIZER CONSUMPTION IN USD, AUSTRALIA, 2017 - 2030
- Figure 65:
- MICRONUTRIENTS FERTILIZER CONSUMPTION VALUE BY CROP TYPE IN %, AUSTRALIA, 2023 VS 2030
- Figure 66:
- MICRONUTRIENTS FERTILIZER CONSUMPTION IN METRIC TON, BANGLADESH, 2017 - 2030
- Figure 67:
- MICRONUTRIENTS FERTILIZER CONSUMPTION IN USD, BANGLADESH, 2017 - 2030
- Figure 68:
- MICRONUTRIENTS FERTILIZER CONSUMPTION VALUE BY CROP TYPE IN %, BANGLADESH, 2023 VS 2030
- Figure 69:
- MICRONUTRIENTS FERTILIZER CONSUMPTION IN METRIC TON, CHINA, 2017 - 2030
- Figure 70:
- MICRONUTRIENTS FERTILIZER CONSUMPTION IN USD, CHINA, 2017 - 2030
- Figure 71:
- MICRONUTRIENTS FERTILIZER CONSUMPTION VALUE BY CROP TYPE IN %, CHINA, 2023 VS 2030
- Figure 72:
- MICRONUTRIENTS FERTILIZER CONSUMPTION IN METRIC TON, INDIA, 2017 - 2030
- Figure 73:
- MICRONUTRIENTS FERTILIZER CONSUMPTION IN USD, INDIA, 2017 - 2030
- Figure 74:
- MICRONUTRIENTS FERTILIZER CONSUMPTION VALUE BY CROP TYPE IN %, INDIA, 2023 VS 2030
- Figure 75:
- MICRONUTRIENTS FERTILIZER CONSUMPTION IN METRIC TON, INDONESIA, 2017 - 2030
- Figure 76:
- MICRONUTRIENTS FERTILIZER CONSUMPTION IN USD, INDONESIA, 2017 - 2030
- Figure 77:
- MICRONUTRIENTS FERTILIZER CONSUMPTION VALUE BY CROP TYPE IN %, INDONESIA, 2023 VS 2030
- Figure 78:
- MICRONUTRIENTS FERTILIZER CONSUMPTION IN METRIC TON, JAPAN, 2017 - 2030
- Figure 79:
- MICRONUTRIENTS FERTILIZER CONSUMPTION IN USD, JAPAN, 2017 - 2030
- Figure 80:
- MICRONUTRIENTS FERTILIZER CONSUMPTION VALUE BY CROP TYPE IN %, JAPAN, 2023 VS 2030
- Figure 81:
- MICRONUTRIENTS FERTILIZER CONSUMPTION IN METRIC TON, PAKISTAN, 2017 - 2030
- Figure 82:
- MICRONUTRIENTS FERTILIZER CONSUMPTION IN USD, PAKISTAN, 2017 - 2030
- Figure 83:
- MICRONUTRIENTS FERTILIZER CONSUMPTION VALUE BY CROP TYPE IN %, PAKISTAN, 2023 VS 2030
- Figure 84:
- MICRONUTRIENTS FERTILIZER CONSUMPTION IN METRIC TON, PHILIPPINES, 2017 - 2030
- Figure 85:
- MICRONUTRIENTS FERTILIZER CONSUMPTION IN USD, PHILIPPINES, 2017 - 2030
- Figure 86:
- MICRONUTRIENTS FERTILIZER CONSUMPTION VALUE BY CROP TYPE IN %, PHILIPPINES, 2023 VS 2030
- Figure 87:
- MICRONUTRIENTS FERTILIZER CONSUMPTION IN METRIC TON, THAILAND, 2017 - 2030
- Figure 88:
- MICRONUTRIENTS FERTILIZER CONSUMPTION IN USD, THAILAND, 2017 - 2030
- Figure 89:
- MICRONUTRIENTS FERTILIZER CONSUMPTION VALUE BY CROP TYPE IN %, THAILAND, 2023 VS 2030
- Figure 90:
- MICRONUTRIENTS FERTILIZER CONSUMPTION IN METRIC TON, VIETNAM, 2017 - 2030
- Figure 91:
- MICRONUTRIENTS FERTILIZER CONSUMPTION IN USD, VIETNAM, 2017 - 2030
- Figure 92:
- MICRONUTRIENTS FERTILIZER CONSUMPTION VALUE BY CROP TYPE IN %, VIETNAM, 2023 VS 2030
- Figure 93:
- MICRONUTRIENTS FERTILIZER CONSUMPTION IN METRIC TON, REST OF ASIA-PACIFIC, 2017 - 2030
- Figure 94:
- MICRONUTRIENTS FERTILIZER CONSUMPTION IN USD, REST OF ASIA-PACIFIC, 2017 - 2030
- Figure 95:
- MICRONUTRIENTS FERTILIZER CONSUMPTION VALUE BY CROP TYPE IN %, REST OF ASIA-PACIFIC, 2023 VS 2030
- Figure 96:
- MOST ACTIVE COMPANIES BY NUMBER OF STRATEGIC MOVES, ASIA-PACIFIC, 2017 - 2030
- Figure 97:
- ASIA-PACIFIC MICRONUTRIENT FERTILIZER MARKET, MOST ADOPTED STRATEGIES, 2018 - 2021
- Figure 98:
- MARKET SHARE OF MAJOR PLAYERS IN %, ASIA-PACIFIC
Asia-Pacific Micronutrient Fertilizer Industry Segmentation
Boron, Copper, Iron, Manganese, Molybdenum, Zinc, Others are covered as segments by Product. Fertigation, Foliar, Soil are covered as segments by Application Mode. Field Crops, Horticultural Crops, Turf & Ornamental are covered as segments by Crop Type. Australia, Bangladesh, China, India, Indonesia, Japan, Pakistan, Philippines, Thailand, Vietnam are covered as segments by Country.| Product | Boron |
| Copper | |
| Iron | |
| Manganese | |
| Molybdenum | |
| Zinc | |
| Others | |
| Application Mode | Fertigation |
| Foliar | |
| Soil | |
| Crop Type | Field Crops |
| Horticultural Crops | |
| Turf & Ornamental | |
| Country | Australia |
| Bangladesh | |
| China | |
| India | |
| Indonesia | |
| Japan | |
| Pakistan | |
| Philippines | |
| Thailand | |
| Vietnam | |
| Rest of Asia-Pacific |
Product
| Boron |
| Copper |
| Iron |
| Manganese |
| Molybdenum |
| Zinc |
| Others |
Application Mode
| Fertigation |
| Foliar |
| Soil |
Crop Type
| Field Crops |
| Horticultural Crops |
| Turf & Ornamental |
Country
| Australia |
| Bangladesh |
| China |
| India |
| Indonesia |
| Japan |
| Pakistan |
| Philippines |
| Thailand |
| Vietnam |
| Rest of Asia-Pacific |
Need A Different Region or Segment?
Customize Now
Market Definition
- MARKET ESTIMATION LEVEL - Market Estimations for various types of fertilizers has been done at the product-level and not at the nutrient-level.
- NUTRIENT TYPES COVERED - Micronutients: Zn, Mn, Cu, Fe, Mo, B, and Others
- AVERAGE NUTRIENT APPLICATION RATE - This refers to the average volume of nutrient consumed per hectare of farmland in each country.
- CROP TYPES COVERED - Field Crops: Cereals, Pulses, Oilseeds, and Fiber Crops Horticulture: Fruits, Vegetables, Plantation Crops and Spices, Turf Grass and Ornamentals
| Keyword | Definition |
|---|---|
| Fertilizer | Chemical substance applied to crops to ensure nutritional requirements, available in various forms such as granules, powders, liquid, water soluble, etc. |
| Specialty Fertilizer | Used for enhanced efficiency and nutrient availability applied through soil, foliar, and fertigation. Includes CRF, SRF, liquid fertilizer, and water soluble fertilizers. |
| Controlled-Release Fertilizers (CRF) | Coated with materials such as polymer, polymer-sulfur, and other materials such as resins to ensure nutrient availability to the crop for its entire life cycle. |
| Slow-Release Fertilizers (SRF) | Coated with materials such as sulfur, neem, etc., to ensure nutrient availability to the crop for a longer period. |
| Foliar Fertilizers | Consist of both liquid and water soluble fertilizers applied through foliar application. |
| Water-Soluble Fertilizers | Available in various forms including liquid, powder, etc., used in foliar and fertigation mode of fertilizer application. |
| Fertigation | Fertilizers applied through different irrigation systems such as drip irrigation, micro irrigation, sprinkler irrigation, etc. |
| Anhydrous Ammonia | Used as fertilizer, directly injected into the soil, available in gaseous liquid form. |
| Single Super Phosphate (SSP) | Phosphorus fertilizer containing only phosphorus which has lesser than or equal to 35%. |
| Triple Super Phosphate (TSP) | Phosphorus fertilizer containing only phosphorus greater than 35%. |
| Enhanced Efficiency Fertilizers | Fertilizers coated or treated with additional layers of various ingredients to make it more efficient compared to other fertilizers. |
| Conventional Fertilizer | Fertilizers applied to crops through traditional methods including broadcasting, row placement, ploughing soil placement, etc. |
| Chelated Micronutrients | Micronutrient fertilizers coated with chelating agents such as EDTA, EDDHA, DTPA, HEDTA, etc. |
| Liquid Fertilizers | Available in liquid form, majorly used for application of fertilizers to crops through foliar and fertigation. |
Need More Details on Market Definition?
Ask a Question
Research Methodology
Mordor Intelligence follows a four-step methodology in all our reports.
- Step-1: IDENTIFY KEY VARIABLES: In order to build a robust forecasting methodology, the variables and factors identified in Step-1 are tested against available historical market numbers. Through an iterative process, the variables required for market forecast are set and the model is built on the basis of these variables.
- Step-2: Build a Market Model: Market-size estimations for the forecast years are in nominal terms. Inflation is not a part of the pricing, and the average selling price (ASP) is kept constant throughout the forecast period for each country.
- Step-3: Validate and Finalize: In this important step, all market numbers, variables and analyst calls are validated through an extensive network of primary research experts from the market studied. The respondents are selected across levels and functions to generate a holistic picture of the market studied.
- Step-4: Research Outputs: Syndicated Reports, Custom Consulting Assignments, Databases & Subscription Platforms

Get More Details On Research Methodology
Download PDF


