
Market Overview
| Study Period | 2021 - 2031 |
|---|---|
| Forecast Data Period | 2026 - 2031 |
| Historical Data Period | 2021 - 2024 |
| Growth Rate | 10.58 % |
| Market Concentration | Low |
Major Players *Disclaimer: Major Players sorted in no particular order Image © Mordor Intelligence. Reuse requires attribution under CC BY 4.0. | |
Asia-Pacific Floating Production Systems Market Analysis by Mordor Intelligence
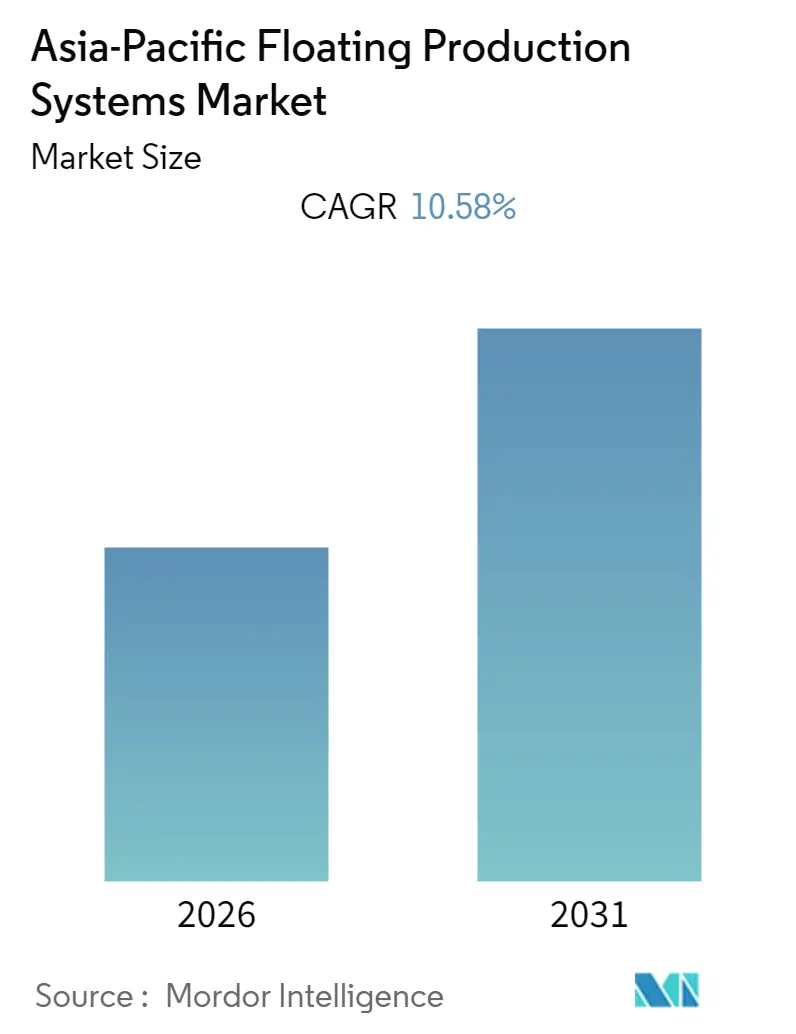
The Asia-Pacific Floating Production Systems Market size is expected to register a CAGR of 10.58% during the forecast period.
- Floating Production, Storage and Offloading (FPSO) make up the largest share of the floating production systems market, because of its additional function of storing produced oil. FPSO dominates the market with over 60% of the market share, and over 39 FPSO present in the region as of July 1, 2018.
- The demand for oil and gas production has always been on an increase, which has led to increased exploration activities offshore. This, in turn, is expected to help grow the market in the forecast period.
- China is anticipated to dominate the market due to widespread development and production from offshore fields in various regions like East China Sea, Western South China Sea, Eastern South China Sea, Bohai, etc.
Note: Market size and forecast figures in this report are generated using Mordor Intelligence’s proprietary estimation framework, updated with the latest available data and insights as of 2026.
Asia-Pacific Floating Production Systems Market Trends and Insights
Floating Production, Storage and Offloading (FPSO) to Dominate the Market
- FPSO are the most popular floating production system because of its additional feature of storing and offloading produced crude oil. This have led FPSO's to have over 60% of the market share which is expected to grow in the forecast period.
- FPSO provides the capability of long distances movement, which provides the operator a chance to using it over different regions and fields over its life.
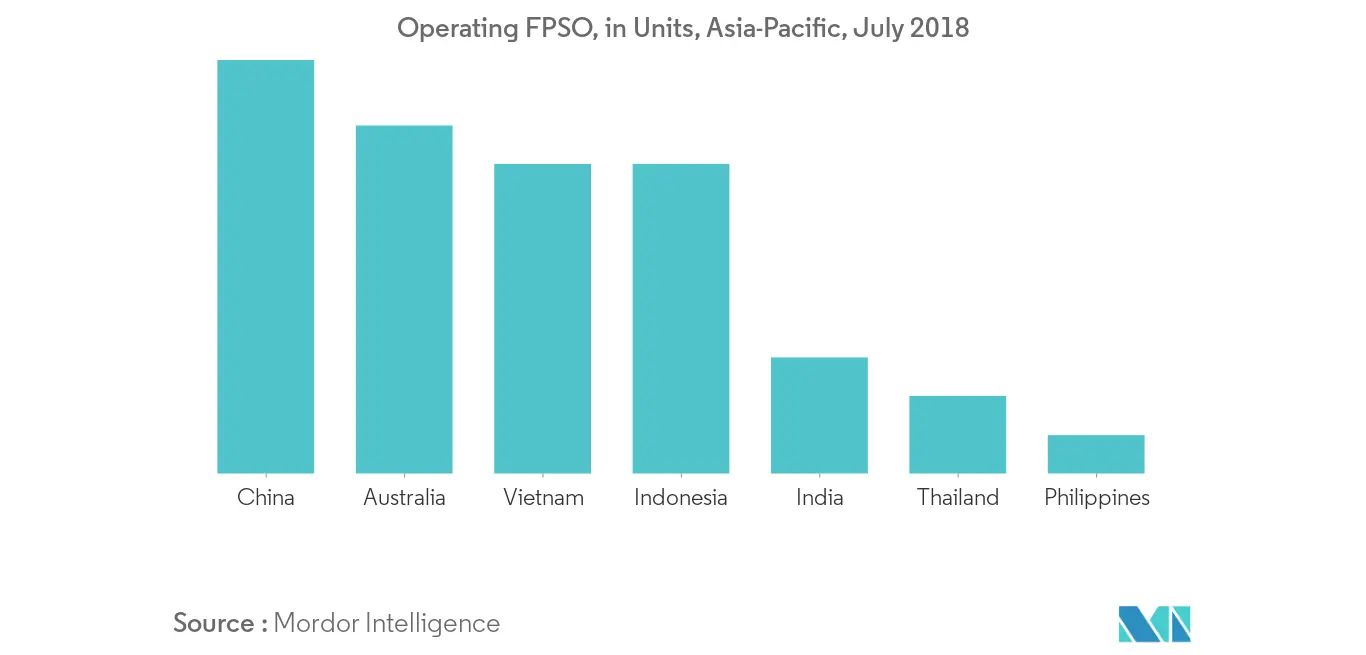
- China has 13 operating and 3 FPSO under construction as of July 1, 2018, which makes it the country with biggest FPSO fleet in the region, Australia comes in second place with 9 operating and 2 under construction FPSO.
- The increasing energy demand is expected to drive the floating production systems market during the coming decade, as the new exploration activity is at an all-time high and the operators are often forced to work in much deeper waters, which require sophisticated technology and equipment, and also need the capability of storage and offloading oil, thereby helping drive the FPSO market.
China to Dominate the Market
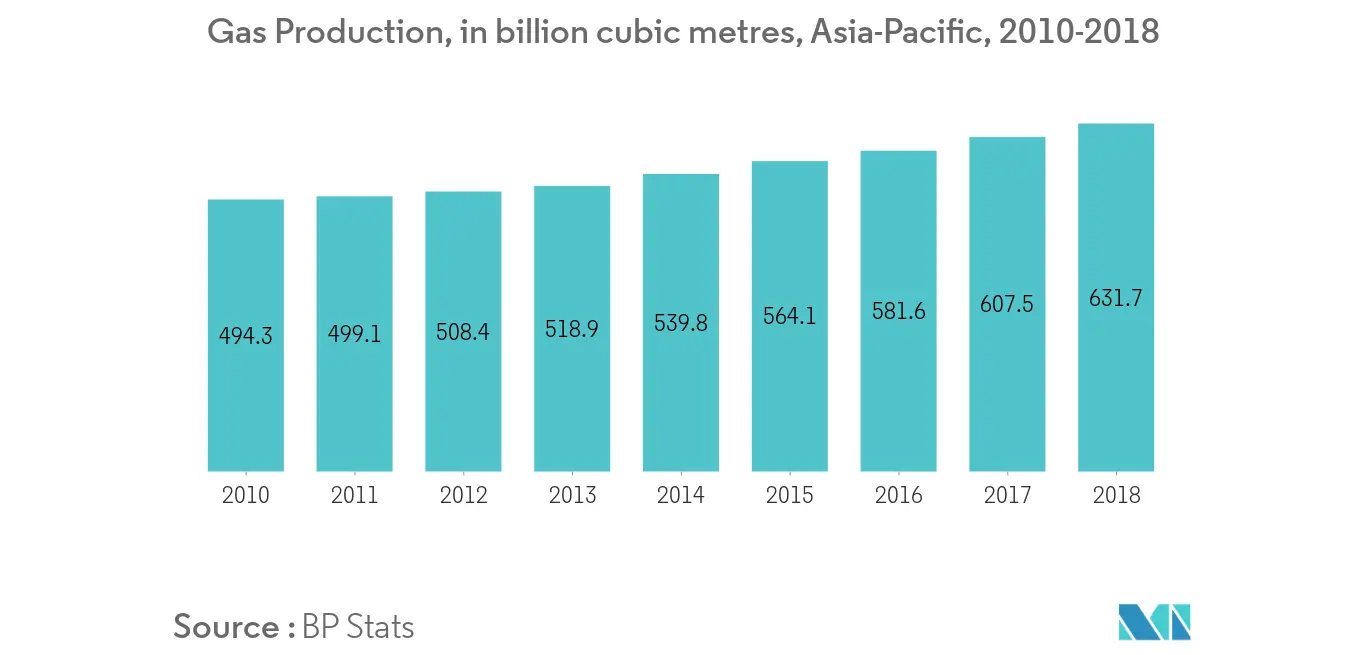
- China is expected to maintain its dominance in floating production system market in the region in forecast period. This is the same trend as has been seen in recent years, due to heavy investments by the country in offshore oil and gas fields.
- The offshore oil & gas industry is expected to witness massive investments between 2020-2025. China National Offshore Oil Corporation (CNOOC) invested USD 11.46 billion in 2019 and is expected to invest somewhere between USD 12.34 billion to USD 13.79 billion in 2020.
- CNOOC has estimated oil production from offshore fields to be well above 555 million BOE in 2021 and 590 million BOE in 2022. This comes with the obvious growth in floating production system in the country.
- Therefore, factors such as rising oil and gas investments along with development and exploration of new plays and projects in the region are expected to give a growth to the floating production systems market in the forecasted period.
Value Chain Analysis
The Asia-Pacific floating production systems value chain starts with field concept selection and FEED led by operators and engineering houses, followed by EPCI contracting for the hull, topsides, and integration, which represents a key spend concentration for FPSO-led developments. Regional shipyards and fabrication yards in China and Singapore support module and hull construction. Recent milestones highlight this footprint, including McDermott completing Scarborough FPU fabrication and floatover work in China (May 2025) and CNOOC starting construction of a 100,000-ton cylindrical FPSO at its Qingdao Base (March 2026).
Key upstream inputs include marine steel and specialized rotating equipment, process packages, turret/mooring systems, and subsea interfaces. Logistics are typically routed through major Asian ports, with heavy-lift transport used for large modules. Downstream, offshore installation and commissioning connect the facility to subsea infrastructure and export routes, either via pipeline or shuttle tanker/LNG chain depending on the project. Contractors span integrated EPCI players (for example, Saipem and joint ventures such as Saipem/PT Tripatra on Indonesia awards) and regional yards (for example, China Merchants Heavy Industry (Jiangsu) under EPC for the PETRONAS Sepat FPSO scope signed in May 2026). Bottlenecks center on yard slots, topsides integration capacity, and coordination of floatover and hook-up windows for mega-structures, which increases the value of standardized designs, modularization, and early supplier engagement across long-lead equipment and marine systems.
Competitive Landscape
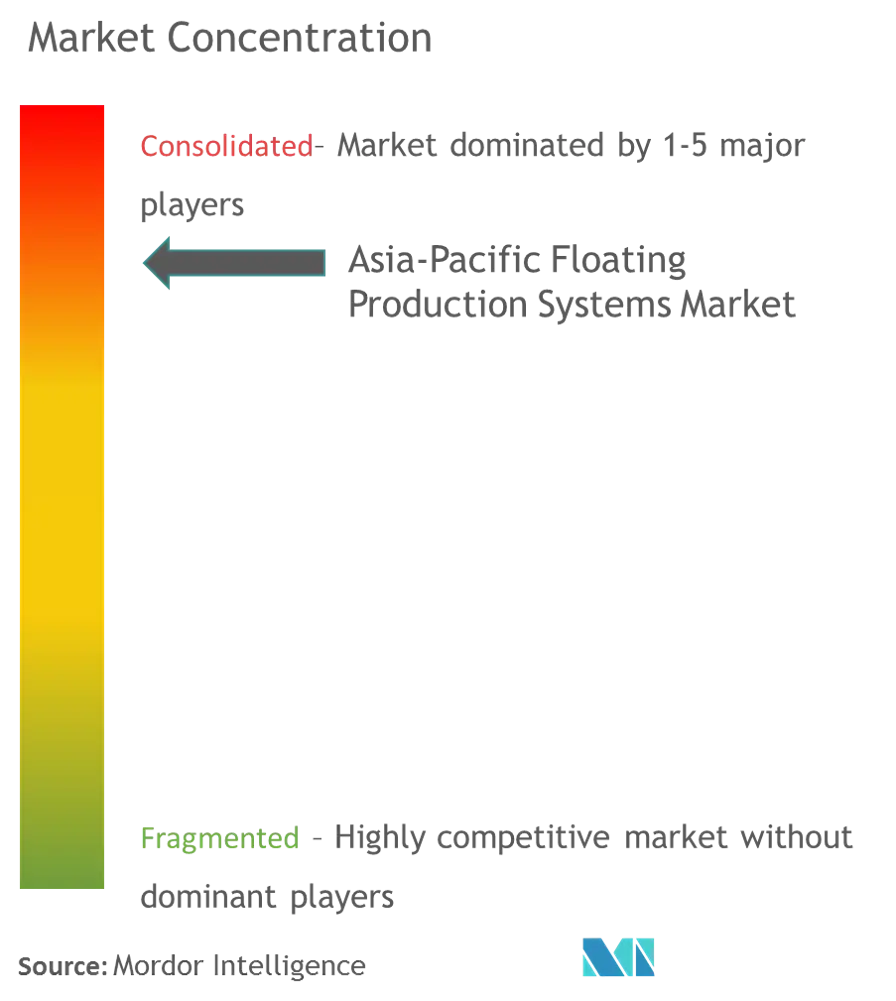
The Asia-Pacific floating production systems market is partially consolidated with some of the top players holding a major share of the market. The key players are Bumi Armada Berhad, Hyundai Heavy Industries Co. Ltd, Keppel Offshore & Marine Ltd, SBM Offshore, Samsung Heavy Industries Co. Ltd, amongst others.
Asia-Pacific Floating Production Systems Industry Leaders
-
Bumi Armada Berhad
-
Hyundai Heavy Industries Co. Ltd
-
Keppel Offshore & Marine Ltd
-
SBM Offshore
-
Samsung Heavy Industries Co. Ltd
- *Disclaimer: Major Players sorted in no particular order
Market Opportunities and Future Outlook
Project activity across Southeast Asia and China points to near-term whitespace for newbuild and redeployment of FPSO/FSO units, supported by contracting and construction starts. In Malaysia, PETRONAS Carigali awarded a long-term lease, operation, and maintenance contract for an FPSO for the Sepat Integrated Redevelopment Project (OceanSTAR Engineering Holding, February 2026), and OceanSTAR Elite and China Merchants Heavy Industry (Jiangsu) later signed an EPC contract for the Sepat FPSO unit (May 2026). This contracting sequence supports leasing-led delivery models (lease plus O&M), brownfield redevelopment packages, and value for yards and integrators that can improve schedule certainty through repeatable engineering and module strategies.
Deepwater gas developments and larger, more complex floating units are also widening the addressable opportunity for high-capacity hull forms, topsides integration, and installation services. Saipem’s USD 2 billion EPCI award for Eni and PETRONAS for the Kutei North Hub FPSO in Indonesia (July 2026) and CNOOC commencing construction of Asia’s largest cylindrical FPSO for the Kaiping South project at Qingdao (March 2026) reinforce demand for technically advanced designs, fabrication capacity, and regional supply-chain depth. Across the region, this supports opportunities in China-centric fabrication and integration, specialized mooring/turret packages, subsea-to-FPSO tieback interfaces, and lifecycle services such as operations, maintenance, and life extension as fleets age.
Recent Industry Developments
- July 2026: Saipem was awarded a USD 2 billion EPCI contract for a newbuild FPSO for Eni North Ganal and PETRONAS for the Kutei North Hub gas development offshore Indonesia. The award highlights Southeast Asia as an active FPSO contracting market for large gas projects and increases the emphasis on integrated EPCI execution and regional fabrication capacity to meet delivery schedules.
- March 2026: CNOOC commenced construction of Asia's largest cylindrical FPSO for the Kaiping South Oilfield Development Project at its Qingdao Base. The start of build activity indicates continued investment in ultra-large floating production infrastructure and supports China-based yards and integration hubs as core supply-chain nodes for complex FPSO hull forms.
- May 2025: McDermott completed fabrication and floatover activities for major Scarborough floating production unit structures in China for Woodside Energy's Scarborough gas project. This milestone underscores the role of Asian fabrication yards for mega-module execution and reduces uncertainty around later integration and offshore hook-up phases for large offshore gas developments.
Research Methodology Framework and Report Scope
Market Definition and Coverage
For this study, the Asia-Pacific floating production systems market is defined as the revenue generated from offshore floating units used for hydrocarbon production in the region, counted across major system types and typical deployment water depths.
Scope exclusions: Onshore production facilities, subsea-only production equipment, and downstream processing assets are not counted unless they are part of the floating production system package.
Segmentation Overview
- Type
- FPSO
- Tension Leg Platform
- SPAR
- Barge
- Water Depth
- Shallow Water
- Deepwater and Ultra-Deepwater
- Geography
- China
- Australia
- India
- Malaysia
- Rest of Asia-Pacific
Data Sources, Market Sizing, and Validation
Desk Research
Desk research was used to build the starting point for the model and to keep assumptions tied to real offshore activity across Asia-Pacific. We reviewed public sources such as national energy ministries, offshore regulator publications, and national statistics bodies, then checked industry references where available, including IEA releases, OPEC market updates, and pages from offshore trade associations.
To translate activity into market value, we focused on indicators that are visible outside paywalls, including offshore project pipelines, field development approvals, and vessel and platform deployment announcements, alongside macro series like crude production and offshore capital spending. Company annual reports, investor presentations, and reliable press were also checked to understand contracting cycles and the timing of refurbishment. In addition, we used paid subscriptions for company financial intelligence, patent lookups, and shipment-level import-export context where it helped confirm equipment and module movement patterns. The sources listed here are illustrative only, and many other public and paid references were used for collection, validation, and clarification.
Primary Interviews and Surveys
Primary work was used to pressure-test the desk assumptions and to fill gaps that often arise in offshore project cycles, such as timing of awards, conversion versus newbuild mix, and what typically sits inside a contracted floating production scope. We spoke with operators, EPC and integration teams, yards and fabricators, and service providers, and we kept coverage balanced across key Asia-Pacific offshore hubs so that demand signals were not overly driven by a single country view.
Distribution of primary research fieldwork respondents
| Company type | Respondent position |
|---|---|
| Top tier: 36% | CXOs: 15% |
| Mid tier: 47% | Functional/Unit leaders: 29% |
| Smaller Players: 17% | Managers: 56% |
Market-Sizing & Forecasting
Sizing starts with a top-down reconstruction of the addressable offshore development pool in Asia-Pacific, using project sanction signals and expected additions of floating production capacity by system type and water depth, which are then converted into annualized spend. To keep the totals realistic, we also used selective bottom-up approximations as cross-checks, such as sampled project cost ranges, typical integration and topside package shares, and observed pricing bands from recent awards and refurbishments.
Inputs in the model include the number of planned and active offshore developments, expected FPSO versus other floater mix, conversion versus newbuild share, typical lead times from award to first oil, and oil and gas price expectations that influence sanction rates. We tracked country-level offshore investment direction and brownfield life-extension activity because these patterns shift the timing and value of demand. Forecasting relied on scenario analysis, where low, base, and high cases were set around project slippage risk, approval cadence, and cost inflation expectations validated through expert calls, and then the base case was reported as the final outlook. Where project-level details were incomplete, we handled gaps by applying conservative averages for unit scope and timing, then re-checked results against regional offshore spend and observed order flow.
Data Validation & Update Cycle
Outputs were validated in multiple passes, first by comparing implied spending against independent signals like offshore project counts, regional upstream investment direction, and visible award announcements. Any large jumps were reviewed at the assumption level, and follow-up questions were triggered when the variance could only be explained by timing differences, scope creep, or currency translation effects.
Before sign-off, the model and calculations go through an analyst review to ensure unit logic, conversion assumptions, and year alignment are consistent across countries and system types. The report is refreshed annually, and interim updates are done when material events occur, such as major project sanctions, cancellations, or sharp shifts in cost inflation. Right before delivery, a final review pass is completed so clients receive the latest updated view.
Mordor Intelligence's Asia Pacific Floating Production Systems Market Market Size Compared Against Other Published Estimates
It is normal to see different published market sizes for floating production systems because groups do not always count the same equipment scope, the same geography inside Asia-Pacific, or the same timing for when a project becomes part of the market value. Differences also show up when one number is based on a project pipeline view and another is built from installed base or replacement cycles.
Some external estimates roll adjacent offshore categories into the total, such as FSO vessels or broader offshore production infrastructure value. In Mordor Intelligence, the value is counted only when it maps to defined floating production system types and an Asia-Pacific deployment lens, and then it is timed to realistic award and commissioning windows rather than long-horizon pipeline optimism.
Benchmark comparison
| Source | Market Size | Gaps in Research Methodology |
|---|---|---|
| Mordor Intelligence | USD 7.93 B (2023) | |
| Trade Publisher A | USD 18.95 B (2024) | Uses a broader regional total that appears aligned to a global-share allocation and can embed wider offshore system value and pricing levels beyond the defined floating production system scope, which lifts the headline number. |
| Industry Report B | USD 13.52 B (2029) | Reports a different year and a forward value that depends heavily on project timing assumptions, and the scope language suggests inclusion of non-identical unit categories, which can move the total upward when pipeline is treated as firm demand. |
Taken together, the spread is mainly explained by scope and timing choices, plus the year being quoted. By keeping the inputs tied to visible sanction and award signals, and by separating floating production units from adjacent offshore assets, the model stays traceable to clear drivers that can be checked and repeated.
Key Questions Answered in the Report
What is the current Asia-Pacific Floating Production Systems Market size?
The Asia-Pacific Floating Production Systems Market is projected to register a CAGR of 10.58% during the forecast period (2026-2031)
Who are the key players in Asia-Pacific Floating Production Systems Market?
Bumi Armada Berhad, Hyundai Heavy Industries Co. Ltd, Keppel Offshore & Marine Ltd, SBM Offshore and Samsung Heavy Industries Co. Ltd are the major companies operating in the Asia-Pacific Floating Production Systems Market.
What years does this Asia-Pacific Floating Production Systems Market cover?
The report covers the Asia-Pacific Floating Production Systems Market historical market size for years: 2020, 2021, 2022, 2023 and 2024. The report also forecasts the Asia-Pacific Floating Production Systems Market size for years: 2026, 2027, 2028, 2029, 2030 and 2031.