
Asia-Pacific Bulk Cargo Shipping Market Size and Share
Market Overview
| Study Period | 2020 - 2031 |
|---|---|
| Forecast Data Period | 2026 - 2031 |
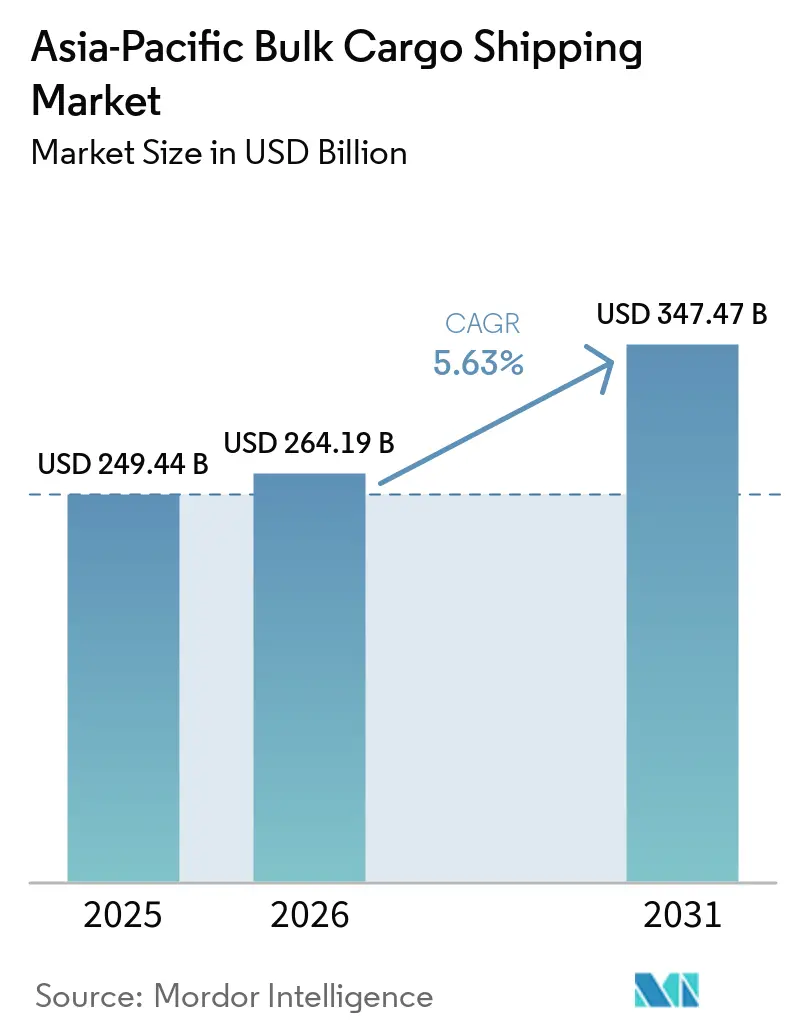
| Base Year Market Size (2025) | USD 249.44 Billion |
| Market Size (2026) | USD 264.19 Billion |
| Market Size (2031) | USD 347.47 Billion |
| Growth Rate (2026 - 2031) | 5.63 % |
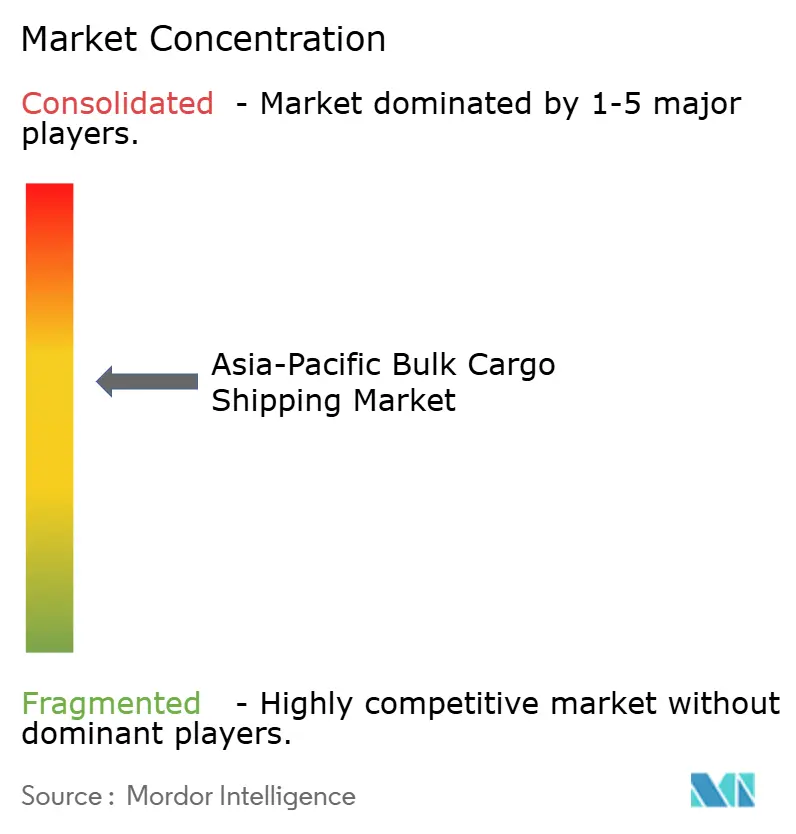
| Market Concentration | Medium |
Major Players *Disclaimer: Major Players sorted in no particular order Image © Mordor Intelligence. Reuse requires attribution under CC BY 4.0. | |
Asia-Pacific Bulk Cargo Shipping Market Analysis by Mordor Intelligence
The Asia-Pacific bulk cargo shipping market size was valued at USD 249.44 billion in 2025 and estimated to grow from USD 264.19 billion in 2026 to reach USD 347.47 billion by 2031, at a CAGR of 5.63% during the forecast period (2026-2031).
The region remains central to high-volume seaborne commodity trade because China imports large volumes of steelmaking materials, and Southeast Asian economies continue to build industrial capacity. Iron ore, coal, grain, fertilizers, cement, and bauxite support the main dry bulk flows, while LNG, crude oil, LPG, and chemicals support liquid bulk movements. Longer sourcing routes are increasing ton-mile demand even where headline cargo volumes are less dynamic. The Asia-Pacific bulk cargo shipping market also faces uneven port capacity, variable freight rates, and rising requirements for vessel efficiency.
Carriers are responding through fleet renewal, longer charter coverage, and a stronger presence in growing Southeast Asian trades, while matching vessel class and cargo handling capabilities with individual route requirements. This operating approach matters when long-haul iron ore movements, shorter coastal cargoes, liquid bulk calls, and time-sensitive infrastructure deliveries compete for berth capacity. It also places more value on reliable schedules, fuel performance, suitable port access, and commercial arrangements that give operators clearer revenue coverage. The Asia-Pacific bulk cargo shipping market is therefore shaped by the interaction between cargo sourcing, port performance, regulatory compliance, fleet availability, and the ability to deploy vessels efficiently across different regional trade lanes.
Key Report Takeaways
- By cargo type, dry bulk cargo held 68.07% of the Asia-Pacific bulk cargo shipping market share in 2025, while liquid bulk cargo is forecast to grow at a 7.05% CAGR through 2031.
- By shipping route, international services accounted for 76.11% of the Asia-Pacific bulk cargo shipping market size in 2025, while international routes are forecast to grow at a 6.73% CAGR through 2031.
- By end-use industry, mining and metals accounted for 31.00% of the Asia-Pacific bulk cargo shipping market share in 2025, while chemicals and petrochemicals are forecast to grow at a 7.50% CAGR through 2031.
- By country, China held 29.48% of the Asia-Pacific bulk cargo shipping market revenue in 2025, while Vietnam is forecast to grow at an 8.27% CAGR through 2031.
Note: Market size and forecast figures in this report are generated using Mordor Intelligence’s proprietary estimation framework, updated with the latest available data and insights as of January 2026.
Market Trends and Insights
Drivers Impact Analysis of Asia-Pacific Bulk Cargo Shipping Market*
| Driver | (~) % Impact on CAGR Forecast | Geographic Relevance | Impact Timeline |
|---|---|---|---|
| Asia-Pacific Infrastructure-Led Commodity Flow Growth | +1.6% | Global, with emphasis on China, India, Vietnam, and Indonesia | Medium term (2-4 years) |
| Deep-Sea Trade Expansion in Iron Ore and Coal Corridors | +1.1% | Global, primarily Australia-China, Indonesia-Asia-Pacific, and Brazil-India | Medium term (2-4 years) |
| Fleet Renewal Toward Fuel-Efficient Capesize and Panamax Tonnage | +0.9% | Global fleet, with extensive Asia-Pacific newbuilding activity | Long term (≥ 4 years) |
| Port Automation and Berth Productivity Improvements | +0.7% | China, Singapore, and Southeast Asia | Medium term (2-4 years) |
| Export-Oriented Agricultural and Industrial Raw Material Flows | +0.5% | Australia, Indonesia, Southeast Asia, and India | Short term (≤ 2 years) |
| Digitized Voyage Optimization and Cargo Visibility Adoption | +0.4% | Global, led by Japanese and Singaporean fleets | Medium term (2-4 years) |
| Source: Mordor Intelligence | |||
Asia-Pacific Infrastructure-Led Commodity Flow Growth
Public infrastructure programs in the Asia-Pacific are supporting demand for large commodity parcels and repeat shipping movements. Vietnam imported 30.5 million tons of ores and minerals in 2025, up 16.8% by volume, as infrastructure activity required more steel and construction materials.[1] India’s Sagarmala program is implementing 845 projects worth INR 6.06 trillion (USD 67.45 billion), with 315 projects worth INR 1.57 trillion (USD 17.47 billion) completed. These programs increase demand for inputs that move in Capesize and Panamax parcels. Long-term infrastructure procurement can favor contracted tonnage over spot fixtures because buyers need dependable delivery schedules. This pattern supports capacity use in the Asia-Pacific bulk cargo shipping market when other commodity demand is less certain.
Deep-Sea Trade Expansion in Iron Ore and Coal Corridors
Iron ore remains a core source of vessel demand across the Asia-Pacific bulk cargo shipping market. Global seaborne iron ore shipments reached 1.71 billion metric tons in 2025, and Australia exported 944.8 million metric tons. Capesize vessels moved more than 70% of global seaborne iron ore, supporting the importance of Australia-China and Brazil-China routes. Coal sourcing patterns changed during 2025 as Indonesian thermal coal movements to North China weakened. Australia East to South China Capesize coal routes expanded as the relative economics of imported coal changed. The shift added distance and supported Capesize utilization despite weaker headline coal volumes.
Fleet Renewal Toward Fuel-Efficient Capesize and Panamax Tonnage
Fleet renewal is shaping investment decisions because fuel efficiency now affects cost control and access to cargo tenders. IMO Resolution MEPC.400(83) set the Carbon Intensity Indicator reduction factor at 9% against the 2019 baseline in 2025 and 11% in 2026.[2] The reduction factor rises to 13.6% in 2027 and 21.5% by 2030. Vessels rated D for 3 consecutive years or E for 1 year must prepare corrective action plans. Charterers increasingly use vessel efficiency ratings when screening tender participants. These rules favor newer Capesize and Panamax ships on major regional routes.
Port Automation and Berth Productivity Improvements
Port productivity affects the available supply of vessels because ships waiting at anchor cannot complete revenue-generating voyages. A predictable port stay helps operators plan speed, fuel use, and arrival times more effectively. This is particularly relevant for large bulk vessels, where delays can disrupt subsequent loading windows. The Asia-Pacific bulk cargo shipping market benefits when terminals improve berth planning and cargo handling reliability. Faster vessel turnaround also supports compliance efforts by reducing avoidable fuel consumption. Digital cargo documentation and voyage optimization can extend these benefits beyond the berth.
Restraints Impact Analysis of Asia-Pacific Bulk Cargo Shipping Market*
| Restraint | (~) % Impact on CAGR Forecast | Geographic Relevance | Impact Timeline |
|---|---|---|---|
| Volatility in Dry Bulk Freight Rates | -0.8% | Global, with pressure on the Asia-Pacific basin routes | Short term (≤ 2 years) |
| Port Congestion and Draft Limit Constraints | -0.6% | China, Australia, India, and Southeast Asia | Medium term (2-4 years) |
| Emission Compliance and Fuel Cost Pressure | -0.5% | Global, with greater exposure for older Asia-Pacific fleets | Long term (≥ 4 years) |
| Commodity Substitution and Demand Cyclicality | -0.4% | China, Japan, South Korea, and India | Long term (≥ 4 years) |
| Source: Mordor Intelligence | |||
Volatility in Dry Bulk Freight Rates
Freight rate volatility remains a key operating challenge for owners with limited contracted revenue. The Baltic Dry Index averaged 2,023 points in 2025, down 8.3% from the prior period, before ending the year at 2,770 points. Capesize day rates moved from USD 7,000 to USD 10,000 per day early in 2025 to nearly USD 45,000 per day in December. Port delays, cargo rerouting, and slower new vessel deliveries contributed to the late-year rate recovery. That recovery reflected tighter utilization and supply friction rather than stronger cargo demand. The Asia-Pacific bulk cargo shipping market remains exposed if delays ease or fleet deliveries accelerate.
Port Congestion and Draft Limit Constraints
Congestion at bulk terminals reduces usable vessel capacity and raises voyage costs. Geraldton Port recorded 900 hours of lost ship-loading time from October 2024 through August 2025 because of surge closures. July 2025 alone accounted for 250 hours of closure at the port. Such disruption can cascade through loading schedules at competing export points. Secondary ports are especially important because demand is spreading across Southeast and South Asia. The result is a continuing tension between cargo growth and vessel utilization.
*Our forecasts treat driver/restraint impacts as directional, not additive. The impact forecasts reflect baseline growth, mix effects, and variable interactions.
Asia-Pacific Bulk Cargo Shipping Market Segment Analysis
By Cargo Type:
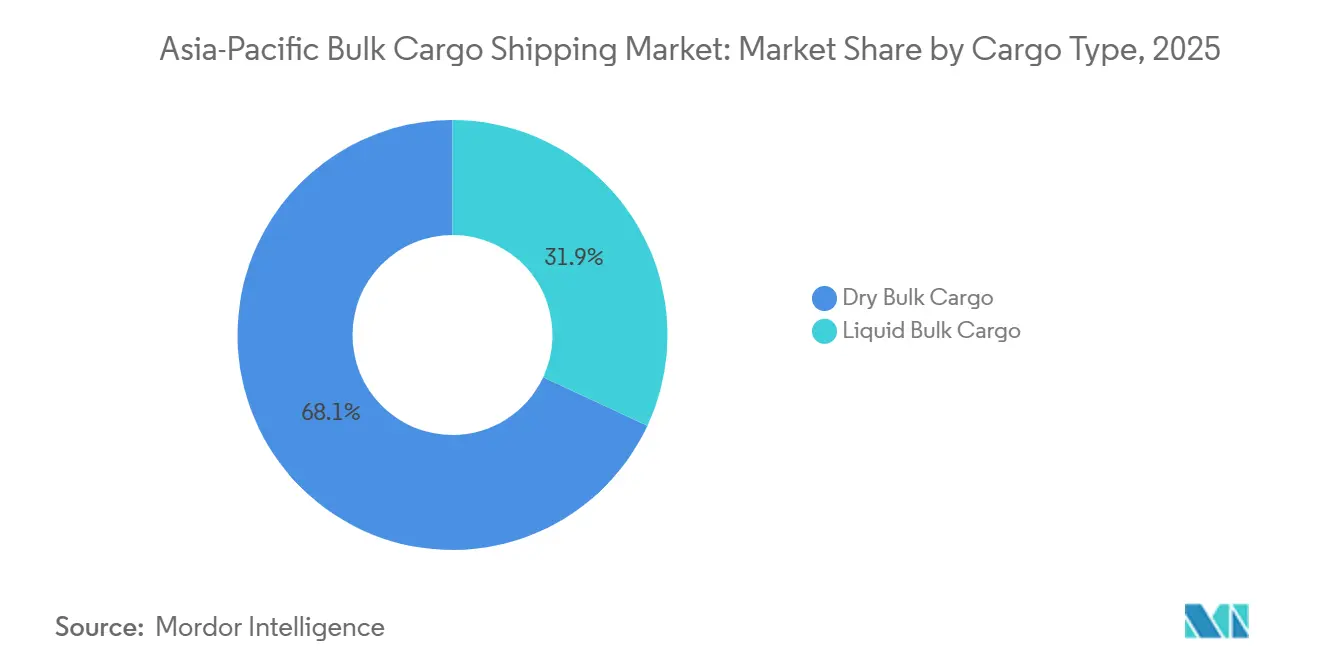
Liquid Bulk Grows While Dry Bulk Anchors the MarketDry bulk held the leading position in the Asia-Pacific bulk cargo shipping market, accounting for 68.07% of the market share in 2025, with regional production and construction requiring large volumes of iron ore, coal, grain, fertilizers, cement, and bauxite. Iron ore and coal together represented more than half of global dry bulk cargo by weight, with iron ore supporting Capesize demand and thermal coal supporting Panamax and Supramax movements. Australia-China and Indonesia-Asia-Pacific routes remained major freight corridors, while bauxite and alumina linked Australian and Southeast Asian suppliers with Chinese and Indian smelters. Grain shipments of wheat, corn, and soybeans supported Panamax demand through Southern Hemisphere harvest cycles, and fertilizer, cement, and clinker cargoes supported Handysize and Supramax deployment. These varied cargoes made dry bulk the volume base of the Asia-Pacific bulk cargo shipping market. They tied its performance to industrial production, infrastructure activity, agricultural demand, and power generation.
Liquid bulk cargo is projected to be the fastest-growing cargo category through 2031, expanding at a 7.05% CAGR, supported by LNG trade, refined petroleum products, and expanding chemical manufacturing across the Asia-Pacific. The Asia-Pacific bulk cargo shipping market size for liquid bulk was supported by the LNG trade of 437 million tons in 2025, with Japan, China, and South Korea accounting for the largest regional imports.[3] Crude oil moved on Middle East-China and Middle East-Korea routes, while LPG supported VLGC and chemical tanker deployment in Japan and South Korea. Chemical and edible oil shipments from Malaysia, Indonesia, and Thailand added recurring intra-regional tanker demand, linking regional processing hubs to consuming markets. MARPOL Annex I and the IMO greenhouse gas strategy are influencing vessel specifications, with owners considering dual-fuel capability for VLCC and LNG carrier newbuildings as sourcing patterns and refinery activity evolve.

By Shipping Route:
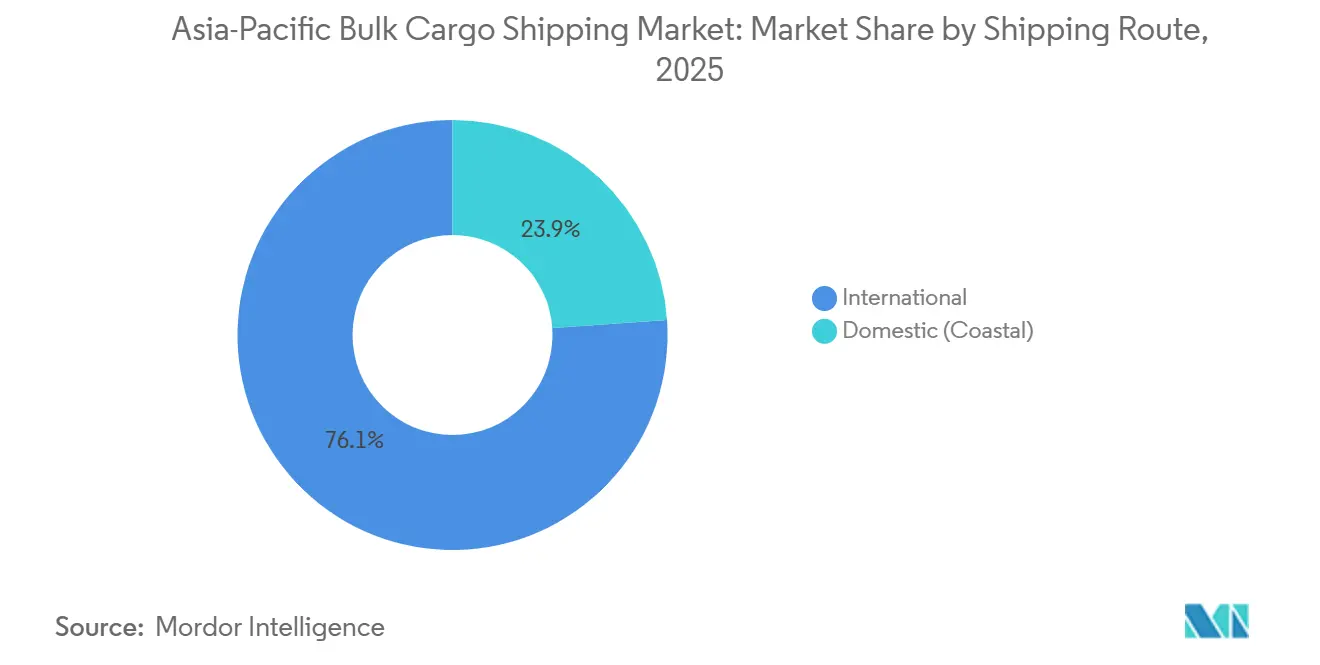
International Routes Sustain Volume DominanceInternational routes formed the main volume base of the Asia-Pacific bulk cargo shipping market in 2025, accounting for 76.11% of the market size, and are projected to remain the fastest-growing shipping route through 2031, expanding at a 6.73% CAGR, led by the Australia-Brazil-China iron ore triangle and the Indonesia-India-China coal axis. Brazil shipped 390.6 million metric tons of iron ore to China in 2025, a long voyage that requires large vessels and absorbs capacity for more days. International LNG routes connected Northeast Asian buyers with Australian, Middle Eastern, North American, and Canadian suppliers. Indonesian thermal coal flows to North China contracted during 2025, while Australia East to South China Capesize movements expanded as Chinese domestic coal became more competitive. This route reconfiguration increased ton-mile demand and supported larger vessel use even as aggregate coal volumes declined, keeping international corridors central to the Asia-Pacific bulk cargo shipping market.
Domestic and coastal routes played a smaller but essential role in national commodity distribution. India targeted 250 million metric tons per year of coastal shipping traffic under Sagarmala, supported by coal, cement, iron, steel, food grains, and fertilizers. India’s major ports handled 915 million tons in FY2025-26, and domestic shipping linked port gateways with industrial and consumption centers. Indonesia’s inter-island services moved coal, nickel ore, and cement, while Australia’s coastal network linked mining regions with export terminals. China’s coastal system redistributed imported commodities to inland industrial centers, although draft restrictions at secondary ports could limit vessel deployment flexibility.
By End-Use Industry:
Mining and Metals Leads While Chemicals and Petrochemicals Gain GroundMining and metals were the largest end-use sector by freight volume, accounting for 31.00% of the Asia-Pacific bulk cargo shipping market share in 2025, reflecting China’s dependence on imported iron ore for steelmaking. China imported 1.28 billion metric tons of seaborne iron ore in 2025, representing nearly 3 quarters of global seaborne imports and making changes in Chinese steel production important for Capesize conditions. Japan and South Korea continued to import steelmaking materials despite mature demand profiles, while India added demand for coking coal and high-grade iron ore. Energy and Utilities was the second-largest end-use sector, with thermal coal supporting Panamax and Supramax employment in Vietnam, Indonesia, the Philippines, India, and Bangladesh. Mining and metals remained the core demand base because its cargo mix connected freight requirements to steel, infrastructure, and energy cycles across the region.
Chemicals and petrochemicals are projected to be the fastest-growing end-use sector through 2031, expanding at a 7.50% CAGR, supported by refining, chemical manufacturing, and LNG-based feedstock supply chains. Vietnam’s industrial production rose 10.1% year over year in December 2025, supporting imports of chemical feedstocks, LPG, and industrial solvents. South Korea’s LNG import increase during 2025 partly reflected chemical feedstock demand. Liquid bulk vessel movements between suppliers, chemical plants, and processing hubs support the Asia-Pacific bulk cargo shipping market size for this end use. Agriculture provided a cyclical source of grain and fertilizer cargoes, while construction, food processing, and manufacturing created mid-tier demand for cement, clinker, steel products, and edible oils.
Geography Analysis
China and India Bulk Cargo Shipping Market
China was the largest national market in the Asia-Pacific bulk cargo shipping market, accounting for 29.48% of the market size in 2025, with 1.28 billion metric tons of iron ore imports in 2025. This volume represented nearly 3 quarters of global seaborne iron ore imports. Mainland China’s coal arrivals fell during 2025 as domestic coal pricing reduced the appeal of imports. Its need to redistribute imported raw materials, which still support extensive maritime logistics activity. India’s major ports handled 915 million tons in FY 2026.
APAC Bulk Cargo Shipping Market
Sagarmala 2.0, supported by INR 854.82 billion (USD 9.51 billion), aims to catalyze INR 3.6 trillion (USD 40.07 billion) in investment. Australia exported 944.8 million metric tons of iron ore in 2025 and remained a critical Pacific-basin supply source. Japan imported 65.6 million metric tons of LNG in 2025, marking its third consecutive annual decline. South Korea increased LNG imports by 1.7 million tons in 2025. Singapore remained a regional coordination, bunkering, flagging, and maritime services hub.
ASEAN and South Asia Bulk Cargo Shipping Market
Vietnam is projected to be the fastest-growing geography through 2031, expanding at an 8.27% CAGR, supported by trade turnover of USD 930.1 billion in 2025 and coal imports of 65.4 million.[4] Iron ore inflows approached 27 million tons as the country recorded 8% GDP growth in 2025. Indonesia exported 487 million metric tons of thermal coal in 2025 while increasing imports of construction materials, chemicals, and food commodities. Thailand, the Philippines, and Bangladesh added demand for coal and fertilizers. Southeast and South Asian sourcing patterns increased voyage distances and supported ton-mile demand.
Competitive Landscape
The Asia-Pacific bulk cargo shipping market showed moderately high concentration among large Chinese, Japanese, and Korean carriers. These operators combine fleet scale, long-term charter coverage, and access to major trade corridors. COSCO Shipping Development ordered 24 dry bulk vessels in June 2026 under 20-year charter agreements. It followed with an order for 15 dual-fuel-ready Newcastlemax ships in July 2026. The combined program involved 39 vessels and RMB 16.6 billion (USD 2.37 billion).
MOL acquired a 72% stake in Gearbulk in January 2025. The transaction expanded MOL’s dry bulk fleet to 338 vessels and created the world’s largest dry bulk fleet. Gearbulk added specialized open-hatch capability for forest products, project cargo, and niche bulk trades. Pacific Basin replaced 4 dual-fuel Ultramax orders with fuel-efficient conventional Ultramax vessels in April 2026 while retaining options for 2 methanol dual-fuel ships. Fleet efficiency, digital voyage planning, and Southeast Asian expansion remain central competitive priorities.
Precious Shipping, IMC Shipping, and Wisdom Marine retained positions in intra-Asia-Pacific minor bulk and coastal trades. These routes offer opportunities where larger Capesize and Panamax operators do not place their newest tonnage. Pacific Basin reported that 15% of the global Handysize and Supramax fleet was more than 20 years old at the end of 2025. Older ships face a growing risk of exclusion from efficiency-focused tenders. The Asia-Pacific bulk cargo shipping market is shaped by fleet renewal, cargo specialization, charter coverage, and operating efficiency.
Asia-Pacific Bulk Cargo Shipping Industry Leaders
-
COSCO Shipping Bulk Co., Ltd.
-
China Merchants Energy Shipping Co., Ltd.
-
Mitsui O.S.K. Lines, Ltd.
-
Nippon Yusen Kabushiki Kaisha (NYK Line)
-
Kawasaki Kisen Kaisha, Ltd. (K Line)
- *Disclaimer: Major Players sorted in no particular order
Asia-Pacific Bulk Cargo Shipping Market Companies Covered in this Report
- COSCO Shipping Bulk Co., Ltd.
- China Merchants Energy Shipping Co., Ltd.
- Mitsui O.S.K. Lines, Ltd.
- Nippon Yusen Kabushiki Kaisha (NYK Line)
- Kawasaki Kisen Kaisha, Ltd. (K Line)
- Pacific Basin Shipping Limited
- Berge Bulk Pte. Ltd.
- Pan Ocean Co., Ltd.
- Eastern Pacific Shipping
- Wisdom Marine Lines Co., Ltd.
- U-Ming Marine Transport Corporation
- Oldendorff Carriers GmbH & Co. KG
- Great Eastern Shipping Company Limited
- Star Bulk Carriers Corp.
- CMB.TECH (Including Golden Ocean Group Limited)
- Shipping Corporation of India Limited
- Swire Bulk
- Chinese Maritime Transport Ltd.
- Shandong Shipping Corporation
- Sincere Navigation Corporation
- IMC Shipping Pte. Ltd.
- Precious Shipping Public Company Limited
Recent Industry Developments in Asia-Pacific Bulk Cargo Shipping Market
- July 2026: COSCO Shipping Development ordered 15 Newcastlemax bulk carriers, 210,000 DWT each, with methanol and ammonia dual-fuel readiness from Shanghai Waigaoqiao Shipbuilding and Nantong Xiangyu Shipbuilding yards, at a total cost of RMB 7.9 billion (USD 1.23 billion). Deliveries are scheduled for 2029 and 2030, with annual rental per vessel expected to reach RMB 59.4 million (USD 8.48 million).
- June 2026: COSCO Shipping Development announced a 24-vessel newbuilding program comprising 20 multipurpose grain carriers, 87,000 DWT each, and 4 large dry bulk carriers, 210,000 DWT each, at a combined cost of RMB 8.7 billion (USD 1.24 billion). All vessels are committed under 20-year charter agreements with Huifeng Co.
- April 2026: Pacific Basin Shipping replaced 4 dual-fuel Ultramax orders with 4 fuel-efficient conventional Ultramax vessels and ordered 2 Handysize newbuildings. It retained options for 2 methanol dual-fuel vessels.
- March 2026: Star Bulk Carriers signed a USD 80 million financing facility for its 8-vessel Kamsarmax newbuilding program, with the first 2 vessels delivered in May 2026.
Asia-Pacific Bulk Cargo Shipping Market Report Scope
Segmentation Overview
| Dry Bulk Cargo | Iron Ore |
| Coal | |
| Grain (Wheat, Corn, Soybeans, etc.) | |
| Fertilizers | |
| Cement & Clinker | |
| Bauxite & Alumina | |
| Steel Products | |
| Other Minor Dry Bulk Commodities | |
| Liquid Bulk Cargo | Crude Oil |
| Refined Petroleum Products | |
| Liquefied Natural Gas (LNG) | |
| Liquefied Petroleum Gas (LPG) | |
| Chemicals | |
| Edible & Vegetable Oils | |
| Molasses | |
| Other Liquid Bulk Commodities |
| Domestic (Coastal) |
| International |
| Mining & Metals |
| Energy & Utilities |
| Agriculture |
| Chemicals & Petrochemicals |
| Construction & Infrastructure |
| Food Processing |
| Manufacturing (General Industrial) |
| Others |
| China |
| Japan |
| South Korea |
| India |
| Australia |
| Singapore |
| Thailand |
| Indonesia |
| Vietnam |
| Rest of Asia-Pacific |
| By Cargo Type | Dry Bulk Cargo | Iron Ore |
| Coal | ||
| Grain (Wheat, Corn, Soybeans, etc.) | ||
| Fertilizers | ||
| Cement & Clinker | ||
| Bauxite & Alumina | ||
| Steel Products | ||
| Other Minor Dry Bulk Commodities | ||
| Liquid Bulk Cargo | Crude Oil | |
| Refined Petroleum Products | ||
| Liquefied Natural Gas (LNG) | ||
| Liquefied Petroleum Gas (LPG) | ||
| Chemicals | ||
| Edible & Vegetable Oils | ||
| Molasses | ||
| Other Liquid Bulk Commodities | ||
| By Shipping Route | Domestic (Coastal) | |
| International | ||
| By End-Use Industry | Mining & Metals | |
| Energy & Utilities | ||
| Agriculture | ||
| Chemicals & Petrochemicals | ||
| Construction & Infrastructure | ||
| Food Processing | ||
| Manufacturing (General Industrial) | ||
| Others | ||
| By Country | China | |
| Japan | ||
| South Korea | ||
| India | ||
| Australia | ||
| Singapore | ||
| Thailand | ||
| Indonesia | ||
| Vietnam | ||
| Rest of Asia-Pacific | ||
Key Questions Answered in the Report
What is driving demand for bulk cargo shipping in the Asia-Pacific?
Infrastructure investment, Chinese steelmaking imports, and Southeast Asian industrial growth are sustaining demand for dry and liquid bulk movements.
How large will Asia-Pacific bulk cargo shipping be by 2031?
The sector is forecast to reach USD 347.47 billion by 2031, growing at a 5.63% CAGR from 2026.
Which cargo category is growing fastest in Asia-Pacific shipping?
Liquid bulk is the fastest-growing category, supported by LNG, crude oil, LPG, chemical, and edible oil movements.
Why are international bulk routes important in the region?
International iron ore, coal, and LNG lanes combine high cargo volumes with long voyage distances, increasing ton-mile demand.
How do IMO carbon rules affect bulk vessel operators?
Tighter Carbon Intensity Indicator requirements favor fuel-efficient ships and increase compliance pressure on older vessels.
Which countries are expanding their role in regional bulk trade?
Vietnam is the fastest-growing economy, while India and Indonesia are increasing activity through infrastructure and industrial development.