
Alternate Marine Power Market Size and Share
Market Overview
| Study Period | 2022 - 2032 |
|---|---|
| Market Size (2027) | USD 2.41 Billion |
| Market Size (2032) | USD 3.79 Billion |
| Growth Rate (2027 - 2032) | 9.45 % |
| Fastest Growing Market | Asia-Pacific |
| Largest Market | Europe |
| Market Concentration | Medium |
Major Players *Disclaimer: Major Players sorted in no particular order Image © Mordor Intelligence. Reuse requires attribution under CC BY 4.0. | |
Alternate Marine Power Market Analysis by Mordor Intelligence
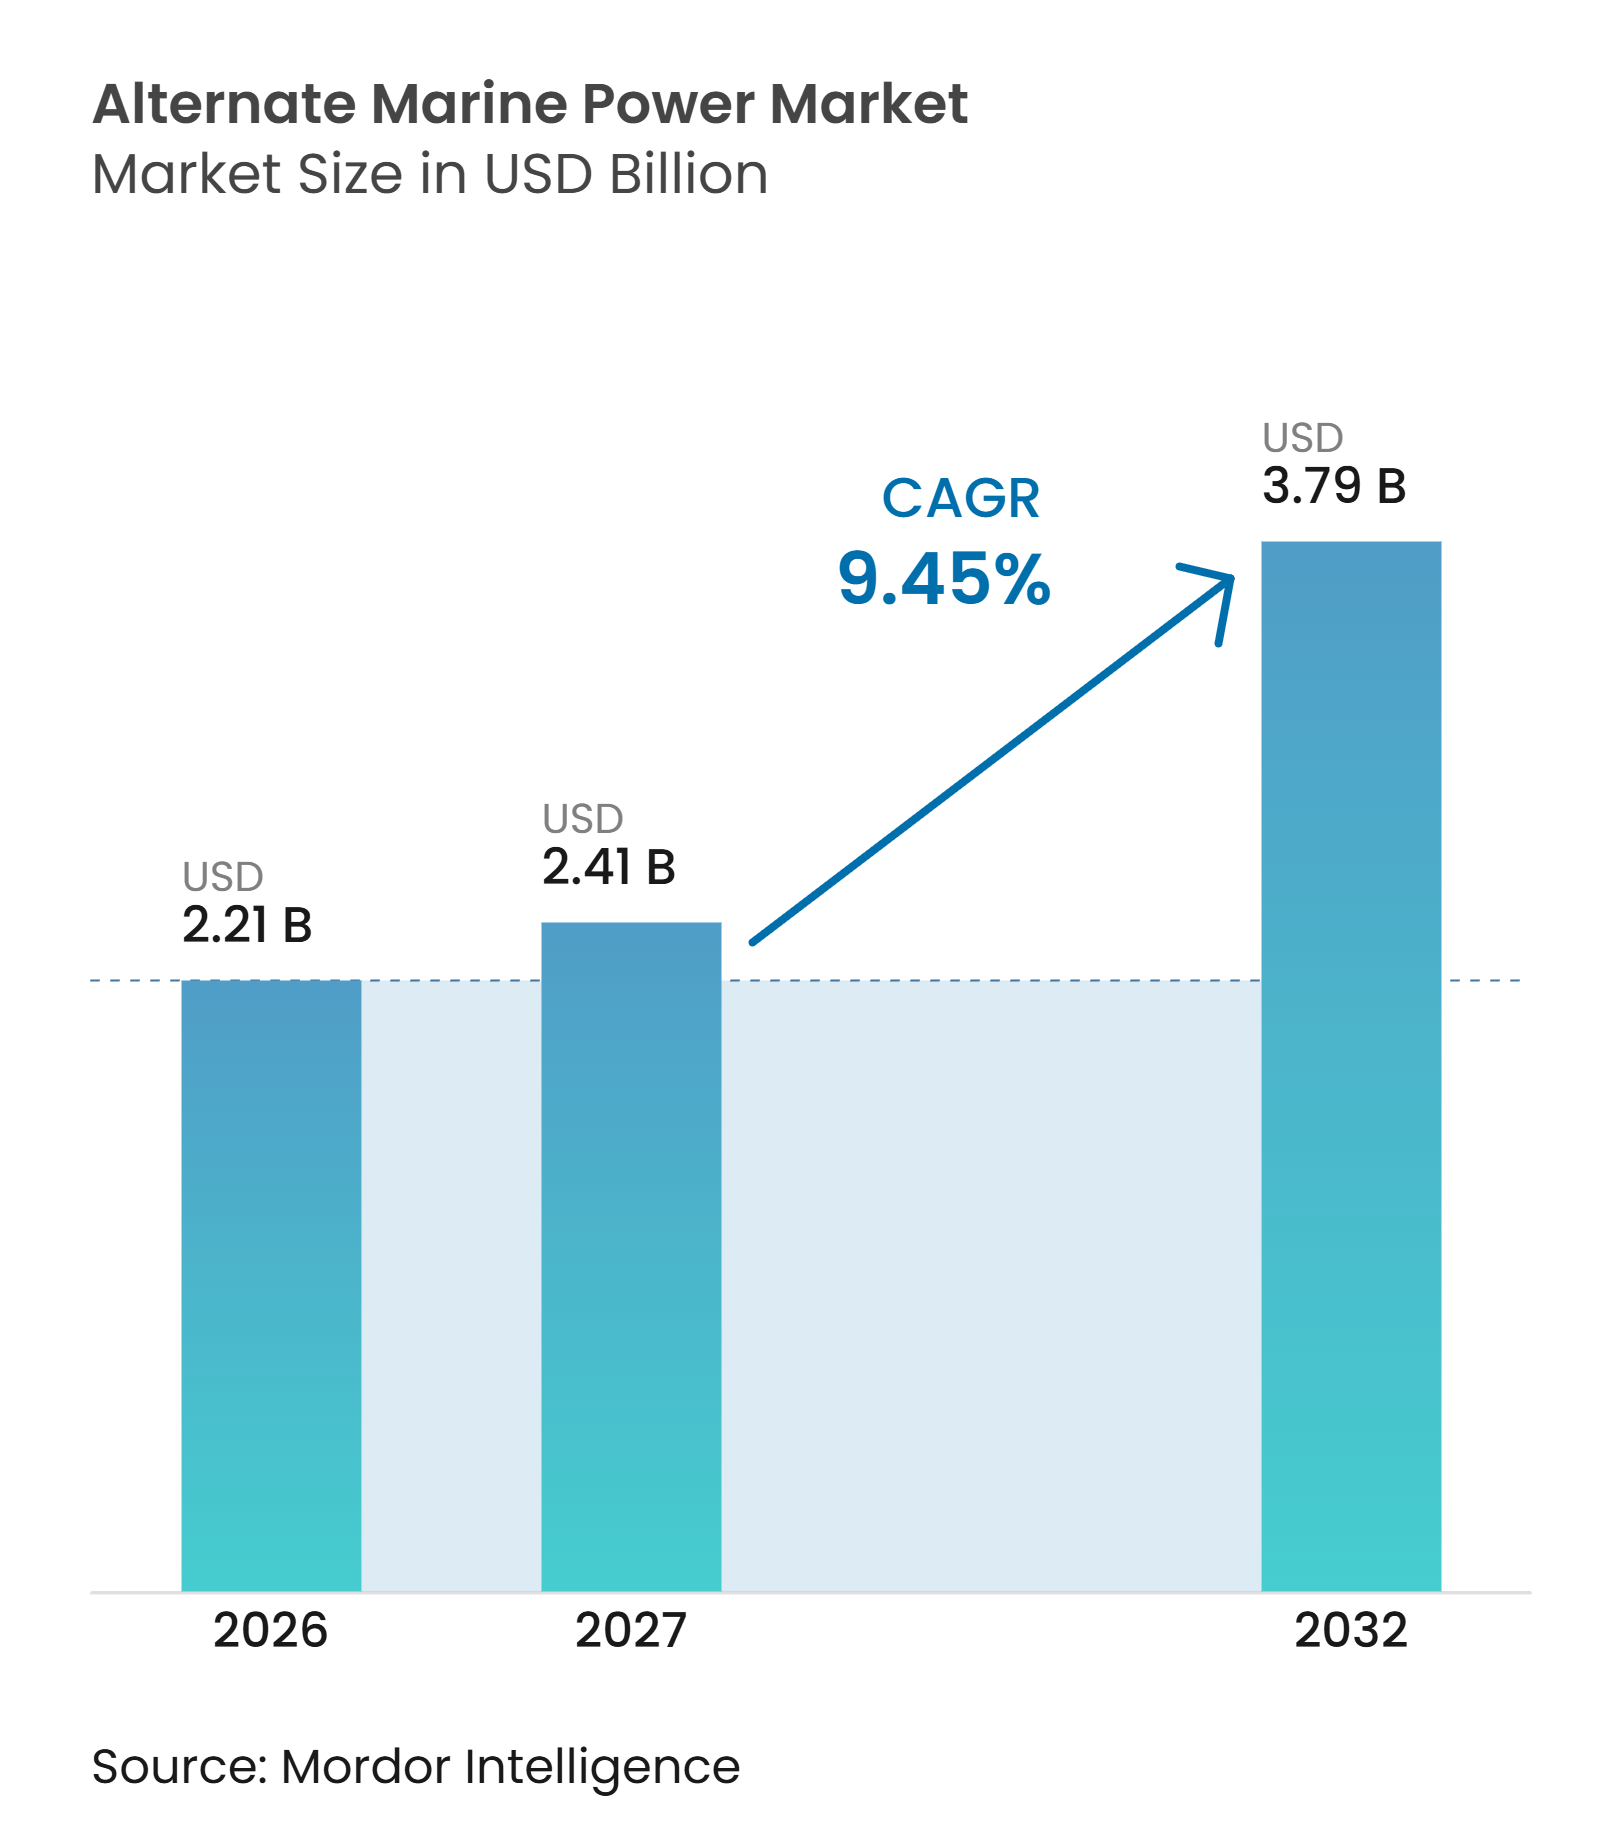
The Alternate Marine Power Market size is valued at USD 2.21 billion in 2026 and is forecast to reach USD 3.79 billion by 2032, at a CAGR of 9.4% over 2027-2032. Regulatory requirements in Europe and China are changing port energy procurement and encouraging earlier investment decisions. FuelEU Maritime requires qualifying passenger and container ships to connect from January 2030 at TEN-T ports, while China requires coastal vessels at berth for more than 3 hours to use shore power. These requirements place ports and vessel operators on a shared timetable, which brings equipment orders forward. The Alternate Marine Power Market also benefits as ports combine shore power with grid upgrades, batteries, and renewable generation. Suppliers that can deliver complete systems and support long project cycles have a stronger position as procurement moves from pilot projects to major terminal programs.[1]
Key Report Takeaways
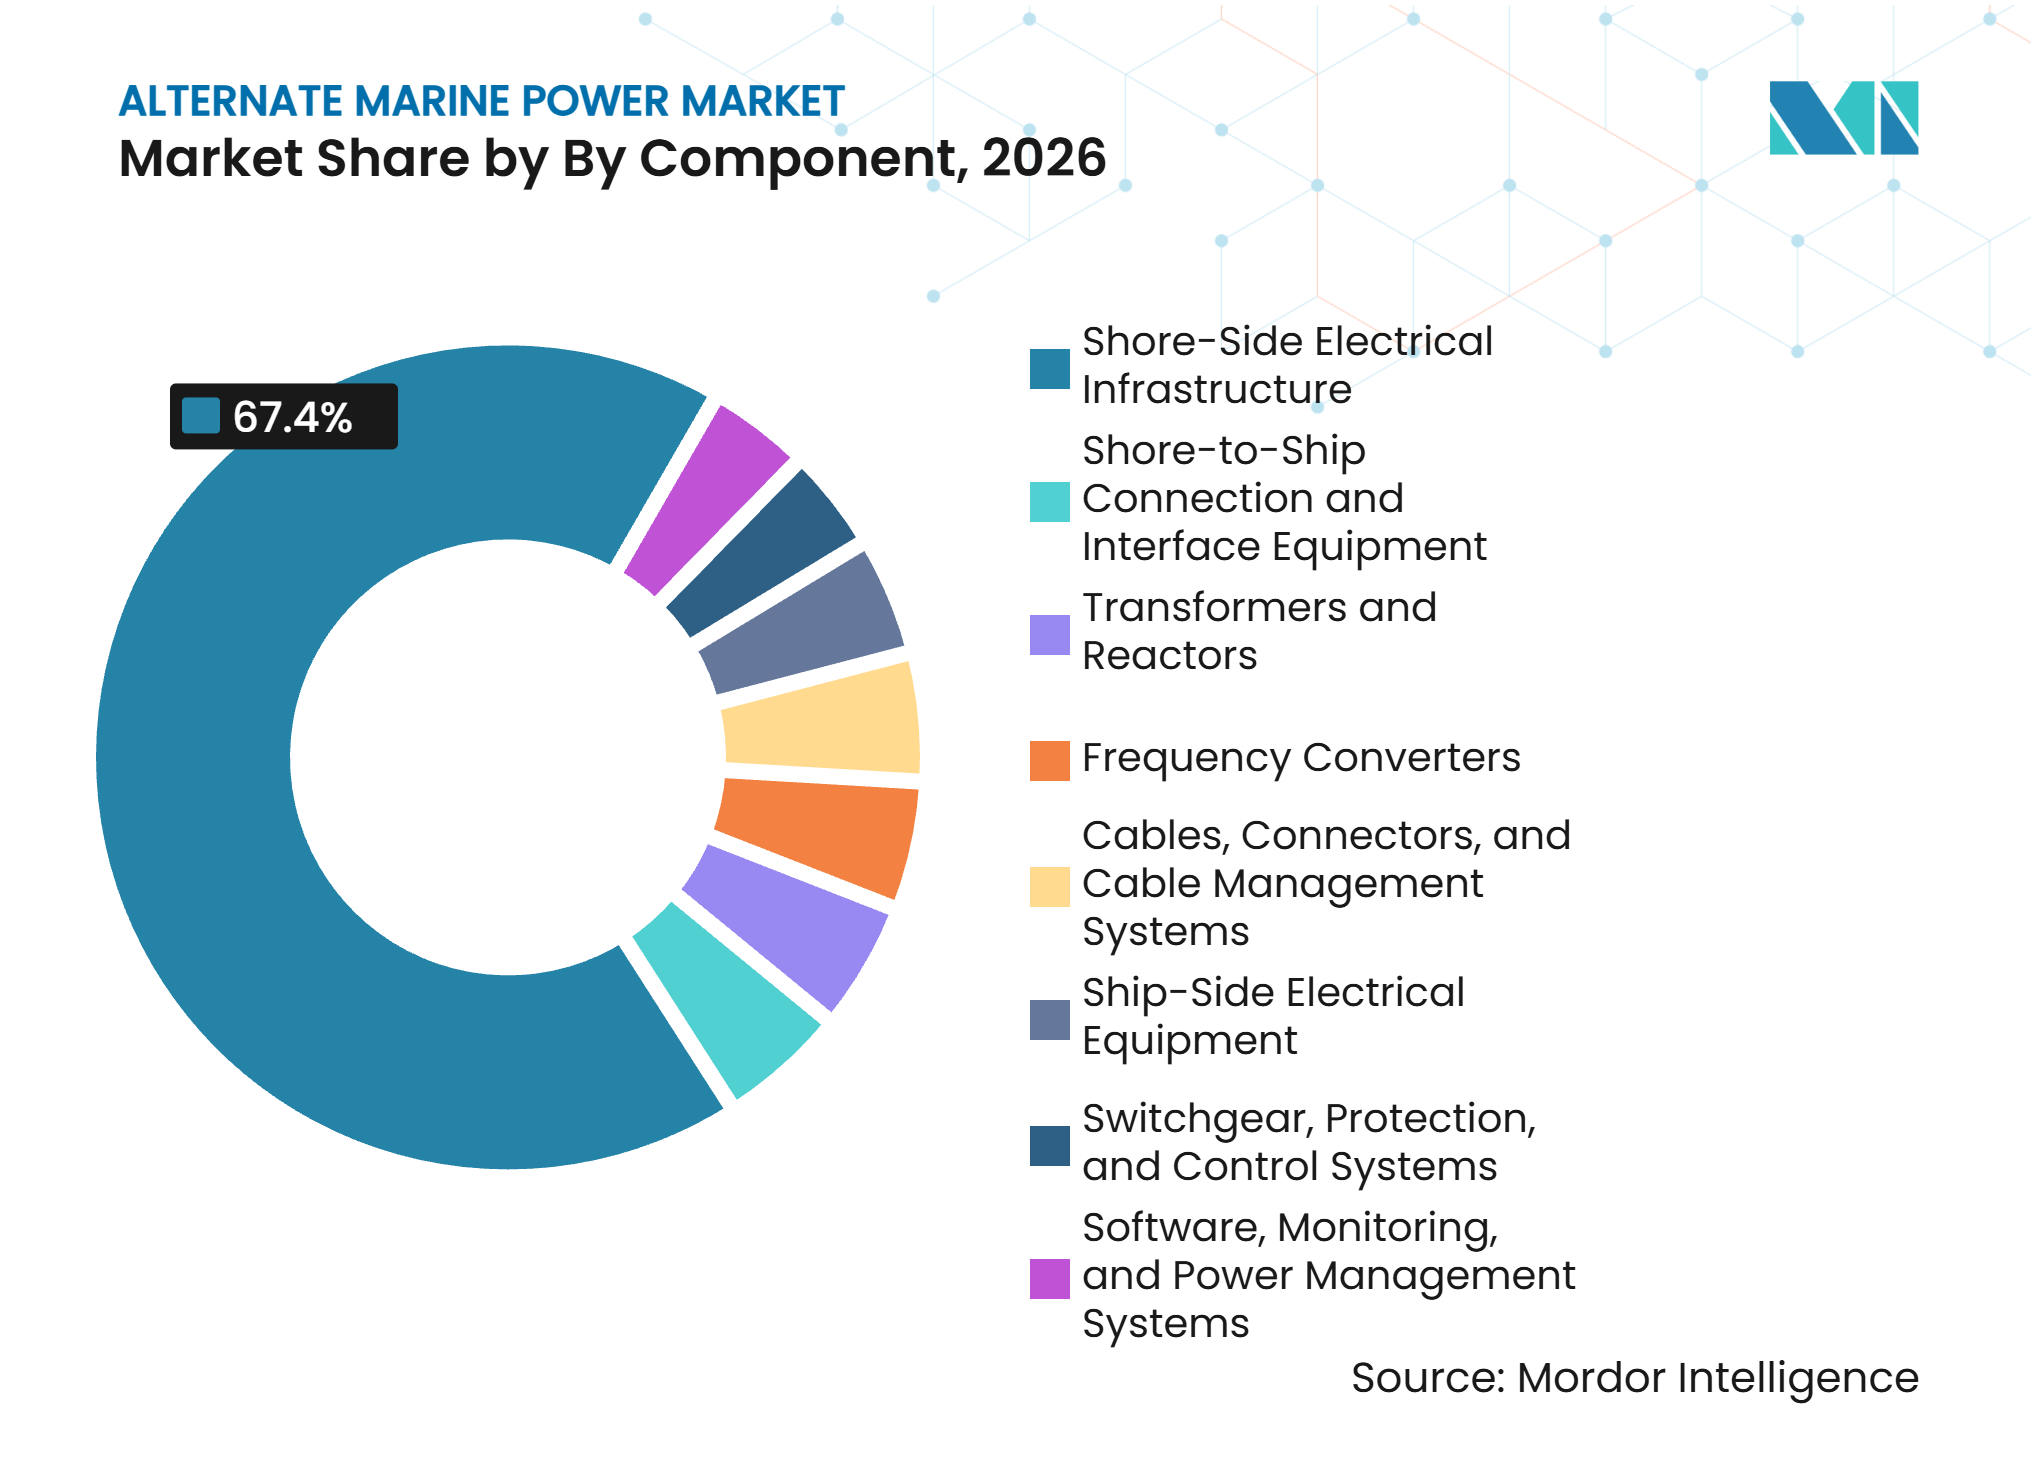
- By component, shore-side electrical infrastructure held 67.4% of revenue in 2026, while transformers and reactors are forecast to grow at a 9.7% CAGR through 2032.
- By connection type, high-voltage shore connection held 61.3% of revenue in 2026 and is forecast to expand at a 9.6% CAGR through 2032.
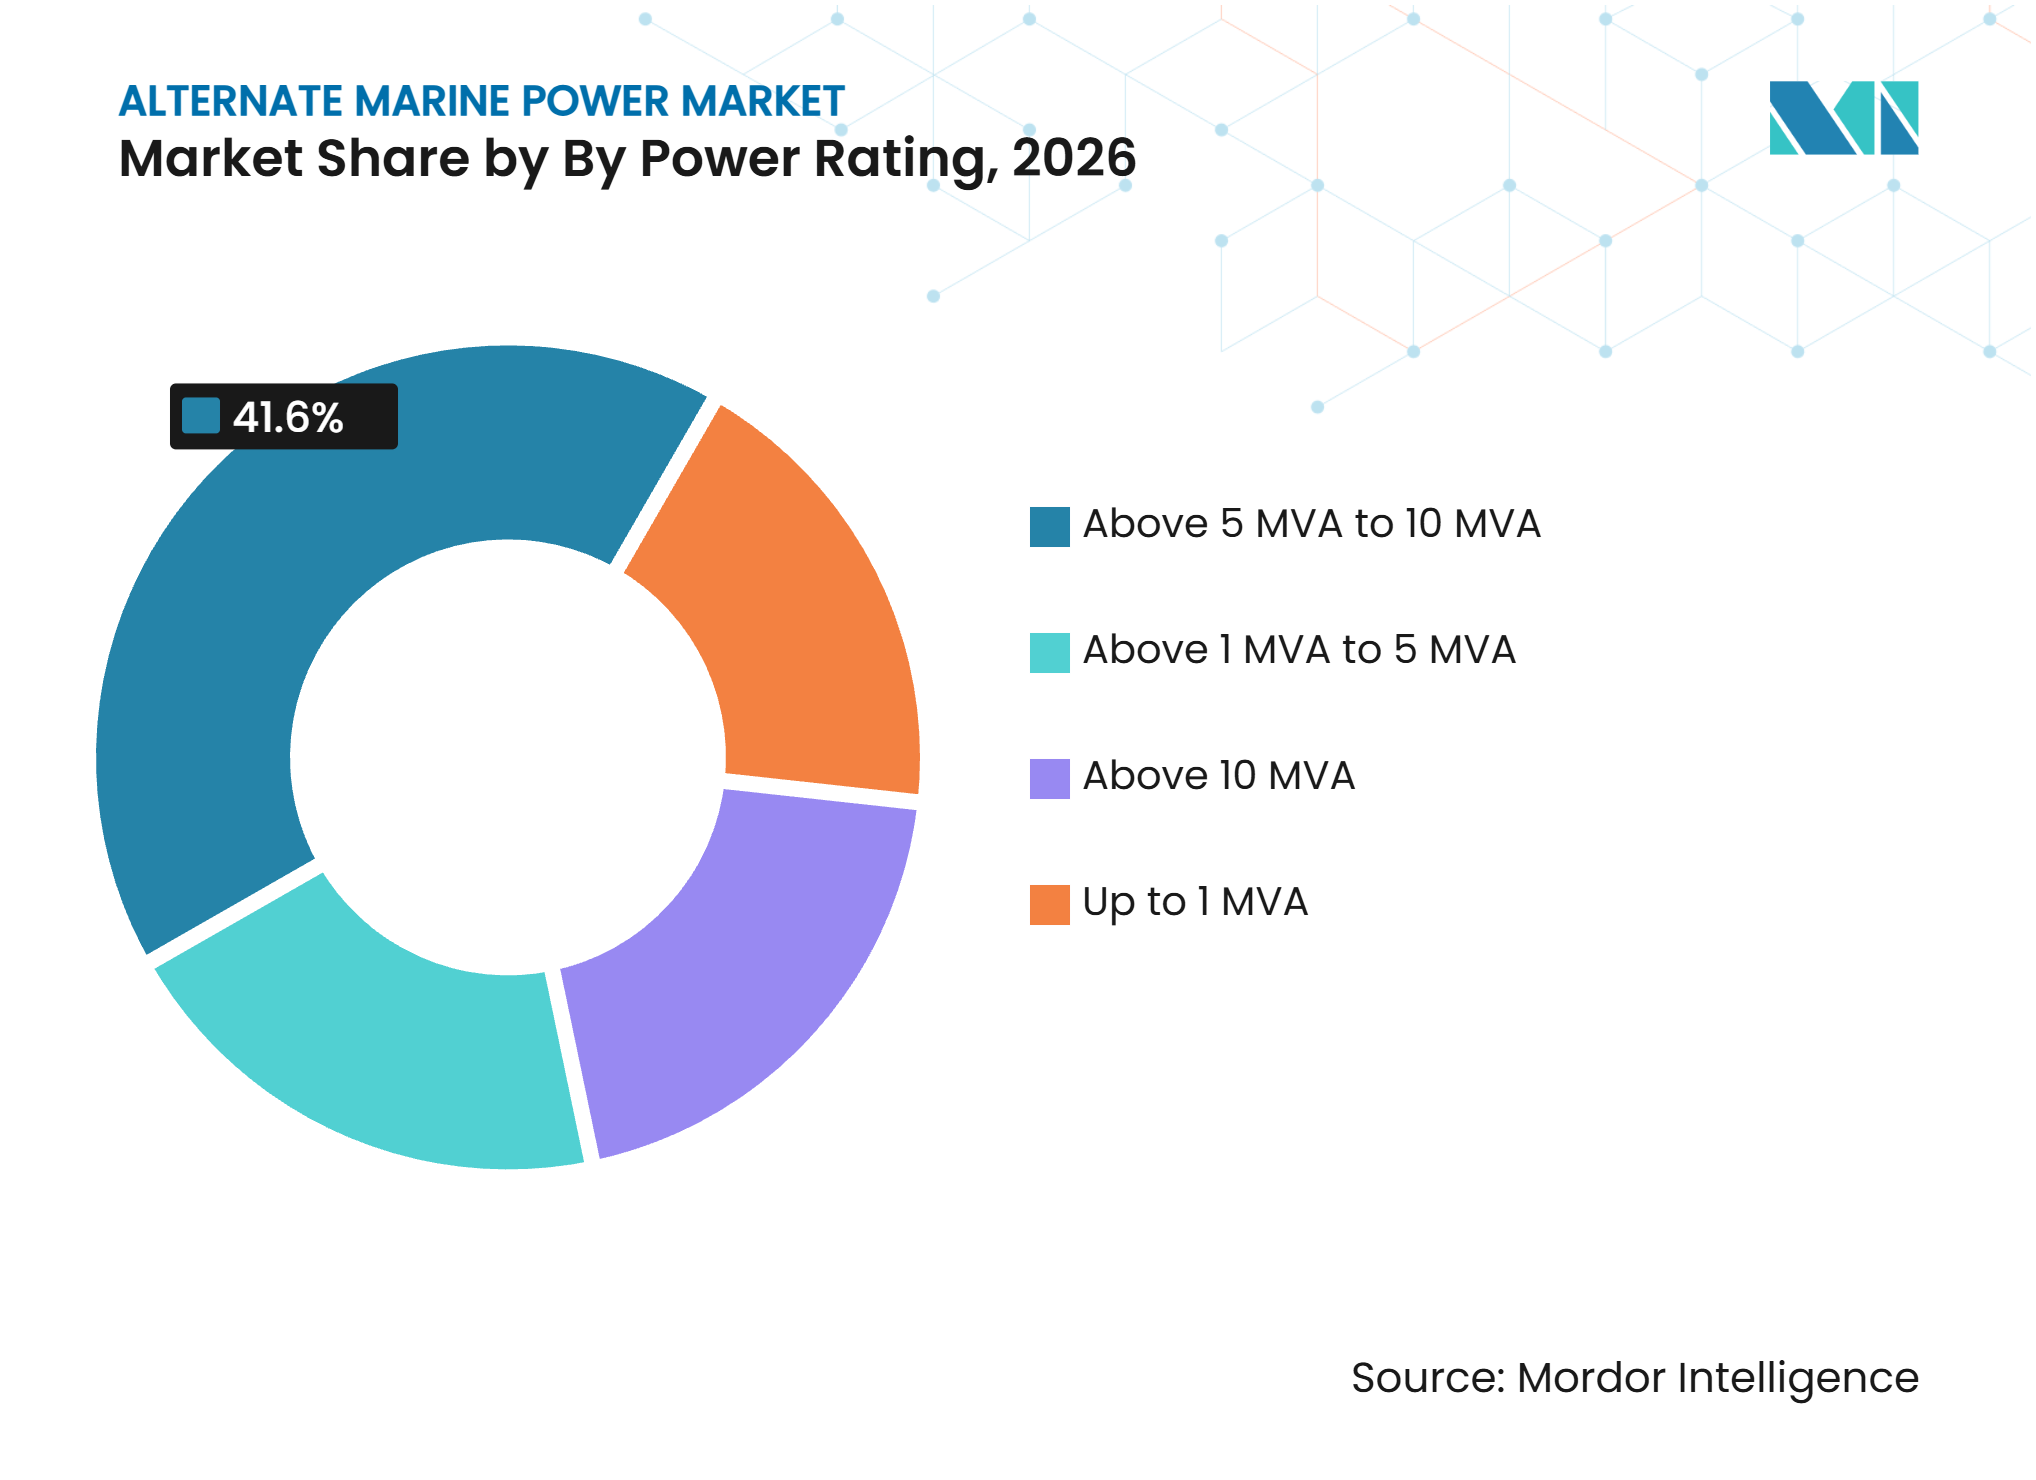
- By power rating, the above-5-MVA-to-10-MVA segment held 41.6% of revenue in 2026, while the above-10-MVA segment is forecast to grow at a 10.1% CAGR through 2032.
- By vessel type, container ships held 35.6% of revenue in 2026, while cruise ships are forecast to grow at a 10.3% CAGR through 2032.
- By geography, Europe held 38.3% of revenue in 2026, while Asia-Pacific is forecast to grow at a 9.9% CAGR in the alternate marine power market through 2032.
Note: Market numbers in this report are based on Mordor Intelligence's proprietary estimation framework, which combines nine months of actuals with Q4 projections for base year 2026.
Market Trends and Insights
Drivers Impact Analysis of Alternate Marine Power Market*
| Driver | (~) % Impact on CAGR Forecast | Geographic Relevance | Impact Timeline |
|---|---|---|---|
| Regulatory Mandates for Zero-Emission Berthing | +2.5% | Global, concentrated in Europe and China, with secondary relevance in North America under CARB | Short term (≤ 2 years) |
| Port Electrification and Modernization Investment | +2.0% | European core markets, with spillover to Asia-Pacific and North America | Medium term (2-4 years) |
| Growth in Cruise and Container Vessel Port-Time | +1.5% | Global, with the highest effect in Europe and Northeast Asia | Medium term (2-4 years) |
| Declining Renewable-Power Cost Relative to Marine Diesel | +1.2% | Global, strongest where renewable grid penetration is high | Long term (≥ 4 years) |
| Port-Microgrid and Battery-Storage Peak Shaving | +1.0% | European core markets, emerging in Asia-Pacific and North America | Medium term (2-4 years) |
| Standardized Automated Shore-Connection Interfaces | +0.8% | Global, supported by the IEC/IEEE 80005 series | Medium term (2-4 years) |
| Source: Mordor Intelligence | |||
Regulatory Mandates for Zero-Emission Berthing
FuelEU Maritime and the Alternative Fuels Infrastructure Regulation (AFIR) establish a clear compliance path for shore power in Europe. Under AFIR, Trans-European Transport Network (TEN-T) maritime ports must provide onshore power for at least 90% of qualifying port calls by 2030. FuelEU Maritime adds the vessel-side connection requirement from the same date, and its first reporting period began in January 2025. The timing makes planning a current operational priority for ports, carriers, and equipment suppliers. China strengthened its own framework in 2025 by requiring coastal vessels to use available shore power after more than 3 hours at berth. The Netherlands also plans national shore-power legislation in 2026, extending enforcement in a major port cluster.[2]
Port Electrification and Modernization Investment
The Alternate Marine Power Market is moving from small demonstrations to large infrastructure programs. European funding mechanisms directed EUR 267 million into shore-power deployment between 2021 and 2025. Rotterdam Shore Power selected ABB in January 2025 to build and maintain systems across 3 container terminals with more than 100 MVA of capacity, 35 connection points, and 8 kilometers of quay. The program is a 50:50 partnership between the Port of Rotterdam Authority and Eneco. This financing model shares capital and technical risks between public and private participants. It also broadens opportunities for providers that can integrate power conversion, connections, maintenance, and energy management.[3]
Growth in Cruise and Container Vessel Port-Time
The Alternate Marine Power Market benefits when longer berth periods and larger vessel loads improve shore-power use. Hamburg recorded 295 cruise calls in its 2025 season, and 71% of shore-power-capable vessels connected. The connection rate increased by more than 25% from the prior year. At the Port of Barcelona Europe South Terminal (BEST) terminal, shore power delivered 3.4 million kWh of renewable electricity in its first year and avoided 2,310 tonnes of CO2. Container vessels at that terminal had average connection times of 54 hours. Higher berth use increases the need for transformers and frequency converters with larger ratings.[4]
Declining Renewable-Power Cost Relative to Marine Diesel
The Alternate Marine Power Market benefits when renewable electricity improves shore-power economics for vessels with long port stays. Shore connection removes auxiliary fuel use and reduces auxiliary engine maintenance while a vessel is at berth. The benefit is relevant for cruise ships with multi-day turnarounds and for container vessels that remain alongside for 24 to 60 hours. A 2025 INNIO Jenbacher assessment found that a cogeneration, solar, and battery microgrid could reduce the levelized cost of energy for shore power by 22%. Thermal integration produced a further 20% energy-cost saving in the study. These economics encourage buyers to focus on long-life reliability as well as initial equipment cost.
Restraints Impact Analysis of Alternate Marine Power Market*
| Restraint | (~) % Impact on CAGR Forecast | Geographic Relevance | Impact Timeline |
|---|---|---|---|
| High Port and Vessel Retrofit Capital Requirements | -2.5% | Global, most acute in European ports facing 2030 deadlines and in emerging markets with limited public financing | Medium term (2-4 years) |
| Grid Capacity and Interconnection Constraints | -2.0% | Europe, North America, and emerging Asia-Pacific markets | Medium term (2-4 years) |
| Uncertain Electricity Tariff Pass-Through and Utilization Payback | -1.5% | Global, with high uncertainty where shore-power pricing frameworks are absent | Long term (≥ 4 years) |
| Vessel-Port Compatibility Gaps on International Routes | -1.2% | Global for tankers, bulk carriers, and Ro-Ro vessels | Long term (≥ 4 years) |
| Source: Mordor Intelligence | |||
High Port and Vessel Retrofit Capital Requirements
The Alternate Marine Power Market faces a major barrier in retrofit costs for ports and shipowners. A 2025 assessment of 31 European ports found that 21% of the 448 shore-power connections needed by 2030 were installed or contracted. Container ships had only 11% of the 294 required connections in place or contracted. Fleet-wide vessel retrofits can take 3 to 7 years because work must be coordinated with drydock schedules. Lloyd’s Register and Capital Ship Management completed the first tanker shore-power compatibility assessment in 2025 for 6 Suezmax newbuilds. The work shows that replicable methods for tanker retrofits are only beginning to emerge.
Grid Capacity and Interconnection Constraints
The Alternate Marine Power Market can face project delays when grid capacity is limited, even where regulations are clear. Simultaneous demand from 3 cruise ships at 10 MW each creates a 30 MW demand spike that many port grids were not built to serve. Battery-integrated microgrids can reduce peak demand, but they add capital costs and engineering complexity. The SPIES project reported in 2025 that existing standards do not fully address smaller power classes. This gap can slow investment by inland shipping operators. The alternate marine power market therefore depends on grid planning and system design as much as on berth-side hardware.
*Our forecasts treat driver/restraint impacts as directional, not additive. The impact forecasts reflect baseline growth, mix effects, and variable interactions.
Alternate Marine Power Market Segment Analysis
By Component:
Shore-Side Infrastructure Anchors Revenue, Transformers Lead GrowthShore-side electrical infrastructure held 67.4% of Alternate Marine Power Market share in 2026. Port authorities carry most of the early capital spending because the equipment is installed at the berth and connects to the local grid. This category includes connection systems, converters, cabling, switchgear, and supporting electrical works. Shore-side investment rises as ports prepare several berths instead of single-vessel pilots. Semi-automated cable-management equipment also reduces manual handling during connection. These systems help ports manage faster turnarounds and more frequent calls.
Transformers and reactors are forecast to grow at a 9.7% CAGR through 2032. High-voltage systems need step-down transformers to supply the 6.6 kV and 11 kV levels covered by IEC/IEEE 80005-1:2025. The 2025 revision tightened harmonic-distortion thresholds and added grid-forming converter provisions. These requirements can increase refresh activity at older sites. Ship-side equipment is also gaining relevance as operators specify shore-power-ready hardware for newbuilds. Software and power-management tools are emerging as ports coordinate equipment, availability, and energy use.



By Connection Type:
High-Voltage Shore Connection (HVSC) Consolidates as Standard, Low-Voltage Shore Connection (LVSC) Enters Rapid-Charging TerritoryHigh-voltage shore connection accounted for 61.3% of revenue in the Alternate Marine Power Market in 2026 and is projected to grow at a 9.6% CAGR through 2032. It is suited to ocean-going vessels that require more than 1 MVA while alongside. IEC/IEEE 80005-1:2025 covers transformer, converter, and power-management requirements for this configuration. The standard reinforces 6.6 kV and 11 kV as the reference voltages. Large terminals need extensive high-voltage cabling and converter stations. This gives an advantage to suppliers with experience in major electrical projects.
Low-voltage shore connection serves ferries, inland waterway craft, and short-sea ships. IEC/IEEE 80005-3:2025 establishes the general requirements for these systems. Norwegian Electric Systems received an April 2025 contract to supply 3 containerized 4 MW DC charging stations for Norled. The stations use a megawatt charging architecture with water-cooled power electronics. This application brings rapid charging closer to conventional shore-power installations. AFIR also requires TEN-T core inland ports to provide at least 1 shore-side connection, supporting related demand across European waterways.
By Power Rating:
Mid-Range Installations Dominate Today, Ultra-High Power Grows FastestThe above-5-MVA-to-10-MVA band held 41.6% of revenue in the alternate marine power market in 2026. It meets hotel-load requirements for 12,000-to-18,000 TEU container ships and many current cruise vessels. These vessel types are central to Europe’s 2030 shore-power requirements. Port of Kiel completed a 16 MVA extension at Ostseekai in early 2026. The project allows 2 cruise ships to receive electricity at the same time. Such projects indicate the scale required at competitive cruise terminals.
The above-10-MVA segment is forecast to expand at a 10.1% CAGR through 2032. Ultra-large container vessels with more than 20,000 TEUs and newer LNG-hybrid cruise ships require power beyond legacy installation capacity. The 1-MVA-to-5-MVA range serves ferries and Ro-Ro vessels. Norwegian Electric Systems secured a January 2025 contract for power systems on 8 Wilson 6,300-DWT bulk carriers. The sub-1-MVA category supports inland and smaller coastal facilities. Battery systems can make these smaller installations more feasible where grid reinforcement is not viable.

By Vessel Type:
Container Ships Drive Volume, Cruise Ships Drive Value and Speed of GrowthContainer ships held 35.6% of revenue in the alternate marine power market in 2026. They accounted for 66% of required shore-power connection points across the 31 European ports assessed in 2025. Only 11% of these required container connections were installed or contracted. This leaves a large portion of demand still to be addressed. Cavotec received orders totaling EUR 9.35 million in October 2025 for vessel-side systems on container-ship retrofits and newbuilds. The deliveries extend through the end of 2026.
Cruise ships are the fastest-growing segment in the alternate marine power market, with a forecast CAGR of 10.3% through 2032. Transport & Environment estimated that the average cruise vessel emitted 5,148 tonnes of CO2 in European ports each year. It attributed 80% of that volume to auxiliary engines that shore power can replace. Copenhagen’s facility opened in summer 2025 and is projected to connect 79% of cruise guest arrivals in 2026. Full capacity is expected in 2028. Passenger vessels and ferries have more established low-voltage standards, while tanker and bulk-carrier compatibility is still developing.
Geography Analysis
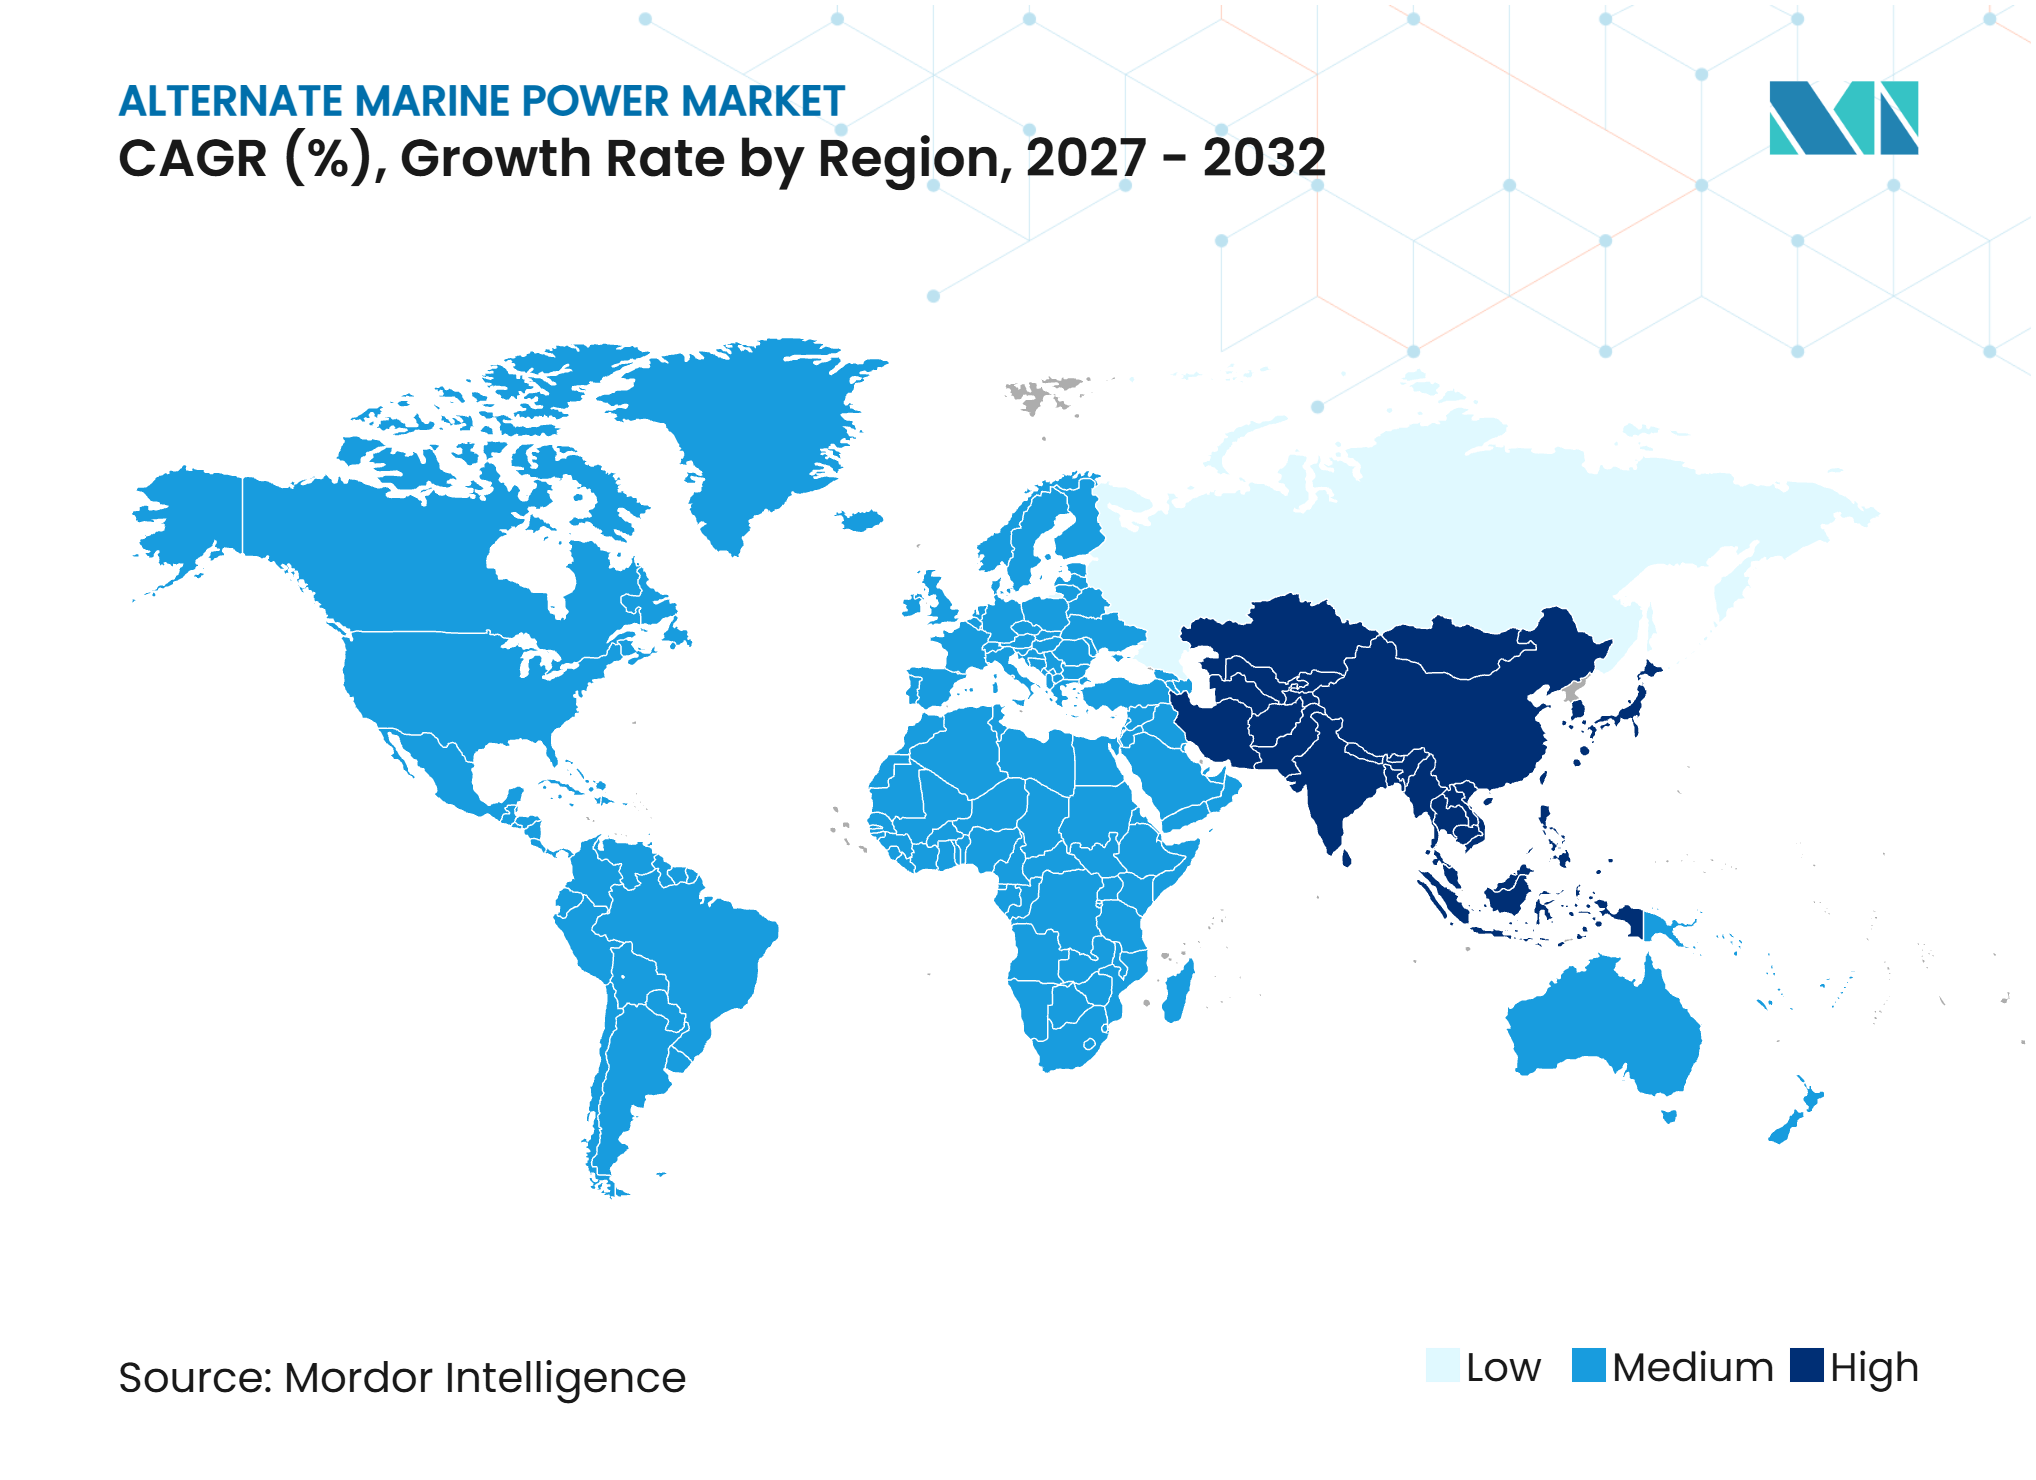
Europe held 38.3% of the Alternate Marine Power Market share in 2026. AFIR and FuelEU Maritime provide the strongest regulatory framework and set a firm 2030 timetable. The Netherlands plans to implement national legislation in 2026 to implement related European requirements. ABB’s Toulon system has operated since February 2025 and combines battery storage, solar panels, and a 20 kV grid connection. It can supply 3 ferries or 1 cruise ship at the same time. The installation shows the integrated energy design expected at larger European projects.
Asia-Pacific is forecast to grow at a 9.9% CAGR in the Alternate Marine Power Market through 2032. China’s mandatory shore-power policy is a central driver, and private capital is adding to public infrastructure spending. Guangzhou Port achieved full shore-power berth coverage by December 2025. It delivered more than 17 million kWh of shore power and reduced emissions by 11,730 tonnes in 2025. Ningbo-Zhoushan Port invested CNY 150 million, equivalent to USD 21 million, in related infrastructure at international container terminals. The Wah Kwong NatPower Holdings venture targets shore power at more than 30 Asian ports by 2030 under a charge-point operator model.
The Alternate Marine Power Market in North America is shaped mainly by California’s At Berth Regulation for container, cruise, and Ro-Ro vessels. Seattle recorded 1.9 million cruise passengers in its 2025 season. Shore-power-capable vessels accounted for 54% of its home-port calls. The Northwest Ports Clean Air Strategy targets shore power at major cruise and container berths by 2030. Canadian research in 2025 reported no tanker shore-power connections at Canadian ports and no high-voltage shore power at Great Lakes ports. South America and the Middle East and Africa remain early-stage areas where individual concessions play a larger role than national mandates.
Competitive Landscape
Market Concentration
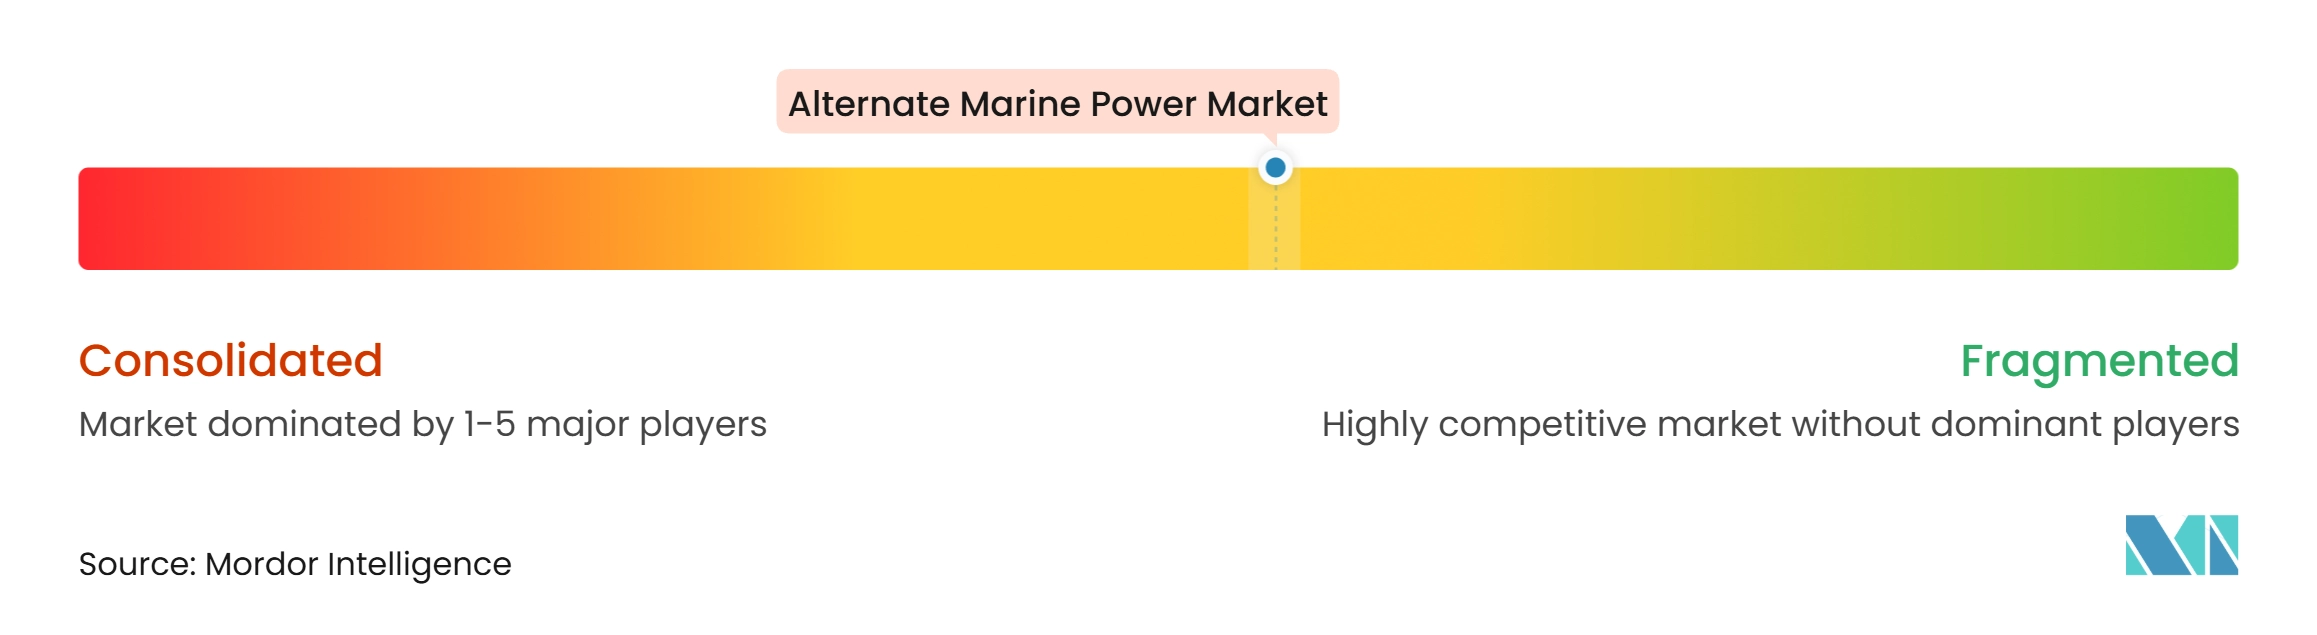
The alternate marine power market is moderately fragmented. Large power and automation companies including ABB, Siemens, Hitachi Energy, GE Vernova, and Schneider Electric compete for large turnkey programs. Specialists including Cavotec, PowerCon, Wärtsilä, Stemmann-Technik, and Norwegian Electric Systems compete through connection equipment and vessel-side integration. ABB has a broad portfolio that includes the Rotterdam container-terminal award and the Toulon installation. Wärtsilä has installed its containerized shore-power platform on approximately 150 vessels. These capabilities make vessel retrofit experience an important differentiator.
Large projects are consolidating demand in the alternate marine power market among suppliers able to manage complex electrical works. Rotterdam Shore Power selected ABB in 2025 for 3 deep-sea container terminals with more than 100 MVA of combined capacity. The program has 35 connection points over 8 kilometers of quay. In Scotland, ABB won an October 2025 contract to provide power and propulsion systems for 7 all-electric CMAL ferries. The work also includes shore-connection technology for multiple ferry terminals. Siemens Energy signed 5 contracts valued at USD 65 million in November 2025 for cruise-port electrification in Nassau.
Grid-constrained ports create an opening for integrated microgrid solutions in the alternate marine power market. INNIO Jenbacher has shown a cogeneration, solar, and battery approach that could support shore power where grid supply is limited. The charge-point operator model offers another route by funding, building, and operating infrastructure without full upfront port spending. Wah Kwong NatPower Holdings demonstrates this model in Asia. IEC/IEEE 80005 compliance is becoming a basic qualification for suppliers. Competition is therefore moving toward power quality, reliability, software, and automated connection systems. Market concentration score is 5 out of 10 because no combined top-player share is provided and the presence of diversified suppliers and specialists indicates a moderately fragmented field.
Alternate Marine Power Industry Leaders
-
Siemens AG
-
ABB Ltd.
-
Schneider Electric SE
-
Cavotec SA
-
Wärtsilä Corporation
- *Disclaimer: Major Players sorted in no particular order
Alternate Marine Power Market Companies Covered in this Report
- ABB Ltd.
- Blueday Technology AS
- Cavotec SA
- Danfoss A/S
- Eaton Corporation plc
- ESL Power Systems, Inc.
- GE Vernova Inc.
- Hitachi Energy Ltd.
- igus GmbH
- MJR Power & Automation Limited
- Nidec ASI S.p.A.
- Norwegian Electric Systems AS
- PowerCon A/S
- Schneider Electric SE
- Siemens AG
- Stemmann-Technik GmbH
- VINCI Energies S.A.
- Wabtec Corporation
- Wartsila Corporation
- Yara Marine Technologies AS
Recent Industry Developments in Alternate Marine Power Market
- November 2025: Siemens Energy signed five contracts totaling USD 65 million to electrify Nassau’s cruise port in the Bahamas, encompassing ship-to-shore electrification, a combined-cycle gas turbine power plant, and grid interconnection, targeting up to 140,000 tonnes of CO2 reduction annually by replacing diesel-powered generation on docked cruise ships.
- October 2025: ABB won a contract with Remontowa Shipbuilding to deliver power and propulsion systems for 7 all-electric double-ended ferries for Caledonian Maritime Assets in Scotland, and was separately selected to supply shore-connection technology across multiple CMAL ferry terminals, with vessel deliveries between late 2027 and early 2029.
- October 2025: Cavotec signed 2 orders totaling EUR 9.35 million with a leading global container shipping company for shore-power systems on existing-vessel retrofits and newbuilds, with deliveries through the end of 2026 across Asia, Europe, and the United States trade lanes.
- September 2025: NatPower Marine and Wah Kwong Maritime launched Wah Kwong NatPower Holdings, a joint venture targeting shore power at more than 30 Asian ports by 2030 under a charge-point operator model, with initial Hong Kong projects planned for 2026 and a global program of GBP 10 billion, equivalent to USD 12.7 billion, targeting 120 electrified port locations.
Global Alternate Marine Power Market Report Scope
Alternate marine power (AMP), also known as shore power or cold ironing, refers to electrical power supplied to ships from shore-based electricity infrastructure while they are berthed at ports, allowing vessels to shut down their onboard auxiliary engines during port stays. These systems typically comprise shore-side electrical infrastructure, ship-side electrical equipment, shore-to-ship connection and interface equipment, transformers, frequency converters, cables, connectors, switchgear, protection and control systems, and power management and monitoring software. Alternate marine power systems are designed to accommodate variations in vessel electrical requirements, onboard voltage and frequency specifications, and port infrastructure capabilities. They are used across container ships, cruise ships, passenger vessels, ferries, tankers, bulk carriers, Ro-Ro vessels, general cargo ships, and other marine vessels. By enabling vessels to receive electricity from the port grid or other shore-based power sources, AMP systems help reduce the use of onboard auxiliary engines during berthing, potentially lowering local air pollutant emissions, noise, and fuel consumption. The environmental benefits depend on the electricity generation mix, vessel operating conditions, and the extent of shore power utilization.
The Global Alternate Marine Power Market is segmented by component, connection type, power rating, and vessel type. By component, the market is segmented into shore-side electrical infrastructure, ship-side electrical equipment, shore-to-ship connection and interface equipment, transformers and reactors, frequency converters, cables, connectors and cable management systems, switchgear, protection and control systems, and software, monitoring and power management systems. By connection type, the market is segmented into high-voltage shore connection (HVSC) and low-voltage shore connection (LVSC). By power rating, the market is segmented into up to 1 MVA, above 1 MVA to 5 MVA, above 5 MVA to 10 MVA, and above 10 MVA. By vessel type, the market is segmented into container ships, cruise ships, passenger ships and ferries, tankers, bulk carriers, Ro-Ro and Ro-Pax vessels, general cargo ships, naval and government vessels, and other vessel types. The report also covers the market size and forecasts for the global alternate marine power market across 26 countries in key regions, including North America, Europe, Asia-Pacific, South America, and the Middle East and Africa. For each segment, market sizing and forecasts are provided on the basis of value (USD).
Segmentation Overview
| Shore-Side Electrical Infrastructure |
| Ship-Side Electrical Equipment |
| Shore-to-Ship Connection and Interface Equipment |
| Transformers and Reactors |
| Frequency Converters |
| Cables, Connectors, and Cable Management Systems |
| Switchgear, Protection, and Control Systems |
| Software, Monitoring, and Power Management Systems |
| High-Voltage Shore Connection (HVSC) |
| Low-Voltage Shore Connection (LVSC) |
| Up to 1 MVA |
| Above 1 MVA to 5 MVA |
| Above 5 MVA to 10 MVA |
| Above 10 MVA |
| Container Ships |
| Cruise Ships |
| Passenger Ships and Ferries |
| Tankers |
| Bulk Carriers |
| Ro-Ro and Ro-Pax Vessels |
| General Cargo Ships |
| Naval and Government Vessels |
| Other Vessel Types |
| North America | United States |
| Canada | |
| Mexico | |
| Europe | Germany |
| France | |
| Italy | |
| Spain | |
| United Kingdom | |
| Poland | |
| Netherlands | |
| Russia | |
| Rest of Europe | |
| Asia-Pacific | China |
| India | |
| Japan | |
| South Korea | |
| Australia | |
| Indonesia | |
| Malaysia | |
| Thailand | |
| Philippines | |
| Rest of Asia-Pacific | |
| South America | Brazil |
| Argentina | |
| Colombia | |
| Rest of South America | |
| Middle East and Africa | Saudi Arabia |
| United Arab Emirates | |
| South Africa | |
| Kenya | |
| Egypt | |
| Nigeria | |
| Rest of Middle East and Africa |
| By Component | Shore-Side Electrical Infrastructure | |
| Ship-Side Electrical Equipment | ||
| Shore-to-Ship Connection and Interface Equipment | ||
| Transformers and Reactors | ||
| Frequency Converters | ||
| Cables, Connectors, and Cable Management Systems | ||
| Switchgear, Protection, and Control Systems | ||
| Software, Monitoring, and Power Management Systems | ||
| By Connection Type | High-Voltage Shore Connection (HVSC) | |
| Low-Voltage Shore Connection (LVSC) | ||
| By Power Rating | Up to 1 MVA | |
| Above 1 MVA to 5 MVA | ||
| Above 5 MVA to 10 MVA | ||
| Above 10 MVA | ||
| By Vessel Type | Container Ships | |
| Cruise Ships | ||
| Passenger Ships and Ferries | ||
| Tankers | ||
| Bulk Carriers | ||
| Ro-Ro and Ro-Pax Vessels | ||
| General Cargo Ships | ||
| Naval and Government Vessels | ||
| Other Vessel Types | ||
| By Geography | North America | United States |
| Canada | ||
| Mexico | ||
| Europe | Germany | |
| France | ||
| Italy | ||
| Spain | ||
| United Kingdom | ||
| Poland | ||
| Netherlands | ||
| Russia | ||
| Rest of Europe | ||
| Asia-Pacific | China | |
| India | ||
| Japan | ||
| South Korea | ||
| Australia | ||
| Indonesia | ||
| Malaysia | ||
| Thailand | ||
| Philippines | ||
| Rest of Asia-Pacific | ||
| South America | Brazil | |
| Argentina | ||
| Colombia | ||
| Rest of South America | ||
| Middle East and Africa | Saudi Arabia | |
| United Arab Emirates | ||
| South Africa | ||
| Kenya | ||
| Egypt | ||
| Nigeria | ||
| Rest of Middle East and Africa | ||
Key Questions Answered in the Report
What is driving demand for Alternate Marine Power Systems?
FuelEU Maritime, AFIR requirements, China’s 2025 rules, and major port electrification programs are increasing demand for shore-power equipment.
How large is the Alternate Marine Power Market?
The sector is valued at USD 2.21 billion in 2026 and is forecast to reach USD 3.79 billion by 2032, at a 9.45% CAGR.
Which connection type is most widely used?
High-voltage shore connection led with 61.3% of revenue in 2026 and is forecast to grow at a 9.6% CAGR through 2032.
Which vessels create the strongest opportunity for shore power?
Container ships led with 35.6% of revenue in 2026, while cruise ships are forecast to grow fastest at a 10.3% CAGR.
Which region leads shore-power deployment?
Europe held 38.3% of revenue in 2026, while Asia-Pacific is forecast to record the fastest regional growth at a 9.9% CAGR.
What challenges can delay shore-power projects?
High retrofit costs, limited grid capacity, tariff uncertainty, and vessel-port compatibility gaps can delay adoption.