
Uruguay Agriculture Market Analysis by Mordor Intelligence
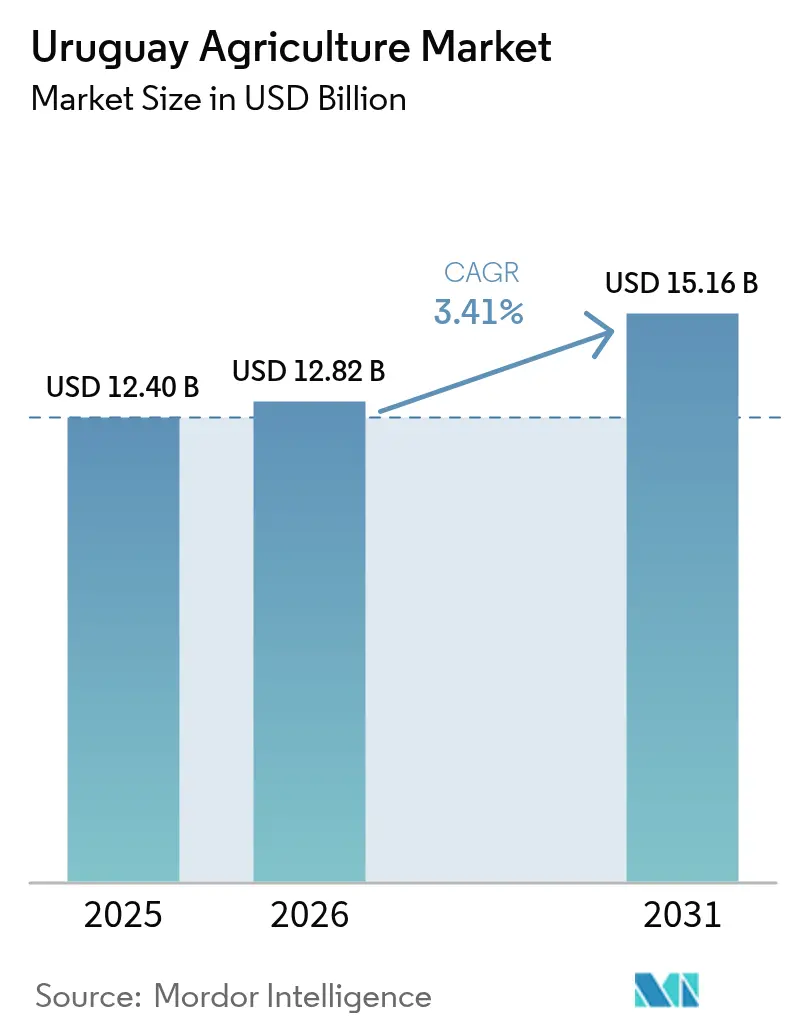
The Uruguay agriculture market size was valued at USD 12.40 billion in 2025 and estimated to grow from USD 12.82 billion in 2026 to reach USD 15.16 billion by 2031, at a CAGR of 3.41% during the forecast period (2026-2031). Robust soybean flows into China, widening carbon-credit revenue for grass-fed beef, and steady irrigation roll-outs are lifting margins even as the 4 million hectare land cap channels growth into yield gains rather than acreage gains. Export premiums tied to verified sustainability attributes keep bulk commodities competitive against larger Brazilian and Argentine suppliers, while digital farm tools are trimming unit costs for rice and wheat growers. Yet, inland logistics that cost 8% to 12% more than neighboring countries and an aging farm workforce continue to pressure operating ratios. Across all segments, the Uruguay agriculture market is expected to keep expanding as policy, technology, and niche premium channels converge.
Key Report Takeaways
- By consumption volume, cereals retained a 35.00% weight in 2025, while fruit demand is rising at a 7.55% CAGR to 2031.
Note: Market size and forecast figures in this report are generated using Mordor Intelligence’s proprietary estimation framework, updated with the latest available data and insights as of 2026.
Uruguay Agriculture Market Trends and Insights
Drivers Impact Analysis*
| Driver | (~) % Impact on CAGR Forecast | Geographic Relevance | Impact Timeline |
|---|---|---|---|
| Expanding soybean-to-China export corridor | +0.9% | Soriano, Río Negro, and Paysandú | Medium term (2-4 years) |
| Diversification into high-value citrus and blueberry crops | +0.7% | Salto, Paysandú, and Canelones | Long term (≥ 4 years) |
| Digitization of farm management | +0.5% | Large commercial farms nationwide | Medium term (2-4 years) |
| Expansion of irrigation infrastructure via Public-Private Partnerships (PPPs) | +0.4% | Treinta y Tres, Cerro Largo, and Rocha | Long term (≥ 4 years) |
| Carbon-credit revenue streams for grass-fed beef | +0.3% | Pilot ranches in Tacuarembó and Rivera | Long term (≥ 4 years) |
| Adoption of no-till practices raises yields | +0.3% | Southern grain belt | Short term (≤ 2 years) |
| Source: Mordor Intelligence | |||
Expanding Soybean-to-China Export Corridor
The bilateral protocol signed in 2024 removed a 30% tariff and opened a direct premium pathway for 1.2 million metric tons of non-genetically modified soybeans into Chinese crushers [1]Source: National Agricultural Research Institute, “INIA Annual Report 2024,” inia.uy. Pre-clearance at origin now trims four to six days off port dwell time in Shanghai and Qingdao, cutting spoilage. COFCO International has responded by scaling on-farm storage that circumvents Nueva Palmira bottlenecks. Electronic phytosanitary certificates mandated by the Ministry of Livestock, Agriculture and Fisheries match Chinese customs protocols, lowering compliance risk. These steps collectively widen netbacks for growers and anchor new investment in identity-preserved supply chains within the Uruguay agriculture market.
Diversification into High-Value Citrus and Blueberry Crops
Blueberry area is expanding at 8.3% a year because protected shade systems add three to four harvesting weeks per cycle. Direct shipping contracts now cut Rotterdam transit to 21 days, improving cold-chain yields. Citrus growers are switching from Valencia oranges to premium seedless tangerines that earn 40% higher free-on-board prices. Drip irrigation financed by the Inter-American Development Bank stabilizes output during erratic rainfall. The momentum strengthens off-season revenue streams and diversifies the Uruguay agriculture market beyond row crops.
Digitization of Farm Management
Precision platforms cover 22% of commercial farms, double the 2022 rate, as variable-rate fertilizer rigs and drone scouting shrink input waste [2]Source: Uruguay XXI, “Trade Report 2024,” uruguayxxi.gub.uy. National Agricultural Research Institute plots show 18% to 25% water savings through sensor-driven irrigation. Bundled advisory apps with HB4 drought-tolerant wheat guide planting and fungicide timing. A USD 12 million government extension program trains 3,500 smallholders on digital traceability, aligning them with export documentation needs. Digital uptake increases productivity and transparency across the Uruguay agriculture market.
Expansion of irrigation infrastructure via Public-Private Partnerships (PPPs)
Three new multipurpose dams financed by a World Bank-led USD 85 million facility add 15,000 hectares of irrigated land in the eastern rice belt [3]Source: World Bank, “Uruguay Portfolio 2024,” worldbank.org. Reservoir access lifts rice yields to 6.77 metric tons per hectare versus 5.8 metric tons on rain-fed plots. Double-cropping options and improved soil carbon further enhance gross returns. Pension-fund co-investment illustrates domestic capital alignment with rural infrastructure. Expanded water security reduces climate risk premiums embedded in Uruguay agriculture market transactions.
Restraints Impact Analysis*
| Restraint | (~) % Impact on CAGR Forecast | Geographic Relevance | Impact Timeline |
|---|---|---|---|
| Limited arable land expansion potential | -0.5% | Nationwide, most acute in the southern grain belt | Long term (≥ 4 years) |
| High on-farm energy and logistics costs | -0.3% | Northern livestock zones and national ports | Medium term (2-4 years) |
| An aging rural workforce and skill shortages | -0.2% | Tacuarembó, Rivera, and Salto | Long term (≥ 4 years) |
| Volatility in global commodity prices | -0.2% | Export-oriented soybean and beef segments | Short term (≤ 2 years) |
| Source: Mordor Intelligence | |||
Limited Arable Land Expansion Potential
Cropland is capped at 4 million hectares under strict zoning that shields native grasslands and wetlands. Cash rents have climbed to USD 280–320 per hectare, squeezing margins for new entrants. Blueberry and citrus expansion competes for the same well-drained soils near packing hubs, limiting scale to roughly 10,000 hectares. Yield-focused technology is therefore the only viable growth lever. This structural ceiling tempers long-run velocity in the Uruguay agriculture market.
High On-Farm Energy and Logistics Costs
Diesel averages USD 1.35 per liter, up to 25% more than regional peers because of import tariffs and markups. Port charges at Montevideo and Nueva Palmira add USD 22–28 per metric ton, versus USD 18–20 in Brazilian terminals. Poor road surfaces in the north send livestock 400–600 kilometers by truck, inflating freight outlays. Port delays of three days cut on-time shipment rates to 63%. Elevated cost structures chip away at the Uruguay agriculture market’s free-on-board competitiveness.
*Our forecasts treat driver/restraint impacts as directional, not additive. The impact forecasts reflect baseline growth, mix effects, and variable interactions.
Geography Analysis
The southern grain belt of Soriano, Colonia, and Río Negro captured 57.62% of the Uruguay agriculture market share in 2025, driven by deep loam soils and short hauls to Nueva Palmira and Montevideo ports. Its dominance lifts absolute output and anchors bulk export flows that underpin national trade balances. In contrast, the eastern rice belt spanning Treinta y Tres, Cerro Largo, and Rocha is the fastest-growing cluster and is projected to expand at a 4.32% CAGR between 2026 and 2031 as new reservoirs unlock double-cropping potential. Together, the two zones illustrate how balanced specialization sustains overall Uruguay agriculture market size growth.
The northern livestock corridor of Tacuarembó, Rivera, and Salto grazes 65% of the national cattle inventory and is scaling regenerative systems that monetize carbon credits. Blueberry and citrus hubs in Salto, Paysandú, and Canelones benefit from well-drained soils and proximity to cool-chain infrastructure that enables forty-eight-hour air freight to North America and Europe. Central dairy counties around Florida and San José maintain year-round pasture that feeds Conaprole’s high-capacity processing plants. These diverse micro-regions collectively hedge climate risk and broaden product portfolios for exporters.
Across all regions, expanded irrigation, universal no-till adoption, and digital farm tools are narrowing yield gaps and reinforcing resilience against future droughts. Reservoir projects in the east reduce rainfall dependency, while precision fertilization in the south trims unit costs and curbs runoff. Livestock zones are layering blockchain traceability onto carbon-credit programs, opening premium channels in the European Union and China. Continued infrastructure investment and technology diffusion are expected to keep regional output on an upward trajectory, further enlarging Uruguay agriculture market size through 2030.
Regulatory Landscape
The Uruguay agriculture market is regulated primarily by the Ministerio de Ganaderia, Agricultura y Pesca (MGAP), with the Direccion General de Servicios Agricolas (DGSA) overseeing key compliance processes for crop production, including registration and control of plant protection products and other agricultural inputs. Recent policy moves point to tighter governance around input use and trade documentation. Resolution N 22/024 created a dedicated register for phytosanitary products intended solely for export, with a 6-year validity period, supporting export compliance while keeping domestic safeguards in place.
Sustainability-linked requirements are also shaping farm practices and input choices. Uruguay mandates soil management and crop rotation plans for producers operating over 50 hectares, which supports erosion control and long-term productivity under the national land-use framework. Decree N 42/025 formalized the National Bioinputs Plan (PNB), aligned with the 2024-2026 Sustainable Bioeconomy Action Plan, reinforcing an official shift toward integrated pest management and more biological tool adoption as the country works toward its 2030 synthetic chemical plant protection use-reduction targets.
Value Chain Analysis
Uruguay agriculture value chain coverage spans upstream inputs (seeds, crop protection, fertilizers, machinery, and irrigation equipment), farm production across grains, oilseeds, rice, fruits, and livestock, and then aggregation, processing, and export logistics. MGAP sets and enforces core production and trade rules, INIA supports varietal development and applied agronomy, and INAC underpins meat-sector standards and market access. Cooperatives and mid-tier merchants provide input finance and advisory services to a fragmented base of family farms, while large traders and processors (including Cargill, ADM, COFCO International, and Louis Dreyfus Company) anchor storage, origination, and export programs tied to ports such as Montevideo and Nueva Palmira.
Downstream performance depends heavily on infrastructure and compliance capability. Port and inland logistics limits can reduce reliability during peak harvest periods, raising delivered costs and keeping attention on on-farm storage, elevator networks, and scheduling discipline. At the same time, digital traceability and electronic phytosanitary processes are increasingly embedded in commercial flows, tightening connections between farms, aggregators, laboratories or certifiers, and exporters, and increasing the value of service providers that can manage documentation, identity-preserved lots, and sustainability attributes.
Competitive Landscape
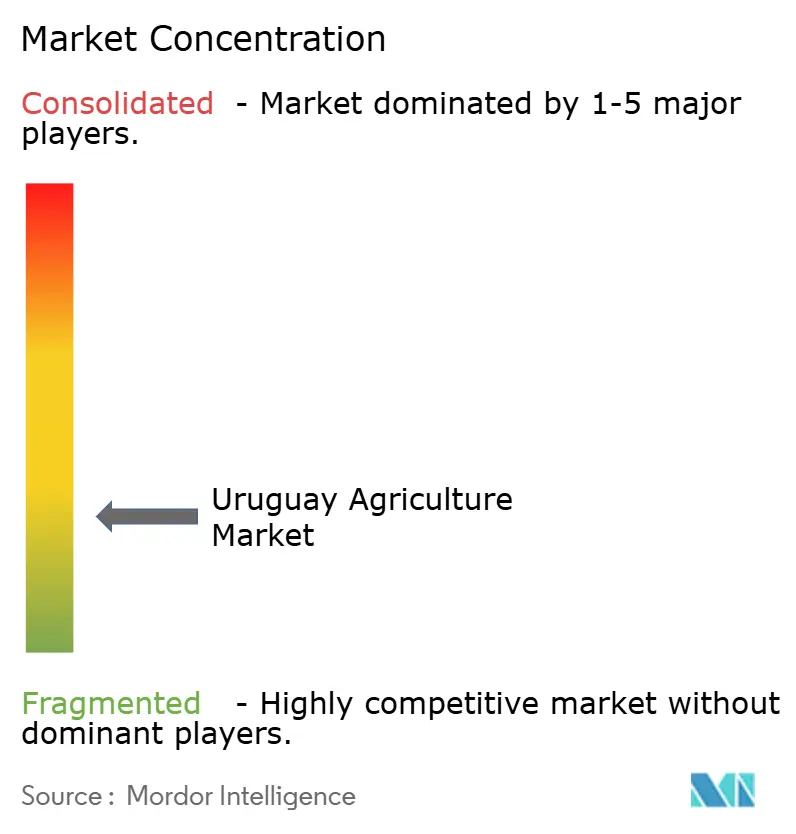
Five leading firms held a combined significant share in 2025, underlining fragmentation across 44,000 family farms. Cargill tops the table with elevators handling 1.2 million tonnes of soybeans and wheat, and a pledge to secure a 99.95% deforestation-free supply. Archer Daniels Midland ranks second, operating an oilseed crush plant that sells meal and oil to China and Europe. COFCO International’s prominent share stems from storage expansion that bypasses port congestion, illustrating how infrastructure shapes the Uruguay agriculture market.
Mid-tier cooperatives like Copagran and Barraca Erro keep farmer loyalty by pairing input finance with agronomic advice. Bunge’s 20% stake in Hosemillas secures proprietary genetics and cuts dependency on external breeders. Bioceres and Trigall Genetics bundle HB4 wheat seed with digital advisory services, monetizing data as well as seed sales. Public-private research via the National Agricultural Research Institute, which holds 42 plant variety patents, levels the playing field for domestic firms in the Uruguay agriculture market.
Precision platforms, carbon-credit aggregators, and organic certification services constitute rising white-space opportunities. Early movers harness remote sensing to deliver variable-rate prescriptions that lift yields by up to 18%. Carbon traceability adds 7% to 10% price leverage in premium beef destinations. As sustainability and digitization reshape buyer demands, competitive advantage in the Uruguay agriculture market will hinge on data fluency and verified environmental credentials.
Uruguay Agriculture Industry Leaders
Cargill Incorporated
Archer Daniels Midland Company
COFCO International Limited
Louis Dreyfus Company B.V.
Marfrig Global Foods S.A.
- *Disclaimer: Major Players sorted in no particular order


Market Opportunities and Future Outlook
Digital adoption and workforce renewal are tangible whitespace areas, supported by public programs rather than only private experimentation. MGAP opened the Semillas AgroDigitales call (June 1 to July 10, 2026) to train up to 250 rural youth in digital technologies and business management. This complements earlier government-backed digital extension efforts and directly targets the aging rural workforce constraint. In parallel, the IDB-backed Program to Promote the Adoption of Digital Technologies in Uruguays Agriculture Sector (Loan 5566/OC-UR), active through December 2027, is structured to support farm management platforms, sensor-based irrigation, traceability tools, and advisory services that cooperatives, input providers, and exporters can bundle.
A second set of opportunities centers on sustainability-linked inputs and differentiated crop programs. Decree N 42/025 formalized the National Bioinputs Plan (PNB) under the 2024-2026 Sustainable Bioeconomy framework, providing clearer regulatory backing for biological crop protection, biofertilizers, and integrated pest management services. On the commercial side, Louis Dreyfus Company and Nufarm launched a 2026 Carinata production plan, which signals continued procurement-led diversification into industrial and bio-based value chains alongside traditional grains and oilseeds. With buyers tightening deforestation-free and traceability requirements in export markets, these policy and procurement steps support service and input models that help producers document practices, reduce residue risk, and participate in identity-preserved channels.
Recent Industry Developments
- June 2026: MGAP opened the Semillas AgroDigitales application call (June 1 to July 10, 2026) to train up to 250 rural youth in digital technologies and business management. The initiative expands the pipeline of digitally capable farm operators and service providers, supporting wider use of traceability, data-driven agronomy, and compliance tools across value chains.
- May 2026: Louis Dreyfus Company, in alliance with Nufarm, launched its 2026 Carinata production plan with defined commercial conditions for growers. The program strengthens winter crop diversification and links farm output with structured offtake pathways tied to industrial and bio-based end uses, expanding beyond conventional grain marketing models.
- November 2024: The Ministry of Livestock, Agriculture and Fisheries launched a USD 12 million digital-extension program to train 3,500 smallholders in mobile traceability and grain-quality certification. This increased the base of export-ready suppliers by lowering documentation barriers and standardizing quality verification at the farm gate.


Research Methodology Framework and Report Scope
Market Definition and Coverage
For this study, the market represents the total value of agricultural output generated within Uruguay, covering farm-level production across key crop groups and the related on-farm economics reflected in prices and volumes.
Scope exclusions: We exclude downstream food processing and retail value add, as well as primary forestry and marine fishing activities.
Segmentation Overview
- By Crop Type (Production Analysis (Volume), Consumption Analysis (Value and Volume), Export Analysis (Value and Volume), Import Analysis (Value and Volume), and Price Trend Analysis)
- Cereals
- Oilseeds
- Fruits
- Vegetables
- Other Crops
Data Sources, Market Sizing, and Validation
Desk Research
Desk work starts by building the country agriculture fact base, and then mapping which public time series can be trusted for continuity across years. We relied on official and widely referenced sources such as FAOSTAT, World Bank agriculture indicators, UN Comtrade trade statistics, and the Uruguay XXI information center for sector context and export exposure. When a variable needed a local view, we also checked government publications and agriculture ministry pages where available, then supplemented with reputable press coverage and association updates.
To convert these signals into a sizing model, we used public crop production and harvested area series, price references, and trade values as the starting grid, which was then aligned with company filings, investor presentations, and annual reports from value-chain participants active in Uruguay. A paid subscription for company financials and intelligence was used selectively to confirm revenue mixes and operating footprints, and an import-export shipment-level database was used to sanity check product flow directionality where totals looked unusual. The sources listed here are illustrative, and additional public and paid references were also consulted for data collection, validation, and clarification.
Primary Interviews and Surveys
Our interviews and surveys in Uruguay cover producers, processors, traders, exporters, input distributors, and sector specialists. We use responses to test acreage, yields, farmgate prices, domestic offtake, export demand, and missing channel values, then reconcile differences with desk data before finalizing assumptions.
Distribution of primary research fieldwork respondents
| Company type | Respondent position |
|---|---|
| Top tier: 30% | CXOs: 15% |
| Mid tier: 45% | Functional/Unit leaders: 30% |
| Smaller Players: 25% | Managers: 55% |
Market-Sizing & Forecasting
Sizing is built using a top-down and bottom-up blend, where national production, price, and trade data are first used to reconstruct the agriculture value pool for Uruguay, and then the totals are corroborated using selective supplier and channel checks. When the key inputs are laid out together, the main clause becomes clear at the end, which is that a farm-output value series can be replicated year over year with consistent rules.
In practice, we track fingerprints that explain most of the movement in Uruguay, including harvested area and yield per hectare for major crop groups, farmgate and export-linked price direction, export volumes and values, and season-driven variability (including drought impact years). These inputs help separate a real volume change from a pure price effect, which matters in agriculture where nominal values can swing even when physical output is steady. For forecasting, scenario analysis is used with a base case anchored on expected area and yield normalization, and then stress-tested using price and export-demand paths validated through expert consensus gathered in primary discussions. Where bottom-up cross-checks have gaps, conservative interpolation is applied, and then revisited through follow-up outreach when the model flags a material variance.
Data Validation & Update Cycle
Validation is done by triangulating the modeled market value against independent signals like export values, crop volume totals, and price direction consistency across the same season. When an outlier appears, it is reviewed for data breaks, unit mismatches, or currency timing effects, and then the assumption is either corrected or documented and carried forward for review. Before sign-off, the model and its key inputs go through a multi-step analyst review so that large year-to-year jumps remain explainable and traceable.
The report is refreshed annually, and interim updates are made when a material event occurs, such as a major weather shock, a policy change that affects exports, or a meaningful price shift across core crops. Right before delivery, an analyst performs a fresh pass so clients receive the latest updated view that still matches the defined scope and the latest available official releases.
Mordor Intelligence's Uruguay Agriculture Market Size Measured Against Other Published Estimates
Published market sizes for Uruguay agriculture can look far apart, even when the topic sounds the same, because the scope is often not identical. Differences also come from the year used as the base, how price swings are treated in volatile seasons, and whether the number represents farm-output value or a national accounts value-added series.
By checking production volumes, export-linked price signals, and season-by-season yield shifts, Mordor Intelligence keeps the model tied to farm-output value for crops in Uruguay, and it leaves out forestry, fishing, and downstream processing value that some sources fold into a broader agribusiness total.
Benchmark comparison
| Source | Market Size | Gaps in Research Methodology |
|---|---|---|
| Mordor Intelligence | USD 12.40 B (2025) | |
| Sector Study A | USD 9.00 B (2024) | Anchored to an earlier base year and appears to apply a narrower market basket built from selected agriculture segments, which can undercount crop groups captured in the baseline. |
| Macro Dataset B | USD 5.20 B (2024) | Built on a national accounts value-added construct that nets out intermediate inputs and may include adjacent activities under agriculture aggregates, so it is not directly comparable to farm-output market value. |
The spread across published values is mostly explained by scope alignment, base-year choice, and whether pricing is treated at the farm gate or through value-added accounting. When the inputs are kept transparent and checked against production, trade, and price signals, the total becomes easier to reconcile and repeat for planning use.


Key Questions Answered in the Report
What is the projected revenue for Uruguay agriculture market by 2031?
The Uruguay agriculture market size is forecast to reach USD 15.16 billion by 2031, growing at a CAGR of 3.41%.
Which commodity drives Uruguay's export earnings the most?
Grass-fed beef leads exports, accounting for 48.5% of the 2024 agricultural shipment value.
How much arable land does Uruguay allocate to crops?
National policy caps cropland at 4 million hectares, directing growth toward yield gains rather than acreage expansion.
What role do carbon credits play in farm income?
Verified sequestration projects add USD 18 per metric ton of carbon credits, offsetting up to 18% of rancher feed costs.
What are the main challenges limiting farm expansion in Uruguay?
Land scarcity, high diesel and logistics costs, an aging rural workforce, and exposure to volatile global commodity prices constrain rapid acreage growth.
Page last updated on:





