
Accessible and Assisted Travel Market Size and Share
Market Overview
| Study Period | 2022 - 2031 |
|---|---|
| Market Size (2026) | USD 78.74 Billion |
| Market Size (2031) | USD 104.73 Billion |
| Growth Rate (2026 - 2031) | 5.87 % |
| Fastest Growing Market | Asia-Pacific |
| Largest Market | Europe |
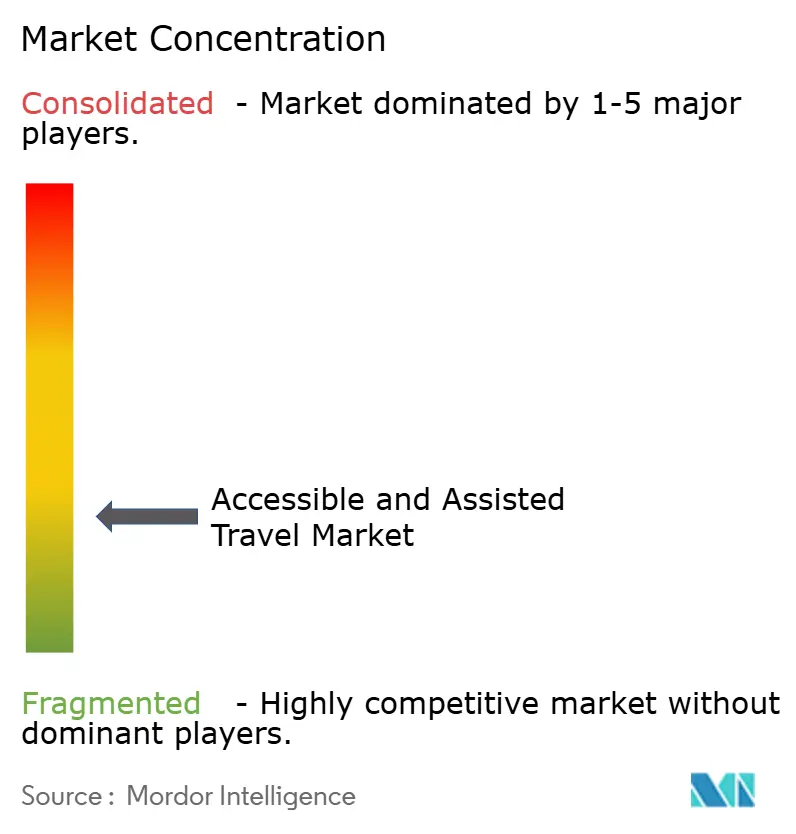
| Market Concentration | Low |
Major Players *Disclaimer: Major Players sorted in no particular order Image © Mordor Intelligence. Reuse requires attribution under CC BY 4.0. | |
Accessible and Assisted Travel Market Analysis by Mordor Intelligence
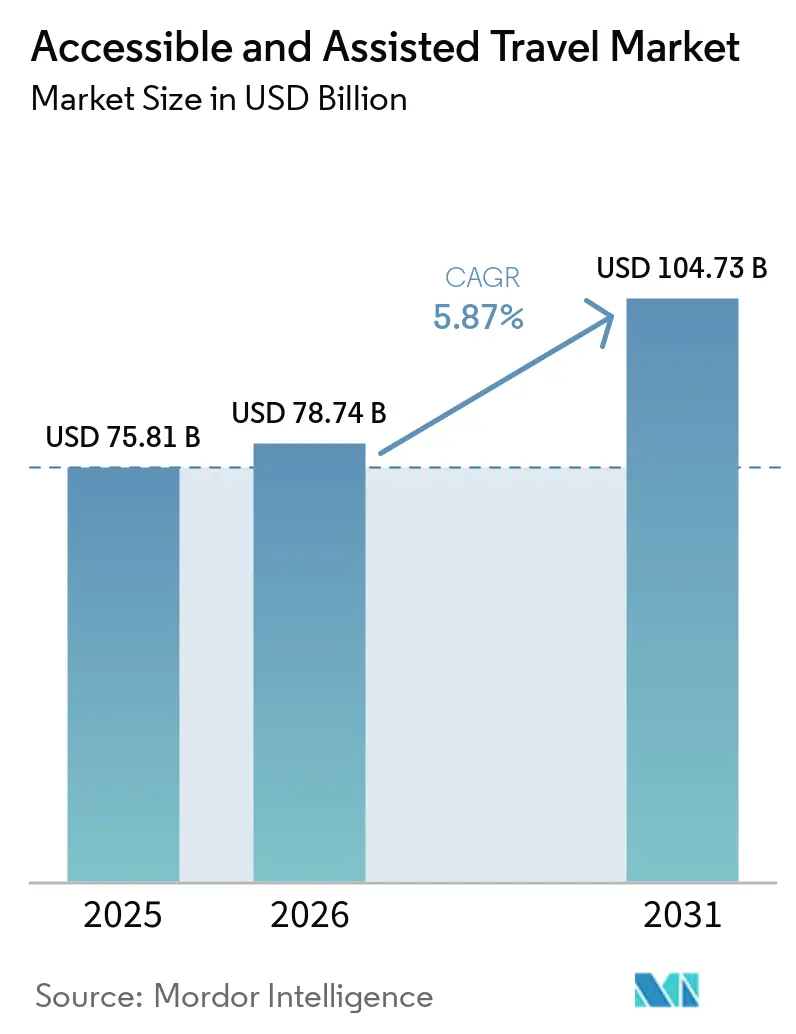
The Accessible And Assisted Travel Market size was valued at USD 75.81 billion in 2025 and is estimated to grow from USD 78.74 billion in 2026 to reach USD 104.73 billion by 2031, at a CAGR of 5.87% during the forecast period (2026-2031).
The demand base continues to grow as the global population aged 60 and older rises, and a large disabled population already travels when transport, lodging, and booking systems are workable for their needs. The accessible travel market also benefits from a demand pattern shaped more by service enablement than by optional leisure spending, which means operators can unlock revenue by removing barriers across the trip journey. Regulatory enforcement in Europe and tighter digital accessibility rules in North America are pushing travel providers to upgrade both physical facilities and digital interfaces, which should expand reliable supply through the forecast period. The main limit on growth is execution, because retrofit costs, uneven enforcement, and inconsistent service information still reduce booking confidence and slow the conversion of potential demand into completed trips in the accessible travel market.[1]Statistics Canada, “Accessibility Related Barriers to Travel Among Persons with Disabilities or Long-Term Conditions,” Statistics Canada, statcan.gc.ca
Key Report Takeaways
- By service type, Accessible Accommodation led with 32.63% revenue share in 2025, while Assisted Airport and Transit Services is projected to grow fastest at 6.43% CAGR through 2031.
- By traveler type, Senior Travelers held 48.81% share in 2025, while Medical Assistance Travelers are projected to expand at 6.98% CAGR through 2031.
- By booking channel, Direct Booking held 44.94% share in 2025, while Online Travel Agencies are projected to expand at 7.34% CAGR through 2031.
- By geography, Europe held 34.51% share in 2025, while Asia-Pacific is projected to expand at 7.05% CAGR through 2031.
Note: Market size and forecast figures in this report are generated using Mordor Intelligence’s proprietary estimation framework, updated with the latest available data and insights as of January 2026.
Global Accessible and Assisted Travel Market Trends and Insights
Drivers Impact Analysis*
| Drivers | (~) % Impact on CAGR Forecast | Geographic Relevance | Impact Timeline |
|---|---|---|---|
| Rising Aging Traveler Base and Disability Prevalence | +1.8% | Global | Long term (≥ 4 years) |
| Expansion of Accessibility Mandates Across Travel and Tourism | +1.2% | North America and Europe | Medium term (2-4 years) |
| Digital Booking Filters and Assistive Travel Platforms | +1.0% | Global | Short term (≤ 2 years) |
| Premiumization of Inclusive Travel Experiences | +0.6% | North America and Europe, with spillover to the Asia-Pacific | Medium term (2-4 years) |
| Airport and Hotel Retrofit Cycles Driven by Brand Reputation Risk | +0.4% | Global, with early gains in Europe and North America | Medium term (2-4 years) |
| Mobility Aid Rental and Assisted Ground Transfer Ecosystem Growth | +0.5% | Asia-Pacific core, with spillover to the Middle East and Africa | Medium term (2-4 years) |
| Source: Mordor Intelligence | |||
Rising Aging Traveler Base and Disability Prevalence
The accessible travel market has a demographic foundation that continues to expand even when broader travel cycles fluctuate. The global population aged 60 and older is projected to reach 1.4 billion by 2030, and 2.1 billion by 2050, and the population aged 80 and older is expected to reach 426 million, thereby expanding the group that often needs mobility support and comfort-led services while traveling. UN Tourism also states that 1.3 billion people globally live with significant disability. At the same time, the European Union alone has 80 million persons with disabilities, and more than 70% of them can afford to travel, which shows that the addressable customer base is already substantial. AARP data shows that adults aged 50 and older continued to prioritize travel in 2025 and 2026, which supports steady trip intent among older travelers rather than one-off recovery demand. Academic work published in 2026 also linked population aging in OECD countries to stronger inbound relative to outbound tourism, suggesting that destinations with accessible infrastructure can attract both domestic and international demand simultaneously.[2]World Health Organization, “Ageing and Health,” World Health Organization, who.int
Expansion of Accessibility Mandates Across Travel and Tourism
The accessible travel market is moving from voluntary inclusion efforts toward rule-based compliance across transport, lodging, and booking systems The European Accessibility Act came into force on June 28, 2025; however, EU member states have varying implementation timelines, and some sectors (like self-service terminals) may benefit from transition periods extending up to 2030 or beyond In the United States, the Department of Justice final rule under ADA Title II requires public entities to meet WCAG 2.1 AA standards, with compliance deadlines for state and local governments extended to April 2027 or April 2028 depending on entity size. IATA and ICAO are also pushing for a more harmonized end-to-end journey approach, which raises service standards and makes accessibility implementation more visible across the aviation chain. As these mandates are enforced, operators in the accessible travel market are being pushed to invest in audits, upgrades, and standard operating procedures that expand reliable supply rather than treating accessibility as a marketing statement.
Digital Booking Filters and Assistive Travel Platforms
The accessible travel market has long lost demand at the booking stage because many travelers could not verify whether a room, route, or facility actually met their needs. ISO 9468:2025 provides general guidance for the operations of online accommodation booking platforms to improve service reliability and consumer protection, though it is not primarily an accessibility-specific standard. Expedia Group reported that in 2024, it worked with the French Government and Acceslibre to add detailed accessibility data across Expedia, Hotels.com, and Vrbo listings ahead of the Paris Paralympic Games, demonstrating how mainstream platforms are beginning to standardize verified attributes. Open Doors Organization found that 81% of United States travelers with disabilities used the internet for travel needs in the two years to 2024, and 48% used it to find and book accessible hotels, which confirms strong digital intent when information is credible. As data becomes more structured and comparable, the accessible travel market can convert more searches into bookings because travelers spend less effort on direct verification and are less likely to abandon the purchase journey.
Premiumization of Inclusive Travel Experiences
The accessible travel market is not limited to budget travel, because many travelers in this space are willing to pay more for certainty, comfort, and support that reduces trip risk. Open Doors Organization estimated that 25.6 million United States travelers with disabilities took 76.9 million trips and spent nearly USD 50 billion in the two years to 2024, which shows that the spending base is already meaningful at scale. AARP found that international trip intent among adults aged 50 and older rose from 37% in 2024 to 45% in 2025, which supports demand for higher-service itineraries among travelers who often value room quality, assistance, and reliability over headline discounts. Research from Booking.com, published in March 2025, found that only 51% of neurodivergent travelers felt that available support met their needs, suggesting that premium value in this market often comes from better design and support rather than luxury branding alone. For the accessible travel market, suppliers that combine verified accessibility, responsive support, and better room or transport design are positioned to capture higher-yield bookings without relying on mass-market pricing.
Restraints Impact Analysis*
| Restraints | (~) % Impact on CAGR Forecast | Geographic Relevance | Impact Timeline |
|---|---|---|---|
| High Retrofit and Staff Training Costs | -0.8% | Global, most acute in South America and Middle East, and Africa | Long term (≥ 4 years) |
| Inconsistent Global Accessibility Standards and Enforcement | -0.6% | Global, most severe outside North America and Europe | Long term (≥ 4 years) |
| Low Data Accuracy and Trust in Accessibility Listings | -0.3% | Global | Medium term (2-4 years) |
| Fragmented Service Delivery Across Booking, Transit, and Hospitality Layers | -0.4% | Global | Medium term (2-4 years) |
| Source: Mordor Intelligence | |||
High Retrofit and Staff Training Costs
The accessible travel market still faces a meaningful cost barrier because accessibility upgrades often require structural changes rather than small cosmetic fixes. HCMA found in January 2024 that bringing a prototype office asset to RHFAC Gold accessibility certification would require approximately CAD 584,000 (USD 0.41 million), while upgrading a prototype K-12 school building would require approximately CAD 1.07 million (USD 0.75 million). Hospitality retrofits can become more expensive when plumbing, lifts, and doorway layouts need to be reworked. These costs matter even more for smaller hotels and regional travel operators that lack the capital strength of multinational brands. IATA guidance and ongoing accessibility rule changes also imply recurring training needs for frontline staff, which adds a continuing operating burden on top of one-time capital expenditure. Because of this cost structure, supply in the accessible travel market can grow more slowly in lower-investment corridors even when underlying traveler demand is already present.
Inconsistent Global Accessibility Standards and Enforcement
The accessible travel market is also constrained by the fact that compliance rules and enforcement quality vary sharply across countries and travel subsectors. Statistics Canada reported in May 2025 that 40% of Canadians with disabilities or long-term conditions who took inter-city trips experienced accessibility barriers at transport terminals, even in a market with established legal structures. IATA has openly stated that accessible air travel must move away from fragmented national rules toward a globally harmonized journey approach, indicating that inconsistency remains a live operational issue rather than a solved one. The European Union has moved further with binding standards, but that level of clarity is not yet present in many other parts of the world. As long as standards remain uneven, the accessible travel market will continue to lose trips because travelers cannot confidently assume that accessible service in one part of the journey will be matched in the next.
*Our forecasts treat driver/restraint impacts as directional, not additive. The impact forecasts reflect baseline growth, mix effects, and variable interactions.
Segment Analysis
By Service Type: Accommodation Anchors Revenue While Transit Services Drive Forward Growth
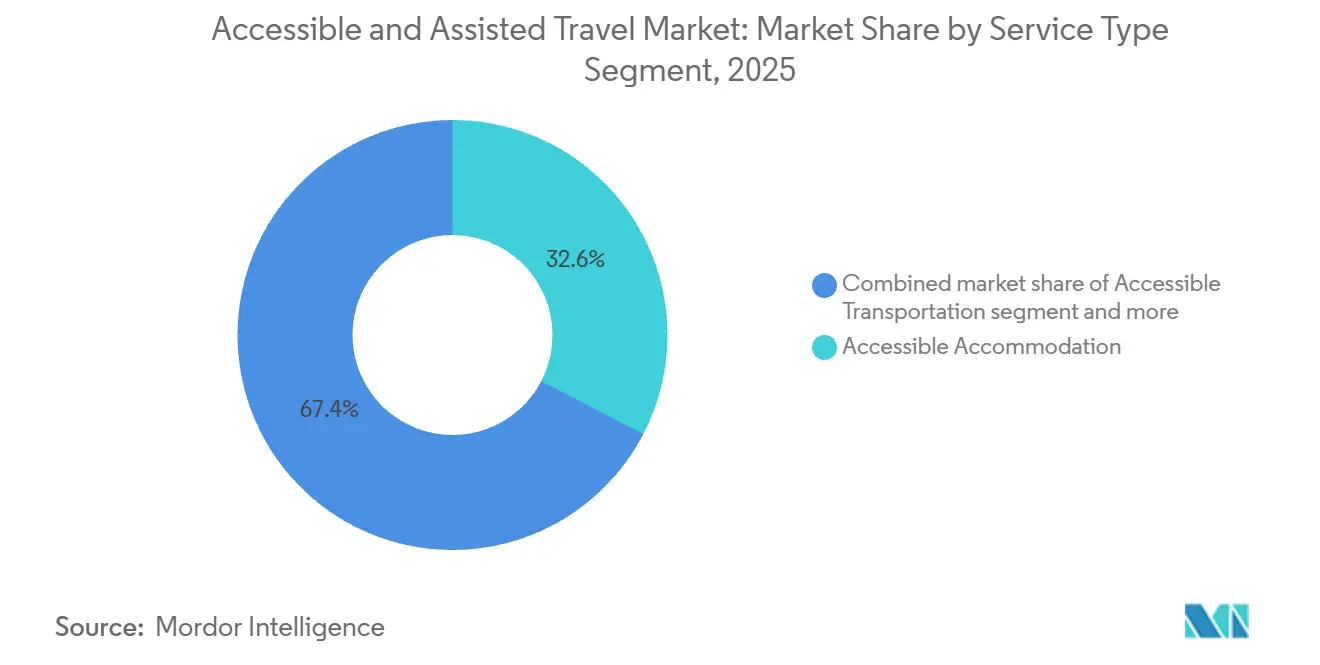
Accessible accommodation held 32.63% of the accessible travel market share in 2025, making it the largest service category, as lodging is often the most critical and least substitutable part of an accessible trip. ENAT’s 2025 survey preview showed that accessible bathrooms were the top accommodation requirement for 74% of respondents, and wide doorways mattered to 67%, which explains why travelers often prioritize verified room design over broader trip extras. Assisted Airport and Transit Services is projected to grow at a 6.43% CAGR through 2031, supported by tighter access rules and higher service expectations across terminals, wayfinding, and pre-trip assistance coordination.
A second feature of the service mix is the growing importance of verification quality within the accessible travel industry. Mainstream platforms have begun adding more detailed accessibility fields. However, the most valuable service providers are still those that reduce uncertainty through inspection, structured data, and human support throughout the trip. That matters most in accommodation and transit, where a mismatch between promised and actual accessibility can make the full itinerary unusable. Public and destination-led investments in barrier-free upgrades, including Japan’s universal tourism subsidy efforts, also improve the service base around rooms, transfers, and local facilities rather than relying on a single isolated touchpoint.



By Traveler Type: Senior Dominance Coexists with Rapid Expansion across Medical and Companion Segments
Senior Travelers held 48.81% of the accessible travel market in 2025, while Medical Assistance Travelers are projected to grow fastest at 6.98% CAGR through 2031. AARP’s 2025 and 2026 travel studies show that adults aged 50 and older remained active travelers, and international trip intent rose materially in 2025, which supports the segment’s leading role in demand formation. WHO demographic projections reinforce this outlook because the aging population continues to expand the cohort that often requires assisted movement, comfort-oriented stays, and clearer travel information. Medical assistance travel is advancing faster because coordinated recovery trips, treatment-linked itineraries, and support-led planning are becoming more formalized service formats within the accessible travel market.
Travelers with disabilities remain a major, increasingly visible customer group in the accessible travel market. Tourism Research Australia reported 70.5 million trips by travelers with accessible needs in 2024, equal to 22% of domestic trips, and AUD 29.2 billion (USD 20.1 billion) in total spend, confirming that this is a mainstream travel population in developed markets rather than a niche user group. Booking.com’s March 2025 research also highlighted the unmet needs of neurodivergent travelers, with 49% reporting travel difficulties and only 51% feeling current support met their needs. This indicates that the accessible travel market has room to widen beyond mobility-led products and toward clearer sensory, cognitive, and communication support.
By Booking Channel: Direct Dominance Tested by OTA Accessibility Innovation
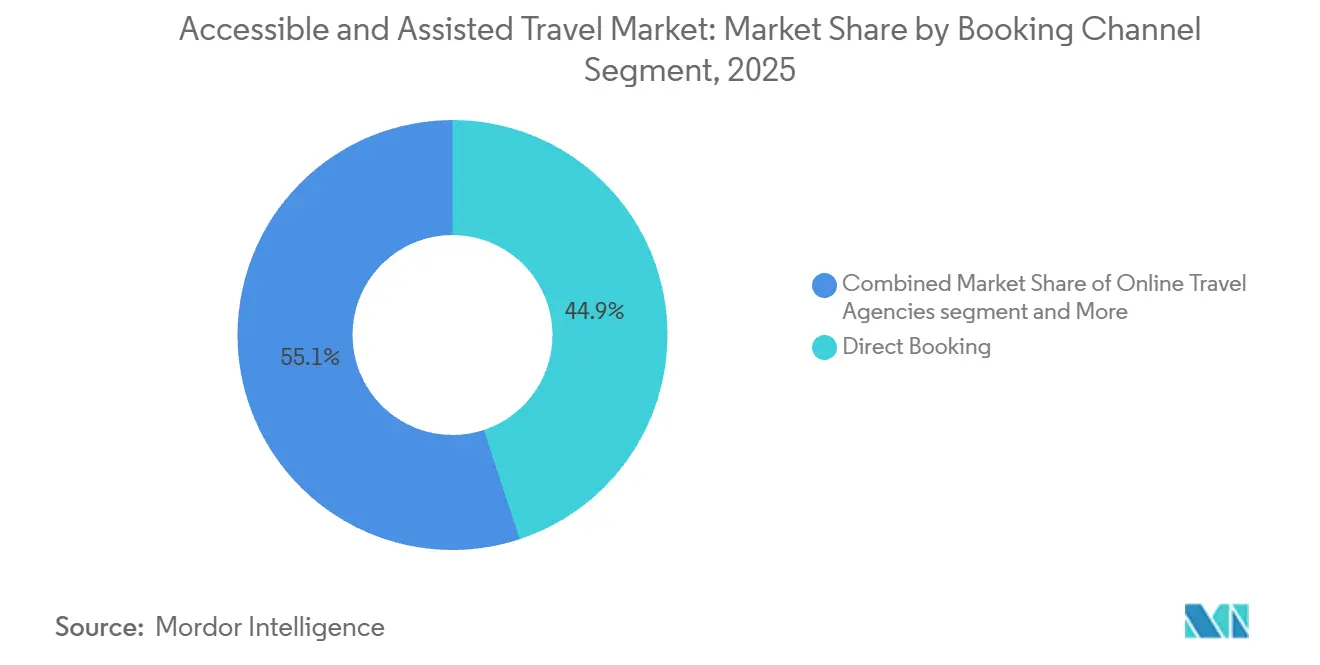
Direct Booking held 44.94% of the accessible travel market share in 2025, while Online Travel Agencies are projected to expand at 7.34% CAGR through 2031. Direct channels remain important because travelers with complex needs often want to speak with hotel teams, airline assistance desks, or specialist advisors before confirming a trip. Open Doors Organization found that travelers with disabilities are increasingly comfortable using digital tools. However, the same study also shows why many still need trusted verification before booking a hotel or service online. OTA growth is improving because ISO 9468:2025 gives clearer guidance for structured booking information, and large platforms such as Expedia brands have already begun expanding detailed accessibility data in listings.
Specialized accessible travel agencies still hold a distinct role because they provide destination expertise, manual verification, and trip support that standard booking flows often cannot match. That role remains valuable in the accessible travel industry because customers are not only buying inventory but also lower risk and better coordination. Institutional and government-linked channels are also becoming increasingly relevant, as public programs directly support accessible room upgrades and barrier-free tourism infrastructure. The Japanese universal tourism subsidy structure is a good example because public support strengthens supply while also making destination referral and program-led booking more feasible. Over time, the accessible travel market is likely to reward channels that combine digital ease with human validation rather than channels that rely only on scale.[3]Japan Ministry of Land Infrastructure Transport and Tourism, “Universal Tourism Promotion Subsidy Program FY2026,” MLIT, hojokin-kensaku.jp
Geography Analysis
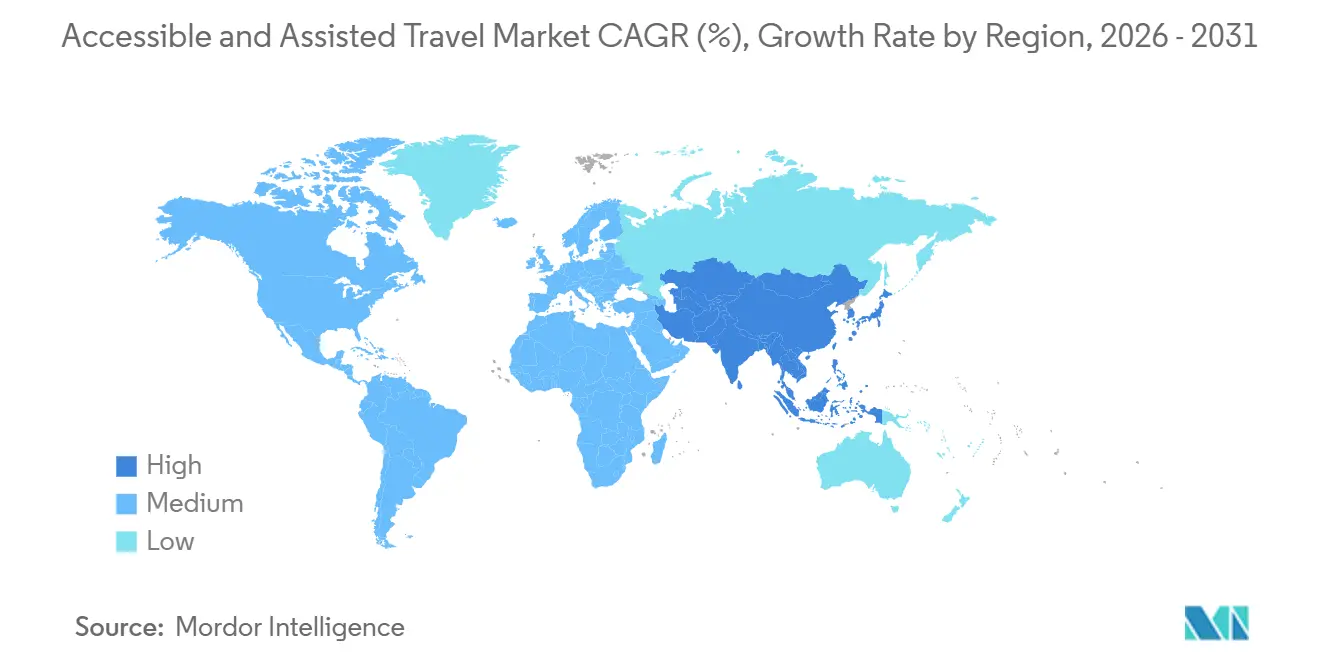
Europe held 34.51% of the accessible travel market share in 2025, maintaining its leading position. ENAT’s 2025 preview survey showed strong leisure travel activity across France, Germany, Italy, Spain, and the United Kingdom, including regular international travel among respondents, which supports Europe’s established demand base. The European Accessibility Act entered full application in June 2025 and has brought accessibility compliance closer to everyday reality across transport services and digital interfaces. Germany has also been active in this field, and the German National Tourist Board used its 13th Accessible Tourism Day in March 2025 to focus on legal obligations, AI applications, and the Reisen für Alle certification system. Europe, therefore, combines a travel-ready user base with one of the most structured compliance environments in the accessible travel market, which should keep quality-verified supply growing through the forecast period.
North America remains a large and important region for the accessible travel market. The United States is also tightening digital compliance through ADA Title II implementation timelines, which brings public travel websites and digital service points under closer accessibility scrutiny. In Canada, Statistics Canada found that 40% of travelers with disabilities or long-term conditions experienced transport terminal barriers, which shows that the demand scale has not yet been matched by fully dependable delivery. North America thus reflects a mature demand environment in the accessible travel market where legal frameworks are strong, but service consistency still needs improvement across the full journey.
Asia-Pacific is projected to record the fastest expansion in the accessible travel market, with a 7.05% CAGR through 2031. UNWTO identified a 690-million-person accessible tourism opportunity in the region, supported by aging demographics and increased government investment in barrier-free tourism systems. Japan is a leading example, with MLIT support for universal tourism and a June 2025 Shizuoka Prefecture pilot worth JPY 50 million, or USD 334,000, for mobility mapping and barrier-free improvements in Ito City. Australia already shows that accessible travel is operating at scale, with 70.5 million trips and USD 29.2 billion in spend from travelers with accessible needs in 2024. South America, the Middle East, and Africa remain promising but less developed parts of the accessible travel market, with real growth potential. However, infrastructure investment and standardized execution still trail those of the leading regions.[4]German National Tourist Board, “Accessible Tourism Day 2025,” German National Tourist Board, germany.travel

Competitive Landscape
The accessible travel market is moderately fragmented, with large hotel groups, OTAs, transport operators, and specialist accessible travel providers all competing on different strengths. Large incumbents tend to approach this space through compliance, inventory improvement, and digital upgrades, while specialist players tend to compete through verified data, destination knowledge, and high-touch support. The result is a two-level competitive structure in which scale does not automatically close the trust gap if room features, transfer support, or airport assistance are not reliably verified. This keeps differentiation focused on credibility and service execution rather than only on brand size. The accessible travel market, therefore, rewards firms that can combine accessible inventory, structured information, and dependable delivery across several travel touchpoints.
One clear strategic move came from Expedia Group, which reported a 2024 partnership with the French Government and Acceslibre to add granular accessibility data across Expedia, Hotels.com, and Vrbo listings. This move matters because it strengthens trust at the booking stage and makes large-scale distribution more useful for travelers who need specific accessibility attributes. A second strategic move came from Accor, which said it was advancing accessibility efforts and the certification of 380 hotels under Tourisme et Handicap during the Paris 2024 period, demonstrating how a global hotel group is linking accessibility to network quality and brand credibility. The third strategic move came from The Ascott Limited and SG Enable, which signed a June 2024 partnership to develop a global disability inclusion playbook, target full disability awareness training for frontline associates by 2027, and move guest-facing digital platforms to full WCAG compliance by 2028. These actions show that competitive positioning in the accessible travel market is increasingly built through operational proof rather than broad inclusion messaging.
Competitive white space remains visible in several parts of the accessible travel market. Neurodivergent traveler support remains underdeveloped, and Booking.com’s March 2025 research found that many in this group still face difficulties and limited support. Cross-modal coordination across booking, airport assistance, local movement, and accommodation also remains uneven, leaving room for providers that can deliver more comprehensive trip management. IATA’s continued push for an end-to-end accessibility framework suggests that standardization is improving, but it also shows that the current market is still far from uniform delivery. As standards tighten and verified data becomes more common, competitive advantage in the accessible travel market is likely to shift toward operators that can demonstrate service quality at scale without sacrificing the human support these travelers still value.
Accessible and Assisted Travel Industry Leaders
Marriott International, Inc.
Hilton Worldwide Holdings Inc.
Accor SA
Delta Air Lines, Inc.
Booking Holdings Inc.
- *Disclaimer: Major Players sorted in no particular order

Recent Industry Developments
- June 2026: The U.S. Department of Transportation (DOT) enforced a critical compliance deadline under its expanded accessibility regulations (often referred to as the "Wheelchair Rule"). By June 17, 2026, all airline staff and contractors who physically assist passengers with disabilities or handle mobility devices were required to have completed mandatory, hands-on training. This rule aims to ensure safe, dignified assistance, improve transfer protocols, and drastically reduce the mishandling and damage of wheelchairs across U.S. air travel.
- April 2026: Wheel the World partnered with Visit Syracuse to verify the accessibility of 19 local organizations, generating an estimated USD 1 million in economic impact. This state-funded accessible travel program is expanding its Destination Verified initiative to Buffalo, Rochester, and Albany.
- June 2025: The European Accessibility Act reached full application for passenger transport services, requiring airlines, rail, ferry, bus operators, and digital booking platforms across EU Member States to comply with binding accessibility standards, the most significant regulatory event for accessible tourism in the forecast period.
- March 2025: Booking.com released primary research on neurodivergent traveler challenges, finding 49% of this segment experience difficulties when traveling and only 51% feel available support meets their needs, signaling the platform’s intent to develop inclusion-specific product features across its global inventory of 28 million-plus listings.


Global Accessible and Assisted Travel Market Report Scope
| Accessible Transportation |
| Accessible Accommodation |
| Assisted Airport & Transit Services |
| Accessible Tours & Activities |
| Travel Assistance & Support Services |
| Senior Travelers |
| Travelers with Disabilities |
| Medical Assistance Travelers |
| Companion & Caregiver Travelers |
| Direct Booking |
| Specialized Accessible Travel Agencies |
| Online Travel Agencies (OTAs) |
| Institutional & Government Program |
| North America | United States |
| Canada | |
| Mexico | |
| South America | Brazil |
| Peru | |
| Chile | |
| Argentina | |
| Rest of South America | |
| Europe | United Kingdom |
| Germany | |
| France | |
| Spain | |
| Italy | |
| BENELUX (Belgium, Netherlands, and Luxembourg) | |
| NORDICS (Denmark, Finland, Iceland, Norway, and Sweden) | |
| Russia | |
| Rest of Europe | |
| Asia-Pacific | India |
| China | |
| Japan | |
| Australia | |
| South Korea | |
| South East Asia (Singapore, Malaysia, Thailand, Indonesia, Vietnam, and Philippines) | |
| Rest of Asia-Pacific | |
| Middle East and Africa | United Arab Emirates |
| Saudi Arabia | |
| South Africa | |
| Nigeria | |
| Rest of Middle East and Africa |
| By Service Type | Accessible Transportation | |
| Accessible Accommodation | ||
| Assisted Airport & Transit Services | ||
| Accessible Tours & Activities | ||
| Travel Assistance & Support Services | ||
| By Traveler Type | Senior Travelers | |
| Travelers with Disabilities | ||
| Medical Assistance Travelers | ||
| Companion & Caregiver Travelers | ||
| By Booking Channel | Direct Booking | |
| Specialized Accessible Travel Agencies | ||
| Online Travel Agencies (OTAs) | ||
| Institutional & Government Program | ||
| By Geography | North America | United States |
| Canada | ||
| Mexico | ||
| South America | Brazil | |
| Peru | ||
| Chile | ||
| Argentina | ||
| Rest of South America | ||
| Europe | United Kingdom | |
| Germany | ||
| France | ||
| Spain | ||
| Italy | ||
| BENELUX (Belgium, Netherlands, and Luxembourg) | ||
| NORDICS (Denmark, Finland, Iceland, Norway, and Sweden) | ||
| Russia | ||
| Rest of Europe | ||
| Asia-Pacific | India | |
| China | ||
| Japan | ||
| Australia | ||
| South Korea | ||
| South East Asia (Singapore, Malaysia, Thailand, Indonesia, Vietnam, and Philippines) | ||
| Rest of Asia-Pacific | ||
| Middle East and Africa | United Arab Emirates | |
| Saudi Arabia | ||
| South Africa | ||
| Nigeria | ||
| Rest of Middle East and Africa | ||


Key Questions Answered in the Report
What is the 2031 value forecast for accessible travel?
The Accessible travel market is forecast to reach USD 104.73 billion by 2031, rising from USD 78.74 billion in 2026 at a 5.87% CAGR over 2026-2031.
Which service category leads revenue in this space?
Accessible Accommodation led with a 32.63% share in 2025 because room design, bathrooms, and doorways remain the most critical trip requirements for many travelers.
Which traveler group drives the largest demand base?
Senior Travelers held 48.81% share in 2025, supported by aging demographics and continued travel intent among adults aged 50 and older.
Which booking route is growing the fastest?
Online Travel Agencies are projected to grow at 7.34% CAGR through 2031 as accessibility filters, structured listing data, and clearer booking standards improve usability.
Which region is expanding the fastest?
Asia-Pacific is projected to grow at 7.05% CAGR through 2031, supported by a large accessible tourism base, aging populations, and stronger government investment.
What is the main barrier holding growth back?
Retrofit costs, inconsistent standards, and weak coordination across booking, transit, and hospitality still limit confidence and slow the conversion of demand into completed trips.
Page last updated on:


 Your data is secure and never sold or shared.


