Tamaño y Participación del Mercado de Semillas de África
Visión General del Mercado
| Período de Estudio | 2021 - 2031 |
|---|---|
| Período de Datos Pronosticados | 2026 - 2031 |
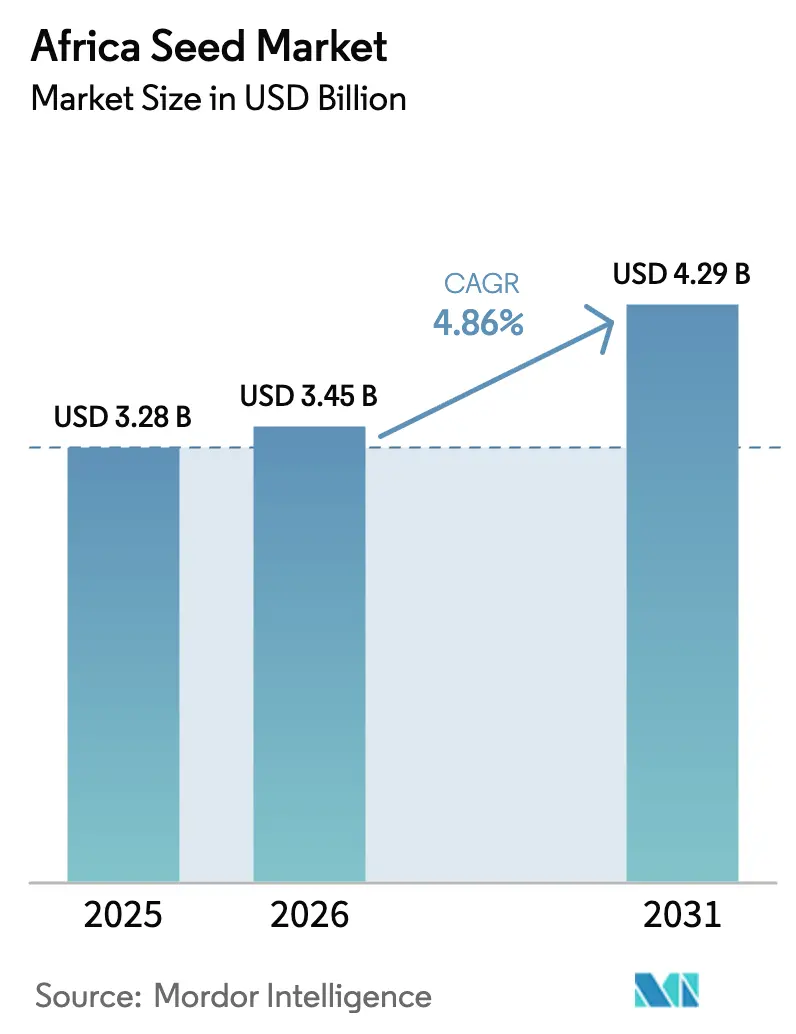
| Tamaño del mercado en el año base (2025) | 3.28 Mil millones de dólares |
| Tamaño del Mercado (2026) | 3.45 Mil millones de dólares |
| Tamaño del Mercado (2031) | 4.29 Mil millones de dólares |
| Tasa de crecimiento (2026 - 2031) | 4.86% CAGR |
| Concentración del Mercado | Bajo |
Jugadores principales *Nota aclaratoria: los principales jugadores no se ordenaron de un modo en especial Imagen © Mordor Intelligence. El uso requiere atribución según CC BY 4.0. | |
Análisis del Mercado de Semillas de África por Mordor Intelligence
El tamaño del mercado de semillas de África es de USD 3,28 mil millones en 2025, pasando a USD 3,45 mil millones en 2026, y se prevé que alcance USD 4,29 mil millones en 2031 a una CAGR del 4,86% durante el período 2026-2031. La expansión proyectada se sustenta en cuatro pilares estructurales: la creciente preferencia por genética híbrida y tolerante al estrés, el despliegue sostenido de programas de reemplazo de semillas financiados por el gobierno, la continua expansión de la superficie irrigada y la histórica armonización regional de la legislación semillera que entró en vigor bajo el Área de Libre Comercio Continental Africana en 2024. La distribución de micropaquetes habilitada digitalmente ha reducido aún más las barreras de entrada para los agricultores de pequeña escala, quienes representan aproximadamente el 80% de la producción regional, mientras que los primeros ensayos de campo de cultivos editados genéticamente prometen una cartera adicional de variedades resistentes al clima. En conjunto, estas fuerzas están inclinando la balanza desde las redes informales de intercambio hacia canales comerciales estructurados que enfatizan el aseguramiento de la calidad, la trazabilidad y una rotación varietal más rápida.
Conclusiones Clave del Informe
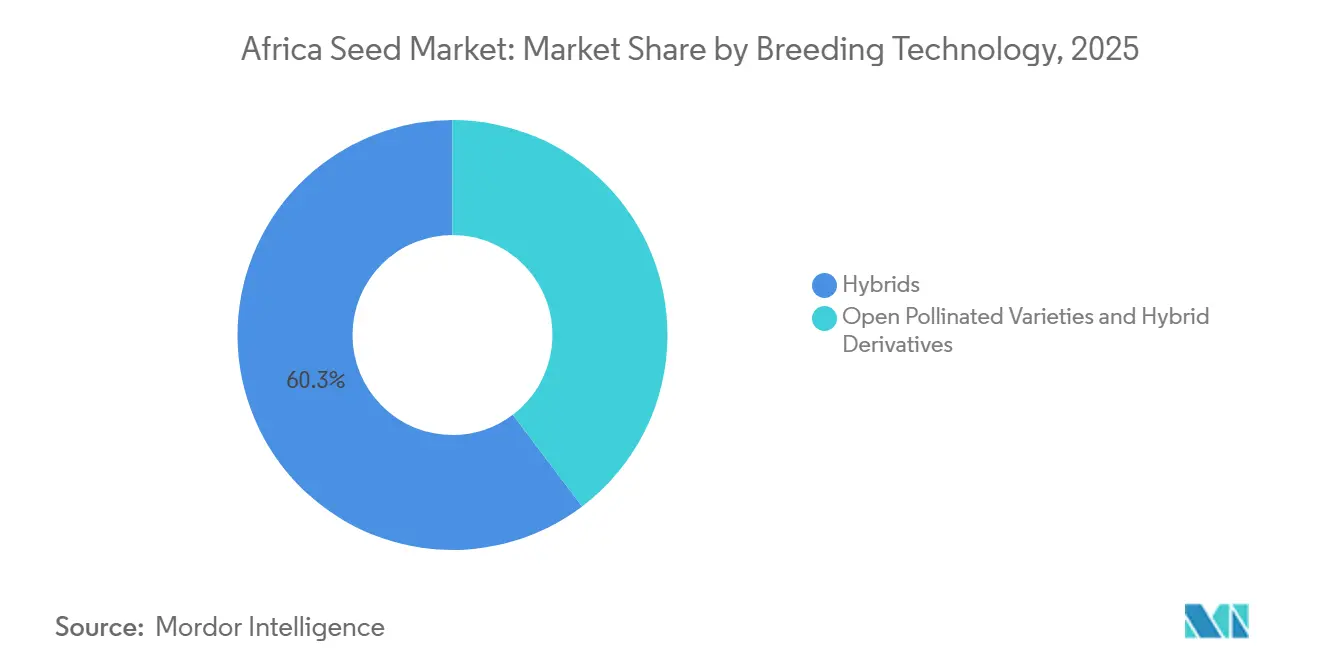
- Por tecnología de mejoramiento, los híbridos representaron el 60,3% del mercado de semillas de África en 2025, mientras que se proyecta que las variedades de polinización abierta y los derivados híbridos crezcan a una CAGR del 4,9% hasta 2031.
- Por mecanismo de cultivo, los sistemas de campo abierto representaron el 99,9% del tamaño del mercado de semillas de África en 2025, y se proyecta que el cultivo protegido se expanda a una CAGR del 7,6% hasta 2031.
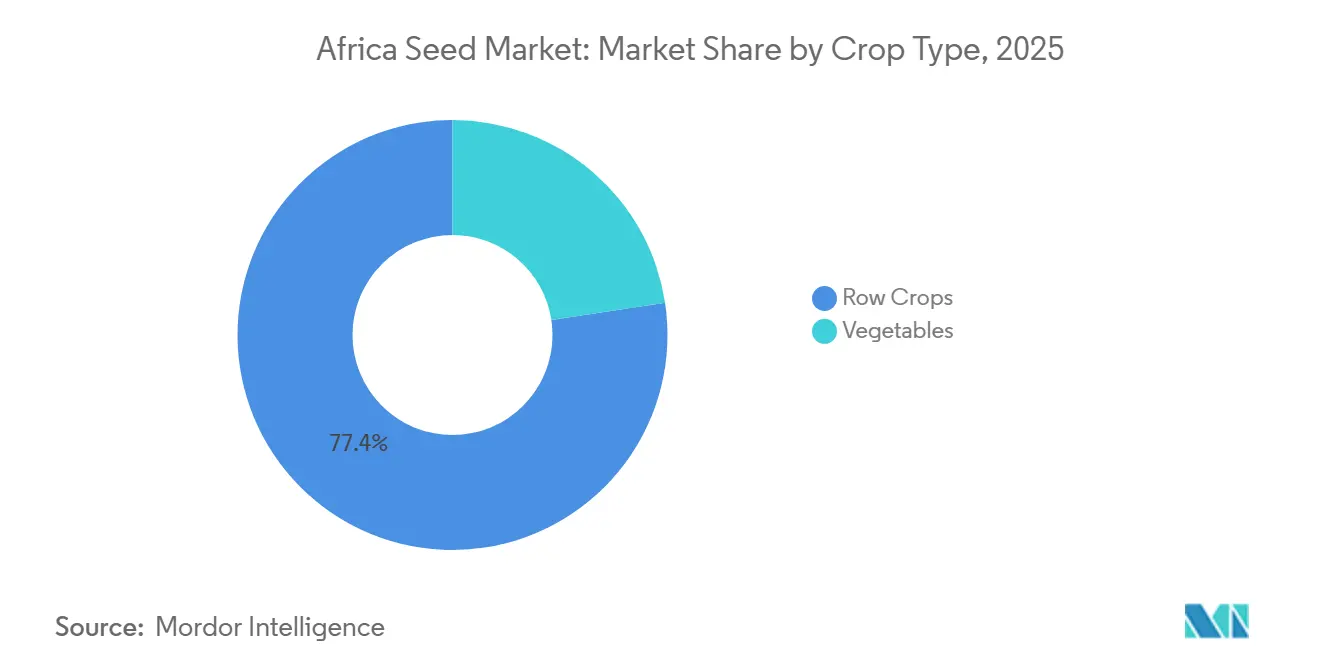
- Por tipo de cultivo, los cultivos en hilera representaron el 77,4% del mercado de semillas de África en 2025; sin embargo, las hortalizas siguen siendo el segmento de más rápido crecimiento, con una CAGR del 5,4% hasta 2031.
- Por geografía, Nigeria lidera el mercado con una participación del 40,6% en 2025, mientras que Kenia es el segmento nacional de más rápido crecimiento, con una CAGR del 6,2% hasta 2031.
Nota: Las cifras de tamaño del mercado y previsión de este informe se generan utilizando el marco de estimación propietario de Mordor Intelligence, actualizado con los últimos datos e información disponibles a partir de 2026.
Tendencias e Información del Mercado de Semillas de África
Análisis del Impacto de los Impulsores*
| Impulsor | (~) % de Impacto en el Pronóstico de CAGR | Relevancia Geográfica | Horizonte Temporal del Impacto |
|---|---|---|---|
| Adopción creciente de variedades de semillas híbridas y tolerantes al estrés | +1.2% | Nigeria, Kenia, Sudáfrica y Ghana | Mediano plazo (2-4 años) |
| Programas de insumos y reemplazo de semillas financiados por el gobierno | +0.8% | Nigeria, Etiopía, Tanzania y Kenia | Corto plazo (≤ 2 años) |
| Expansión de tierras irrigadas y cultivo protegido | +0.6% | Egipto, Sudáfrica, Kenia, Ghana | Largo plazo (≥ 4 años) |
| Armonización regional de la legislación semillera bajo el AfCFTA (Área de Libre Comercio Continental Africana) | +0.7% | Tanzania y Kenia | Mediano plazo (2-4 años) |
| Ventas digitales de semillas en micropaquetes a través de agrodistribuidores de último kilómetro | +0.5% | Nigeria, Kenia, Ghana, Tanzania | Corto plazo (≤ 2 años) |
| Cultivos indígenas editados genéticamente que ingresan a ensayos nacionales | +0.4% | Sudáfrica, Kenia, Nigeria | Largo plazo (≥ 4 años) |
| Fuente: Mordor Intelligence | |||
Adopción Creciente de Variedades de Semillas Híbridas y Tolerantes al Estrés
La volatilidad climática está impulsando a los agricultores a adoptar híbridos que ofrecen mayor estabilidad de rendimiento, tolerancia a la sequía y resistencia a plagas en comparación con las variedades tradicionales de polinización abierta. En 2025, Nigeria reportó un aumento del 35% en la adopción de maíz híbrido, con variedades tolerantes al estrés que representaron el 60% de los nuevos registros.[1]Fuente: Consejo Nacional de Semillas Agrícolas de Nigeria, "Informe Anual de Registro de Semillas 2024," seedcouncil.gov.ng. Tanto las empresas multinacionales como los mejoradores locales se centran en desarrollar trigo tolerante al calor para las regiones desérticas de Egipto y sorgo resistente a la sequía para el Sahel, ampliando el portafolio híbrido en diversas zonas agroecológicas.
Programas de Insumos y Reemplazo de Semillas Financiados por el Gobierno
Los programas públicos continúan siendo un impulsor confiable de la demanda. El Programa de Prestatarios Ancla de Nigeria, por ejemplo, proporcionó 2,3 millones de toneladas métricas de semilla certificada en 2024[2]Fuente: Banco Central de Nigeria, "Informe del Programa de Prestatarios Ancla 2024," cbn.gov.ng. Etiopía integra vales anuales de semillas en su Programa de Red de Seguridad Productiva, conectando efectivamente las iniciativas de protección social con la renovación varietal. Tanzania ha establecido un objetivo para lograr una tasa de reemplazo sustancial de las existencias de semillas tradicionales para 2027, utilizando cooperativas para distribuir paquetes de semillas subsidiadas. Estas iniciativas no solo garantizan la estabilidad de la demanda para los proveedores, sino que también contribuyen a mejorar las ganancias genéticas en la producción agrícola.
Expansión de Tierras Irrigadas y Cultivo Protegido
El acceso al agua y el control del microclima están influyendo en las preferencias de semillas. Egipto gestiona 45.000 hectáreas de área de invernadero, lo que sustenta un segmento especializado de semillas hortícolas.[3]Fuente: Ministerio de Agricultura de Egipto, "Estadísticas de Cultivo Protegido 2024," agriculture.gov.eg. En la provincia del Cabo Occidental de Sudáfrica, se observa un modesto crecimiento anual en invernaderos de alta tecnología, mientras que la industria de Kenia amplió su área de invernaderos en 2025. A medida que el cultivo protegido continúa creciendo, la demanda se centra cada vez más en hábitos de crecimiento determinado, madurez uniforme y rasgos de resistencia a múltiples enfermedades incorporados en híbridos de próxima generación diseñados para la producción hortícola de alto valor.
Armonización Regional de la Legislación Semillera bajo el AfCFTA (Área de Libre Comercio Continental Africana)
Los protocolos del Área de Libre Comercio Continental Africana (AfCFTA) de 2024 permiten que los productos registrados en una nación signataria circulen en 21 mercados sin necesidad de pruebas adicionales, reduciendo significativamente los costos de entrada. Esta alineación regulatoria reduce los costos de entrada al mercado de las empresas semilleras entre un 40% y un 60%, y permite un despliegue transfronterizo más rápido de variedades. Adicionalmente, el sistema unificado de certificación de semillas de la Unión Económica y Monetaria de África Occidental, introducido en 2024, establece un mercado simplificado para los agricultores al agilizar el proceso de aprobación regulatoria. Además, los mejoradores de hortalizas, como Rijk Zwaan, utilizan certificados fitosanitarios armonizados para agilizar la importación de semillas parentales desde Europa y Asia. Esta armonización amplía el potencial de mercado de cada nuevo híbrido, mejora las economías de escala y contribuye con un 0,5% al crecimiento del mercado de semillas africano.
Análisis del Impacto de las Restricciones*
| Restricción | (~) % de Impacto en el Pronóstico de CAGR | Relevancia Geográfica | Horizonte Temporal del Impacto |
|---|---|---|---|
| Predominio de los sistemas informales de semillas en el suministro de semillas | -1.1% | África Subsahariana, zonas rurales | Largo plazo (≥ 4 años) |
| Las regulaciones fragmentadas sobre organismos genéticamente modificados retrasan las aprobaciones transgénicas | -0.7% | Nigeria, Ghana, Kenia y Tanzania | Mediano plazo (2-4 años) |
| Las semillas falsificadas erosionan la confianza de los agricultores | -0.6% | Nigeria, Kenia, Ghana y Tanzania | Corto plazo (≤ 2 años) |
| Aumento de los costos de producción de híbridos | -0.4% | Global, con impacto en los agricultores de pequeña escala | Mediano plazo (2-4 años) |
| Fuente: Mordor Intelligence | |||
Predominio de los Sistemas Informales de Semillas en el Suministro de Semillas
Los sistemas tradicionales de semillas continúan abasteciendo a los agricultores con sus necesidades de semillas en toda el África Subsahariana, limitando la penetración del mercado comercial de semillas a pesar de las ventajas en calidad y rendimiento de las variedades certificadas. La Agencia Central de Estadísticas de Etiopía informó que la mayoría de los agricultores de pequeña escala dependen de semillas guardadas en la finca e intercambios informales, lo que limita las tasas de adopción de híbridos. Esta preferencia surge de prácticas culturales, limitaciones económicas y estrategias agrícolas adversas al riesgo que priorizan la seguridad de las semillas sobre la maximización del rendimiento. Las redes informales de semillas de Tanzania suministran variedades de cultivos tradicionales, creando sistemas de distribución paralelos que compiten directamente con los canales comerciales, manteniendo la diversidad genética pero limitando las ganancias de productividad.
Regulaciones Fragmentadas sobre Organismos Genéticamente Modificados que Retrasan las Aprobaciones Transgénicas
Las políticas biotecnológicas inconsistentes en los países africanos crean incertidumbre regulatoria que retrasa la comercialización de cultivos transgénicos y aumenta los costos de desarrollo para las empresas semilleras. La Agencia Nacional de Desarrollo Biotecnológico de Nigeria aprobó variedades de algodón Bt y caupí en 2024, mientras que la vecina Ghana mantiene políticas restrictivas sobre Organismos Genéticamente Modificados (OGM) que impiden el despliegue de tecnología similar. La moratoria de una década sobre los OGM en Kenia, parcialmente levantada en 2024, ilustra la volatilidad regulatoria que desincentiva las inversiones biotecnológicas a largo plazo. Estas inconsistencias de política fragmentan el mercado continental en zonas favorables a la biotecnología y zonas restrictivas, limitando las economías de escala para el desarrollo de semillas transgénicas.
*Nuestras previsiones consideran los impactos de impulsores y restricciones como direccionales, no aditivos. Las previsiones de impacto reflejan el crecimiento base, los efectos de mezcla y las interacciones entre variables.
Análisis de Segmentos
Por Tecnología de Mejoramiento: Los Híbridos Mantienen el Liderazgo en Medio de la Tensión por la Asequibilidad
Los híbridos dominan el mercado de semillas de África con una participación del 60,3% en 2025, impulsados por un rendimiento superior y una creciente conciencia de los agricultores sobre los beneficios de productividad. Las variedades de polinización abierta demuestran un crecimiento más rápido, con una CAGR del 4,9% hasta 2031, lo que refleja las preferencias de los agricultores conscientes de los costos y el enfoque de las empresas de mejoramiento en el desarrollo de variedades asequibles. Dentro de las categorías de híbridos, las variedades no transgénicas mantienen el liderazgo del mercado, mientras que los híbridos transgénicos ganan terreno en países favorables a la biotecnología como Sudáfrica y Nigeria. Los híbridos tolerantes a herbicidas muestran un potencial particular en los sistemas de agricultura mecanizada, mientras que las variedades resistentes a insectos abordan la presión de plagas en la producción de algodón y maíz.
El panorama de la tecnología de mejoramiento refleja tendencias más amplias de modernización agrícola, con agricultores que gradualmente transitan desde variedades tradicionales hacia genética mejorada. La experiencia de Kenia demuestra esta evolución, donde la adopción de maíz híbrido aumentó, respaldada por los servicios de extensión del gobierno y las parcelas de demostración de las empresas semilleras, la Organización de Investigación Agrícola y Ganadera de Kenia.


Por Mecanismo de Cultivo: Los Sistemas Protegidos se Aceleran desde una Base Pequeña
El cultivo en campo abierto representa el 99,9% del mercado de semillas de África en 2025, lo que refleja la estructura predominantemente de pequeña escala de la agricultura africana y la infraestructura limitada para la agricultura en entorno controlado. El cultivo protegido demuestra un potencial de crecimiento excepcional, con una CAGR del 7,6% hasta 2031, impulsado por la producción de cultivos de alto valor y las estrategias de adaptación climática. Egipto lidera en la adopción del cultivo protegido, con producción de hortalizas en invernadero, mientras que la provincia del Cabo Occidental de Sudáfrica experimenta una rápida expansión en sistemas de invernaderos de flores y hortalizas.
El crecimiento del cultivo protegido se correlaciona con las tendencias de urbanización y la creciente demanda de productos frescos durante todo el año. La industria de invernaderos de Kenia, que generó sólidos ingresos de exportación en 2024, demuestra la viabilidad económica de la agricultura en entorno controlado en contextos africanos. El clúster de invernaderos de Marruecos en la provincia de Agadir abastece a los mercados europeos con hortalizas fuera de temporada, ilustrando el potencial exportador de los sistemas de cultivo protegido. Estos desarrollos crean una demanda especializada de semillas para variedades adaptadas a invernadero que requieren características específicas, como hábitos de crecimiento determinado, resistencia a enfermedades y patrones de madurez uniforme.
Por Tipo de Cultivo: Las Hortalizas Emergen como el Motor de Crecimiento
Los cultivos en hilera representan el 77,4% del mercado de semillas de África en 2025, dominados por granos básicos y cereales que constituyen la base de los sistemas de seguridad alimentaria de la región. Las hortalizas exhiben una dinámica de crecimiento superior, con una CAGR del 5,4% hasta 2031, impulsada por la urbanización, la diversificación dietética y el desarrollo de mercados de exportación. Dentro de los cultivos en hilera, los granos y cereales lideran la demanda, seguidos por las oleaginosas que se benefician de la expansión del procesamiento de aceite de cocina. Los cultivos de fibra, particularmente el algodón, enfrentan desafíos de los materiales sintéticos, pero siguen siendo importantes en las economías de África Occidental.
La demanda de semillas hortícolas está influenciada por los cambios en los patrones de consumo, ya que las poblaciones urbanas buscan cada vez más opciones alimentarias diversas y nutritivas más allá de los alimentos básicos tradicionales. En Nigeria, la industria de procesamiento de tomate impulsa significativamente la demanda de semillas de tomate híbrido, fomentando vínculos hacia atrás con los agricultores de pequeña escala a través de la Asociación de Productores de Tomate de Nigeria. Entre las hortalizas, las variedades de Solanáceas, como tomates, pimientos y berenjenas, exhiben el mayor crecimiento, seguidas por las Brasicáceas y las Cucurbitáceas. Las hortalizas de raíz y bulbo, incluidas las cebollas y las papas, se benefician de los avances en las industrias de almacenamiento y procesamiento. Adicionalmente, las hortalizas no clasificadas como la lechuga y la espinaca están ganando popularidad debido a su papel en los sistemas de agricultura urbana y la producción orientada a la exportación.
Análisis Geográfico
El mercado de semillas en Nigeria sigue siendo un área clave de crecimiento dentro de África, con una participación del 41,6% en 2025, respaldado por un presupuesto nacional que prioriza las semillas certificadas de maíz, arroz y caupí. El gobierno está utilizando sistemas de vales electrónicos basados en dispositivos móviles para mejorar el control de calidad. Sin embargo, el mercado formal enfrenta desafíos debido al predominio de un sector informal de semillas y la prevalencia de productos falsificados. En contraste, Egipto y Sudáfrica son centros establecidos en el continente, con biotecnología avanzada y cultivo protegido que impulsan la especialización en semillas de alto valor.
Sudáfrica continúa liderando en la agricultura comercial a gran escala, beneficiándose de un marco de bioseguridad bien desarrollado para el maíz Bt y los avances en tecnologías de edición genética. En África, Kenia experimenta un crecimiento significativo con una CAGR del 6,2% durante el período de pronóstico, impulsado por la Agenda de Transformación Económica de Base y los rigurosos procesos de certificación aplicados por los reguladores nacionales. La adopción de herramientas digitales por parte de Kenia, incluidas plataformas de asesoramiento móvil y tecnología financiera, la posiciona como un campo de prueba líder para modelos de distribución de último kilómetro basados en datos, que ahora se están escalando en toda la región.
Etiopía y Tanzania presentan oportunidades notables a través de corredores de irrigación dedicados, como las tierras altas del sur de Tanzania y los afluentes del Nilo Azul de Etiopía. En Ghana, el mercado ha evolucionado tras la liberación ambiental de varias variedades de OGM, lo que ha reducido la reticencia biotecnológica anterior y ha ampliado el potencial de producción de granos. El crecimiento regional está cada vez más respaldado por los protocolos de semillas del AfCFTA, que buscan armonizar las regulaciones y permitir a las empresas distribuir los costos de investigación y desarrollo en superficies transfronterizas más amplias.
Panorama Competitivo
El mercado de semillas africano tiene una baja concentración de mercado, donde numerosos actores compiten por la participación de mercado. Los cinco principales actores, incluidos Bayer AG, Syngenta Group, Corteva Agrisciences, East-West Seed y Kenya Seed Company, tienen una participación significativa debido a sus amplios portafolios de productos, sólidas redes de distribución e inversiones en investigación y desarrollo para el desarrollo de nuevas variedades de semillas específicamente adaptadas a las condiciones africanas.
Las corporaciones multinacionales y los actores locales operan en un mercado fragmentado donde el cumplimiento regulatorio es tan importante como el desempeño del producto. Bayer AG aprovecha sus capacidades globales de investigación y desarrollo mientras localiza cada vez más la producción. Este enfoque se destaca por la apertura planificada de una instalación de semillas de maíz en Zambia en marzo de 2025, con el objetivo de cumplir con las reglas de origen del Área de Libre Comercio Continental Africana (AfCFTA) y reducir los riesgos cambiarios. Las principales empresas también están invirtiendo en plataformas digitales, con Bayer reportando un crecimiento significativo en la participación de usuarios africanos a través de sus herramientas Climate FieldView y BayG.A.P. en 2025. Mientras tanto, empresas como East-West Seed y FICA Seeds (Uganda) se centran en sólidas relaciones con los agricultores y la adaptabilidad, superando a menudo a competidores más grandes en mercados regionales específicos, como las hortalizas indígenas.
La innovación en la distribución ha surgido como un enfoque competitivo clave. Las empresas se esfuerzan por optimizar los formatos de micropaquetes, integrar sistemas de pago móvil y mejorar la logística de último kilómetro para servir mejor a los agricultores de pequeña escala. Las plataformas Cropwise y Centaur de Syngenta han experimentado una rápida expansión, con la empresa apuntando a millones de pequeños agricultores para 2025 a través de servicios de asesoramiento digital diseñados para generar confianza. Corteva Agriscience está fortaleciendo su presencia en África a través de asociaciones académicas estratégicas, como su colaboración con la Universidad de Pretoria, para mejorar las capacidades de mejoramiento local y desarrollar talento para el crecimiento del mercado a largo plazo.
Los protocolos de semillas del Área de Libre Comercio Continental Africana (AfCFTA) están transformando la dinámica competitiva al armonizar las regulaciones de semillas, permitiendo eficiencias de producción transfronteriza. Esto permite a las empresas centralizar los esfuerzos de mejoramiento en centros regionales de excelencia mientras atienden múltiples mercados bajo un único registro. Tales cambios benefician a los actores con escala regional y experiencia regulatoria avanzada, lo que potencialmente impulsa la consolidación de la industria. Sin embargo, los especialistas locales como Kenya Seed Company y Zamseed continúan abordando las necesidades culturales y agroecológicas que las empresas globales pasan por alto, particularmente en cultivos resistentes al clima como el sorgo, el mijo y las verduras de hoja indígenas.
Líderes de la Industria de Semillas de África
BASF SE
Bayer AG
Corteva Agriscience
Groupe Limagrain
Syngenta Group
- *Nota aclaratoria: los principales jugadores no se ordenaron de un modo en especial


Desarrollos Recientes de la Industria
- Septiembre de 2025: Bejo y Tropic inician una Asociación Estratégica para proporcionar Resistencia Duradera a Enfermedades en semillas de zanahoria utilizando tecnología GEiGS (Silenciamiento Génico). La colaboración tiene como objetivo crear resistencia no transgénica, sostenible y duradera contra patógenos del suelo y foliares en el germoplasma élite de zanahoria de Bejo, abordando las pérdidas de rendimiento.
- Mayo de 2025: East-West Seed estableció una instalación de producción de semillas hortícolas en Tanzania, apuntando a los mercados regionales con variedades de semillas híbridas de berenjena africana resistentes al cliente para agricultores de pequeña escala.
- Marzo de 2025: Bayer estableció una instalación de procesamiento de semillas de maíz en Kabwe, Zambia. La nueva instalación, denominada
Baya Itaba,
tiene como objetivo triplicar la capacidad de producción de semillas de la empresa en Zambia para proporcionar a los agricultores de pequeña escala un mayor acceso a semillas de maíz de alta calidad.


Alcance del Informe del Mercado de Semillas de África
Una semilla es el óvulo fertilizado y maduro de una planta con flores (angiosperma) o gimnosperma, que contiene una planta embrionaria, nutrientes almacenados (endospermo) y una cubierta exterior protectora (testa). El Informe del Mercado de Semillas de África está Segmentado por Tecnología de Mejoramiento (Híbridos y Más), Mecanismo de Cultivo (Campo Abierto y Cultivo Protegido), Tipo de Cultivo (Cultivos en Hilera y Hortalizas), y Geografía (Egipto, Etiopía, Ghana y Más). Los Pronósticos del Mercado se Proporcionan en Términos de Valor (USD) y Volumen (Toneladas Métricas).
| Híbridos | Híbridos No Transgénicos | |
| Híbridos Transgénicos | Híbridos Tolerantes a Herbicidas | |
| Híbridos Resistentes a Insectos | ||
| Variedades de Polinización Abierta y Derivados Híbridos | ||
| Campo Abierto |
| Cultivo Protegido |
| Cultivos en Hilera | Cultivos de Fibra | Algodón |
| Otros Cultivos de Fibra | ||
| Cultivos Forrajeros | Alfalfa | |
| Maíz Forrajero | ||
| Sorgo Forrajero | ||
| Otros Cultivos Forrajeros | ||
| Granos y Cereales | Maíz | |
| Arroz | ||
| Sorgo | ||
| Trigo | ||
| Otros Granos y Cereales | ||
| Oleaginosas | Canola, Colza y Mostaza | |
| Soja | ||
| Girasol | ||
| Otras Oleaginosas | ||
| Legumbres | ||
| Hortalizas | Brasicáceas | Repollo |
| Zanahoria | ||
| Coliflor y Brócoli | ||
| Otras Brasicáceas | ||
| Cucurbitáceas | Pepino y Pepinillo | |
| Calabaza y Zapallo | ||
| Otras Cucurbitáceas | ||
| Raíces y Bulbos | Ajo | |
| Cebolla | ||
| Papa | ||
| Otras Raíces y Bulbos | ||
| Solanáceas | Chile | |
| Berenjena | ||
| Tomate | ||
| Otras Solanáceas | ||
| Hortalizas No Clasificadas | Espárrago | |
| Lechuga | ||
| Okra | ||
| Guisantes | ||
| Espinaca | ||
| Otras Hortalizas No Clasificadas | ||
| Egipto |
| Etiopía |
| Ghana |
| Kenia |
| Nigeria |
| Sudáfrica |
| Tanzania |
| Resto de África |
| Tecnología de Mejoramiento | Híbridos | Híbridos No Transgénicos | |
| Híbridos Transgénicos | Híbridos Tolerantes a Herbicidas | ||
| Híbridos Resistentes a Insectos | |||
| Variedades de Polinización Abierta y Derivados Híbridos | |||
| Mecanismo de Cultivo | Campo Abierto | ||
| Cultivo Protegido | |||
| Tipo de Cultivo | Cultivos en Hilera | Cultivos de Fibra | Algodón |
| Otros Cultivos de Fibra | |||
| Cultivos Forrajeros | Alfalfa | ||
| Maíz Forrajero | |||
| Sorgo Forrajero | |||
| Otros Cultivos Forrajeros | |||
| Granos y Cereales | Maíz | ||
| Arroz | |||
| Sorgo | |||
| Trigo | |||
| Otros Granos y Cereales | |||
| Oleaginosas | Canola, Colza y Mostaza | ||
| Soja | |||
| Girasol | |||
| Otras Oleaginosas | |||
| Legumbres | |||
| Hortalizas | Brasicáceas | Repollo | |
| Zanahoria | |||
| Coliflor y Brócoli | |||
| Otras Brasicáceas | |||
| Cucurbitáceas | Pepino y Pepinillo | ||
| Calabaza y Zapallo | |||
| Otras Cucurbitáceas | |||
| Raíces y Bulbos | Ajo | ||
| Cebolla | |||
| Papa | |||
| Otras Raíces y Bulbos | |||
| Solanáceas | Chile | ||
| Berenjena | |||
| Tomate | |||
| Otras Solanáceas | |||
| Hortalizas No Clasificadas | Espárrago | ||
| Lechuga | |||
| Okra | |||
| Guisantes | |||
| Espinaca | |||
| Otras Hortalizas No Clasificadas | |||
| País | Egipto | ||
| Etiopía | |||
| Ghana | |||
| Kenia | |||
| Nigeria | |||
| Sudáfrica | |||
| Tanzania | |||
| Resto de África | |||


Definición de mercado
- Semilla Comercial - Para los fines de este estudio, solo se han incluido las semillas comerciales dentro del alcance. Las semillas guardadas en la finca, que no están etiquetadas comercialmente, quedan excluidas del alcance, aunque un pequeño porcentaje de semillas guardadas en la finca se intercambia comercialmente entre agricultores. El alcance también excluye los cultivos reproducidos vegetativamente y las partes de plantas que pueden venderse comercialmente en el mercado.
- Superficie de Cultivo - Al calcular la superficie bajo diferentes cultivos, se ha considerado la Superficie Bruta Cultivada. También conocida como Superficie Cosechada, según la Organización de las Naciones Unidas para la Alimentación y la Agricultura (FAO), esto incluye la superficie total cultivada bajo un cultivo particular a lo largo de las temporadas.
- Tasa de Reemplazo de Semillas - La Tasa de Reemplazo de Semillas es el porcentaje de superficie sembrada del total de la superficie del cultivo plantado en la temporada utilizando semillas certificadas o de calidad distintas de las semillas guardadas en la finca.
- Cultivo Protegido - El informe define el cultivo protegido como el proceso de cultivar plantas en un entorno controlado. Esto incluye invernaderos, casas de vidrio, hidroponía, aeroponía o cualquier otro sistema de cultivo que proteja el cultivo contra cualquier estrés abiótico. Sin embargo, el cultivo en campo abierto utilizando acolchado plástico queda excluido de esta definición y se incluye bajo campo abierto.
| Palabra clave | Definición |
|---|---|
| Cultivos en Hilera | Estos son generalmente los cultivos de campo que incluyen las diferentes categorías de cultivos como granos y cereales, oleaginosas, cultivos de fibra como el algodón, legumbres y cultivos forrajeros. |
| Solanáceas | Esta es la familia de plantas con flores que incluye el tomate, el chile, las berenjenas y otros cultivos. |
| Cucurbitáceas | Representa una familia de cucurbitáceas que consta de aproximadamente 965 especies en alrededor de 95 géneros. Los principales cultivos considerados para este estudio incluyen el pepino y pepinillo, la calabaza y el zapallo, y otros cultivos. |
| Brasicáceas | Es un género de plantas de la familia del repollo y la mostaza. Incluye cultivos como zanahorias, repollo, coliflor y brócoli. |
| Raíces y Bulbos | El segmento de raíces y bulbos incluye cebolla, ajo, papa y otros cultivos. |
| Hortalizas No Clasificadas | Este segmento en el informe incluye los cultivos que no pertenecen a ninguna de las categorías mencionadas anteriormente. Estos incluyen cultivos como okra, espárrago, lechuga, guisantes, espinaca y otros. |
| Semilla Híbrida | Es la primera generación de semilla producida mediante el control de la polinización cruzada y la combinación de dos o más variedades o especies. |
| Semilla Transgénica | Es una semilla que ha sido modificada genéticamente para contener ciertos rasgos de entrada y/o salida deseables. |
| Semilla No Transgénica | La semilla producida mediante polinización cruzada sin ninguna modificación genética. |
| Variedades de Polinización Abierta y Derivados Híbridos | Las variedades de polinización abierta producen semillas fieles al tipo, ya que se polinizan de forma cruzada solo con otras plantas de la misma variedad. |
| Otras Solanáceas | Los cultivos considerados bajo otras Solanáceas incluyen pimientos morrones y otros pimientos diferentes según la localidad de los respectivos países. |
| Otras Brasicáceas | Los cultivos considerados bajo otras brasicáceas incluyen rábanos, nabos, coles de Bruselas y col rizada. |
| Otras Raíces y Bulbos | Los cultivos considerados bajo otras raíces y bulbos incluyen batatas y yuca. |
| Otras Cucurbitáceas | Los cultivos considerados bajo otras cucurbitáceas incluyen calabazas (calabaza de botella, calabaza amarga, calabaza de cresta, calabaza serpiente y otras). |
| Otros Granos y Cereales | Los cultivos considerados bajo otros granos y cereales incluyen cebada, trigo sarraceno, semilla de alpiste, triticale, avena, mijos y centeno. |
| Otros Cultivos de Fibra | Los cultivos considerados bajo otras fibras incluyen cáñamo, yute, fibras de agave, lino, kenaf, ramio, abacá, sisal y kapok. |
| Otras Oleaginosas | Los cultivos considerados bajo otras oleaginosas incluyen maní, semilla de cáñamo, semilla de mostaza, semillas de ricino, semillas de cártamo, semillas de sésamo y semillas de lino. |
| Otros Cultivos Forrajeros | Los cultivos considerados bajo otros forrajes incluyen pasto napier, pasto de avena, trébol blanco, raigrás y timoteo. Los otros cultivos forrajeros se consideraron según la localidad de los respectivos países. |
| Legumbres | Los guandules, las lentejas, las habas y las habas de caballo, las vezas, los garbanzos, los caupíes, los altramuces y los frijoles bambara son los cultivos considerados bajo legumbres. |
| Otras Hortalizas No Clasificadas | Los cultivos considerados bajo otras hortalizas no clasificadas incluyen alcachofas, hojas de yuca, puerros, achicoria y judías verdes. |


Metodología de Investigación
Mordor Intelligence sigue una metodología de cuatro pasos en todos nuestros informes.
- Paso 1: IDENTIFICAR LAS VARIABLES CLAVE: Con el fin de construir una metodología de pronóstico sólida, las variables y factores identificados en el Paso 1 se contrastan con los datos históricos de mercado disponibles. A través de un proceso iterativo, se establecen las variables necesarias para el pronóstico del mercado y el modelo se construye sobre la base de estas variables.
- Paso 2: Construir un Modelo de Mercado: Las estimaciones del tamaño del mercado para los años de pronóstico se expresan en términos nominales. La inflación no forma parte de la fijación de precios, y el precio de venta promedio (PVP) se mantiene constante durante todo el período de pronóstico.
- Paso 3: Validar y Finalizar: En este importante paso, todos los datos de mercado, variables y criterios de los analistas se validan a través de una extensa red de expertos en investigación primaria del mercado estudiado. Los encuestados se seleccionan en todos los niveles y funciones para generar una imagen holística del mercado estudiado.
- Paso 4: Resultados de la Investigación: Informes Sindicados, Asignaciones de Consultoría Personalizada, Bases de Datos y Plataformas de Suscripción


