
Automotive Wiring Harness Market Size and Share
Market Overview
| Study Period | 2021 - 2031 |
|---|---|
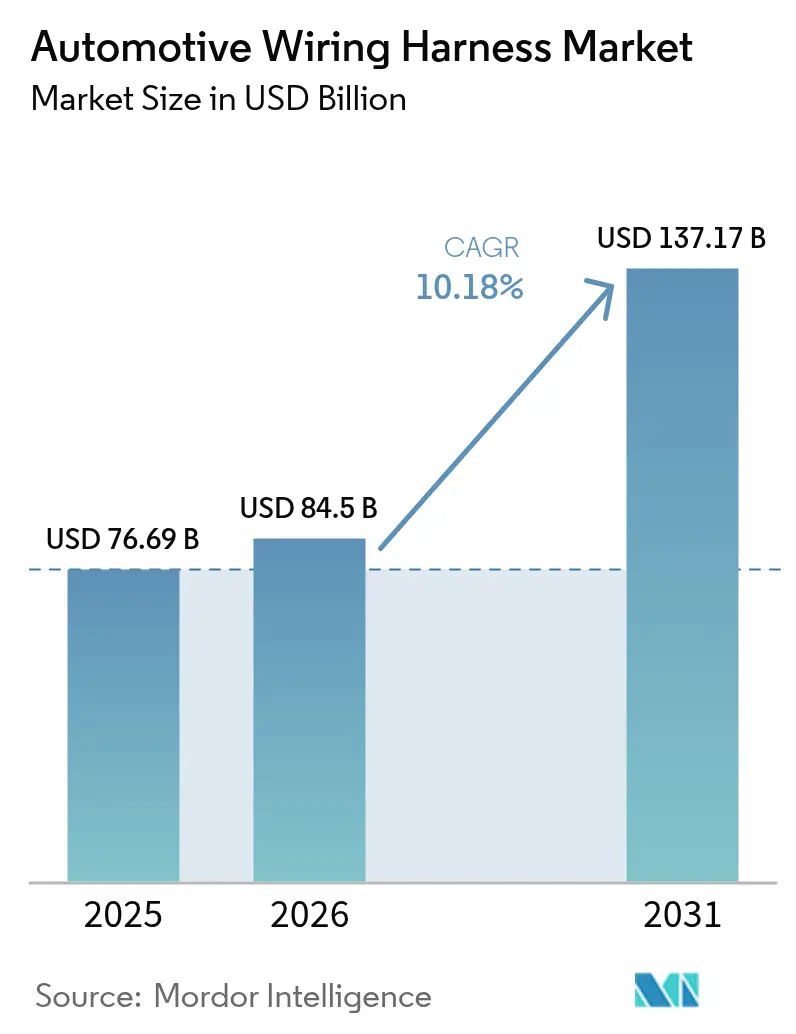
| Market Size (2026) | USD 84.5 Billion |
| Market Size (2031) | USD 137.17 Billion |
| Growth Rate (2026 - 2031) | 10.18% CAGR |
| Fastest Growing Market | Africa |
| Largest Market | Asia-Pacific |
| Market Concentration | Medium |
Major Players
*Disclaimer: Major Players sorted in no particular order Image © Mordor Intelligence. Reuse requires attribution under CC BY 4.0. |
|
Automotive Wiring Harness Market Analysis by Mordor Intelligence
Automotive Wiring Harness Market size in 2026 is estimated at USD 84.5 billion, growing from 2025 value of USD 76.69 billion with 2031 projections showing USD 137.17 billion, growing at 10.18% CAGR over 2026-2031. The market is expanding steadily on the back of rising electronic content per vehicle, but the headline growth masks two contrasting currents: demand for high-voltage harnesses used in battery-electric vehicles is rising at a double-digit pace, while traditional low-voltage ICE looms are seeing price compression. Regionally, Asia remains the production and consumption hub, Africa is attracting new capacity thanks to favorable labor economics and local-content rules, and mature markets in North America and Europe are pivoting toward zonal electrical architectures that shorten cable runs yet increase the value of each remaining line.
Key Report Takeaways
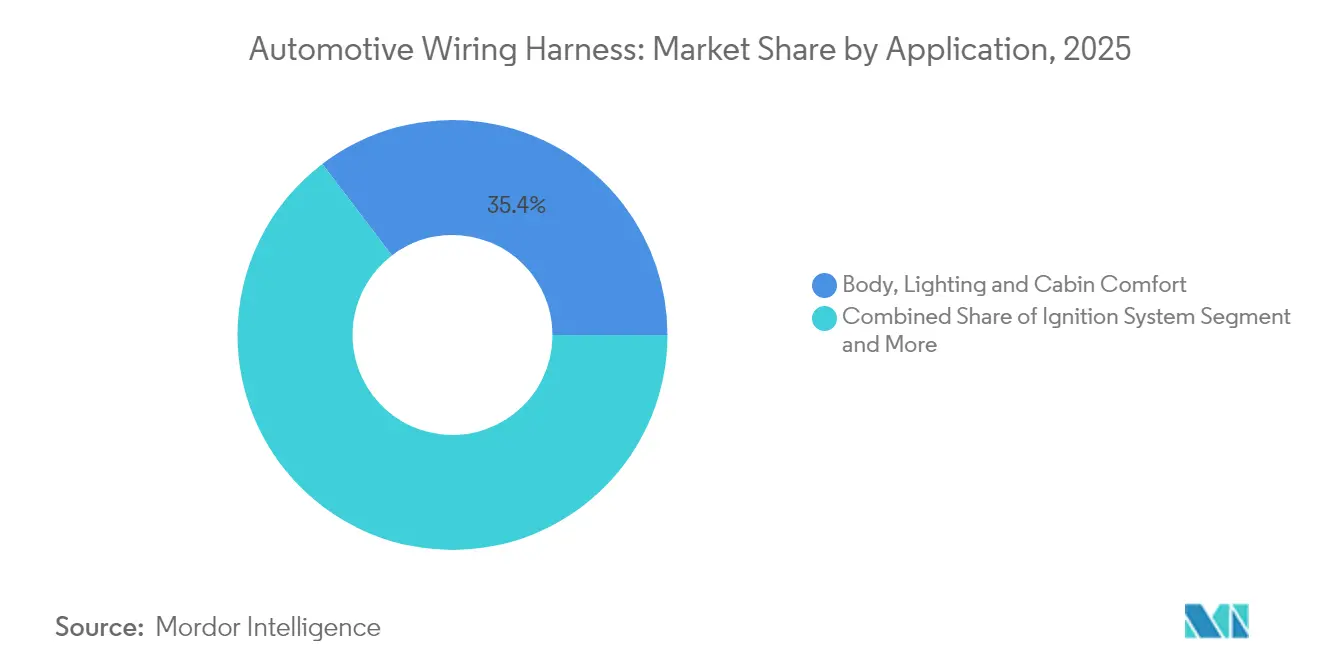
- By application type, body, lighting and cabin wiring harness led with 35.35% of automotive wiring harness market share in 2025, whereas charging and power supply system are expanding at an 25.44% CAGR through 2031.
- By conductor material, copper accounts 93.45% share of the automotive wiring harness market in 2025, while Aluminum is projected to grow at 11.95% CAGR to 2031.
- By voltage rating, the low voltage wiring harness segment accounted for 83.15% share of the automotive wiring harness market size in 2025; the high voltage wiring harness is forecast to advance at 16.98% CAGR between 2026-2031.
- By Propulsion type, internal combustion engine held 73.60% of automotive wiring harness market share in 2025, whereas battery electric vehicles (BEVs) is on track for a 25.57% CAGR through 2031.
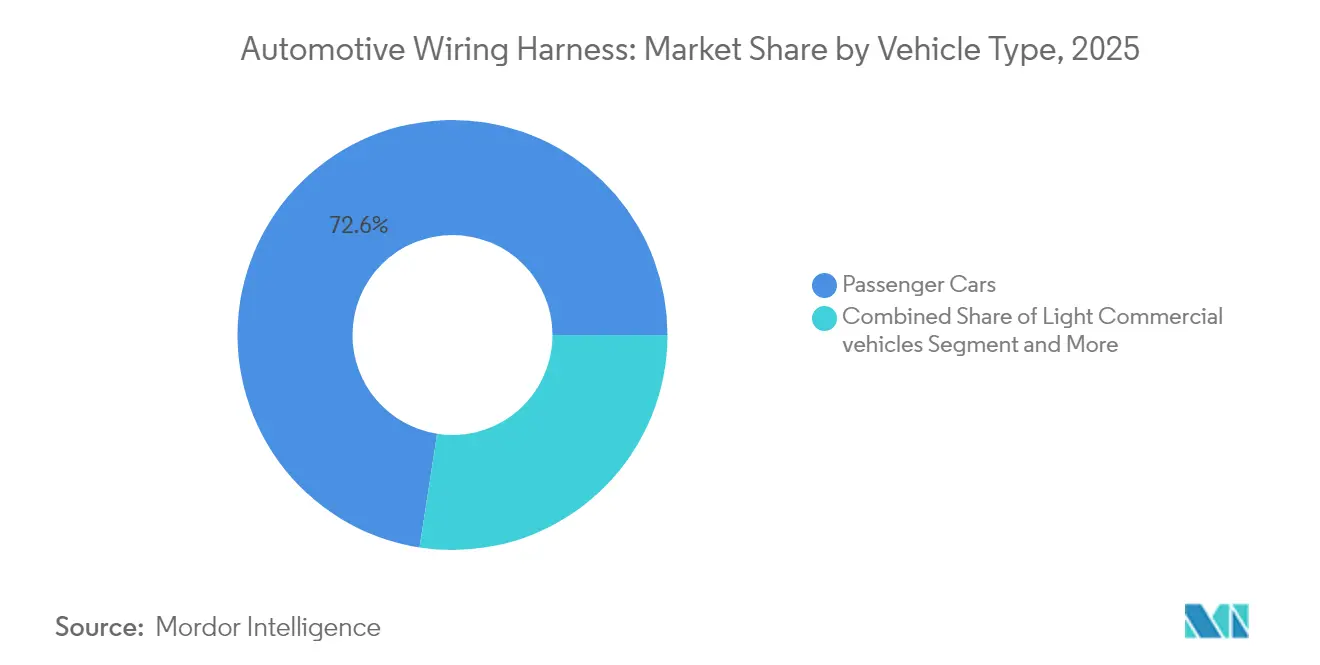
- By vehicle, passenger car a 72.55% share in 2025, but light commercial vehicle are scaling fastest at 11.37% CAGR.
- By sales channel, OEM accounts for 91.85% share in 2025, however aftermarket is growing at 8.23% CAGR.
- By geography, Asia Pacific captured 48.40% share in 2025; the Africa is expected to post the highest 11.79% CAGR to 2031.
Note: Market size and forecast figures in this report are generated using Mordor Intelligence’s proprietary estimation framework, updated with the latest available data and insights as of 2026.
Global Automotive Wiring Harness Market Trends and Insights
Drivers Impact Analysis*
| Driver | (~) % Point Impact on Market CAGR | Geographic Relevance | Impact Timeline |
|---|---|---|---|
| Electrification of Vehicles | +1.2% | Asia, Europe, North America | Medium term (2-4 years) |
| Shift Toward E/E Architectures | +1.0% | Europe, North America | Long term (≥4 years) |
| Autonomous Vehicle Development | +0.9% | North America, Europe, China | Long term (≥4 years) |
| OEM Push for Lightweight Harnesses | +0.8% | Global | Medium term (2-4 years) |
| Regulatory Mandates for ADAS | +0.7% | North America, Japan, Europe | Short term (≤2 years) |
| Rising Local Content Rules | +0.6% | India, Mexico, Morocco | Short term (≤2 years) |
| Source: Mordor Intelligence | |||


Electrification-Driven Surge in High-Voltage Harness Demand
Rising battery pack voltages to 800 V and even 1000 V are spurring a new class of cable assemblies that carry greater thermal loads while meeting tight electromagnetic-compatibility (EMC) targets. Many Chinese brands now specify aluminum-based conductors for main traction lines, directly linking material innovation to EV cost reduction. Because aluminum requires revised joining techniques, suppliers are investing in friction and laser welding cells at a pace unseen five years ago. An emerging inference is that welding know-how may soon overshadow raw copper sourcing as the key competitive barrier.[1]Sumitomo Electric Industries, Ltd. "Sumitomo Electric Technical Review." sumitomoelectric.com
OEM Push for Lightweight Aluminum and Optical Harnesses
Automakers continue to chase every gram of weight saving, and wiring can account for more than 20 kg in premium cars. Aluminum conductors slash mass by roughly 60% relative to copper and also cut exposure to copper-price swings. The downside—lower conductivity—is being offset through multi-strand designs and bimetal terminals that keep contact resistance within specification. As connection technology matures, several OEMs have introduced mixed conductor looms that pair aluminum power lines with optical fibres for data, hinting that the next frontier will lie in hybrid composite bundles rather than single-metal solutions.
Shift Toward Centralized Zonal E/E Architectures in Premium Cars
European luxury platforms are transitioning from domain-based layouts to zonal structures that shorten runs and consolidate electronic control units (ECUs). Simulation work shows potential harness length cuts of up to 40 % without sacrificing functionality. However, each remaining cable must handle more data and power density, raising specification levels and unit value. The balance of fewer metres but higher performance suggests that revenue per vehicle may stay stable even as copper tonnage falls, a nuance that is reshaping supplier pricing models.
Regulatory Mandates for ADAS Wiring Redundancy
New Car Assessment Program (NCAP) updates in the United States and Japan now grade lane-keeping, blind-spot and pedestrian braking systems with stringent fail-operational requirements. Redundancy is therefore moving from powertrain controllers to sensor loops and actuation lines. Harness makers must double up certain pathways or introduce ring topologies to ensure continuity after a single-point failure. The result is that even non-luxury models can require complex safety looms where reliability rather than cost is the design driver, potentially creating a premium niche within an otherwise commoditising segment.
Restraints Impact Analysis*
| Restraint | (~) % Point Impact on Market CAGR | Geographic Relevance | Impact Timeline |
|---|---|---|---|
| Volatile Copper & Resin Prices | -0.9% | Global | Short term (≤2 years) |
| EV-Specific Thermal & EMC Challenges | -0.6% | Global | Medium term (2-4 years) |
| Manufacturing Automation Limitations | -0.5% | Global | Long term (≥4 years) |
| Mismatch Between Design Complexity & Skilled Labor | -0.3% | ASEAN | Medium term (2-4 years) |
| Source: Mordor Intelligence | |||
Margin Pressure from Volatile Copper and Resin Prices
Copper accounts for well over half of total bill-of-materials cost in a conventional loom, so recent price gyrations have compressed supplier gross margin. Although most line-fit contracts include pass-through clauses, automakers are increasingly reluctant to accept mid-cycle price increases. Suppliers are therefore hedging on commodity exchanges and diversifying into aluminum as a risk-spreading measure. The situation underscores that financial engineering and procurement sophistication are becoming as important as core engineering in safeguarding profitability.
EV-Specific Thermal and EMC Challenges Raising Validation Costs
High-voltage cables generate more heat and emit stronger electromagnetic fields than legacy 12 V lines. To prevent cross-talk and meet ISO 6722 temperature limits, harnesses now employ multi-layer shielding and liquid cooling in select high-current paths. Extended validation cycles, including thermal-shock and radiation-exposure tests, add both time and cost before start of production. An unspoken implication is that smaller suppliers without dedicated test rigs may struggle to qualify for premium EV programs, reinforcing scale advantages for large incumbents.
*Our forecasts treat driver/restraint impacts as directional, not additive. The impact forecasts reflect baseline growth, mix effects, and variable interactions.
Segment Analysis
By Application: Body Systems Drive Volume While High-Voltage Leads Growth
Body, Lighting, and Cabin Comfort systems command the largest share of the Automotive Wiring Harness market size in 2025, accounting for 35.35% of the market size. High LED adoption, power lift-gates, and multi-zone climate modules explain persistent demand. An interesting observation is that the same comfort features that boost volume also complicate final vehicle assembly, nudging OEMs to request pre-configured sub-looms that snap into dashboards and door panels.
Charging and power supply system harnesses show the fastest forecast CAGR expanding at an 25.44% through 2031, expanding in the mid-teens as more electric models reach showrooms. These harnesses must endure temperature spikes and mechanical vibration around battery packs, so higher-grade insulation materials are becoming mainstream. Suppliers that master liquid-cooling sleeves and low-profile shielding will likely command premium price points. Over time, expertise in high-voltage routing may provide cross-selling entry into battery management systems.


By Conductor Material: Aluminum Challenges Copper's Dominance
Copper retains around 93.45% of the Automotive Wiring Harness market share today, supported by unmatched conductivity and a century of process know-how. Yet its density and volatile cost profile keep pressure on OEM purchasing departments to pursue alternatives. An emerging pattern is the bundling of copper data pairs with aluminum power cores in the same trunk line, achieving weight reduction without sacrificing signal integrity.
Aluminum’s forecast CAGR is 11.95% by 2031, easily outpacing the broader Automotive Wiring Harness industry trajectory. Advances in anti-corrosion terminals and friction-weld splice techniques have removed earlier reliability concerns. Because aluminum is price-stable relative to copper, finance teams increasingly model its use as a hedge. The shift indicates that material science choices now intersect directly with treasury risk management strategies inside large suppliers.
By Voltage Rating: High-Voltage Systems Reshape Market Dynamics
Low-Voltage systems dominate the market with 83.15% share in 2025, reflecting their ubiquitous presence in all vehicle types for traditional functions from lighting to entertainment. Their design principles are mature, and unit costs are well understood, making them ideal for high-volume automation. Despite that stability, low-voltage looms are under pressure to incorporate thinner insulation and standardized connectors to shave grams in BEV platforms.
High-voltage harnesses above 60 V record a forecast of 16.98% CAGR and inject fresh revenue into the automotive wiring harnesses industry. To contain partial-discharge risk, producers increasingly rely on peroxide-cross-linked polyethylene and silicone blends. Because these polymers have longer lead times than PVC, procurement lead-time planning has become a competitive differentiator. A secondary effect is growing collaboration between chemical suppliers and harness makers, signalling deeper vertical integration.
By Propulsion Type: BEVs Drive Innovation While ICE Maintains Volume
Internal Combustion Engine Vehicles maintain the largest market share at 73.60% in 2025, reflecting their continued dominance in global vehicle production despite declining growth rates. Continuous engine downsizing and turbocharging, however, call for higher temperature ratings even in traditional bundles, so product families are quietly evolving. Proven ICE harness capacity is also being redeployed to mild-hybrid 48 V applications, extending asset life.
Battery Electric Vehicles exhibit the highest CAGR of 25.57% and catalyse most new product introductions, from flat wire ribbon designs to liquid-cooled busbars. Because BEVs need fewer maintenance visits, dealerships may see reduced parts revenue, which in turn pushes OEMs to front-load harness reliability requirements. The shift suggests that quality audits on supplier shop floors will tighten further as warranty-cost avoidance becomes a priority.
By Vehicle Type: Heavy-Duty Segment Outpaces Passenger Cars
Passenger Cars dominate the market with 72.55% share in 2025, reflecting their high production volumes and increasing electronic content. Multi-camera ADAS suites in premium models are adding coax and Ethernet lines that increase data capacity tenfold relative to mid-cycle vehicles launched just five years earlier. That escalation hints that in-vehicle data networks may soon require their thermal management inside headliners.
Light commercial vehicle post the fastest growth rate of 11.37% as fleet decarbonisation, connectivity mandates, and specialist body variations expand the harness content. Last-mile delivey vehicles need higher-amp charging loops and multiple temperature sensors per battery module, materially boosting cable length per chassis.
By Sales Channel: Aftermarket Growth Outpaces OEM Dominance
The OEM channel dominates with 91.85% market share in 2025, reflecting the complex integration of wiring harnesses into vehicle design and manufacturing processes. Direct data exchange between supplier CAD and OEM digital twins is making co-development cycles both faster and more secure. Still, it also deepens buyer lock-in, subtly raising switching costs.
The aftermarket grows at a modest but higher pace than OEM demand as global vehicle parc age increases. Independent garages increasingly order pre-terminated repair kits rather than splicing on site, and suppliers see an opportunity for higher-margin small-lot production runs. Because EV accident repair often requires battery isolation before loom replacement, specialised tool kits are being bundled with harnesses, combining product and service revenue.
Geography Analysis
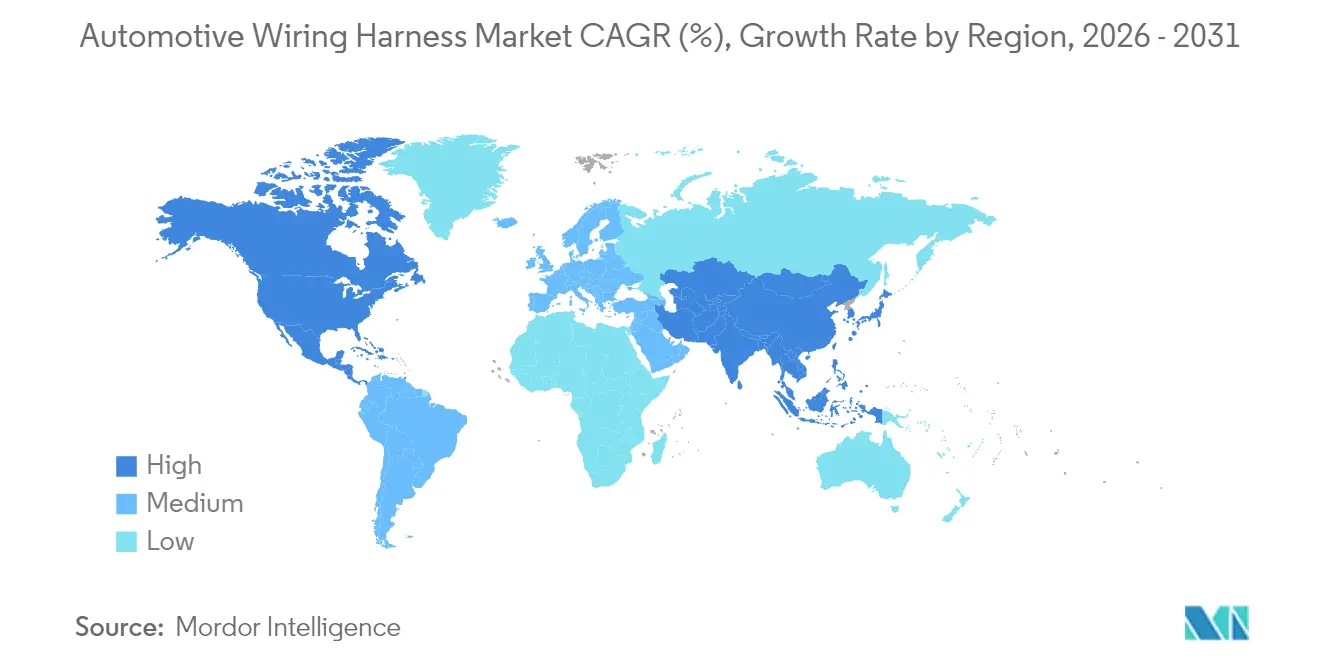
Asia Pacific holds almost 48.40% Automotive Wiring Harness market share and boasts the fastest absolute revenue expansion. China anchors the region through its vast light-vehicle output and deep EV supply chains, while Japan and South Korea contribute high-grade R&D for data and high-voltage applications. Government incentives for electrification in India and Southeast Asia suggest that regional demand will remain resilient even as global growth normalises. A noteworthy development is that multiple Chinese OEMs are exporting EVs to Europe, requiring harmonised wiring specifications that meet European Union regulatory norms and thus elevating Asia-based suppliers to global compliance standards.
Africa, records the highest CAGR of 11.79% between 2026-2031. Competitive labour costs, trade-agreement access to the European Union, and government industrial-park policies together attract fresh harness investment. Several European tier-1 firms are locating high-labour-content sub-assemblies in the region, freeing up home-market plants for automated processes. Local workforce up-skilling programs in cable crimping and quality inspection are emerging, indicating that human-capital strategy is entwined with regional growth.
North America and Europe grow more modestly but remain technology front-runners. Zonal architecture pilots are concentrated in German luxury brands and North American electric start-ups, so design offices in Munich, Stuttgart, and Silicon Valley serve as nerve centres for next-generation loom concepts. This pattern implies that intellectual property creation is decoupling from labour-intensive production. This reinforces the two-speed global footprint in which R&D clusters near OEM headquarters and large-batch assembly migrate to cost-optimised regions.
Mordor Intelligence provides coverage of the automotive wiring harness market across other key regional markets. Detailed country-level analysis extends to India incorporating local coverage and market participation, as required.

Regulatory Landscape
Regulation affecting automotive wiring harnesses is increasingly shaped by electrification safety, cybersecurity, and chemical substance compliance. In the United States, FMVSS requirements under 49 CFR Part 571 include electric-powered vehicle provisions (including FMVSS No. 305a updates published in December 2024) that tighten validation around high-voltage routing, insulation, and post-crash electrical safety. In the European Union, type-approval rules under the motor vehicles and trailers legislative framework are complemented by Delegated Regulation (EU) 2026/699, which raises the compliance bar around secure access to on-board diagnostics and vehicle repair and maintenance information, affecting harness design and connectorization for service interfaces.
Trade and regional compliance regimes also influence sourcing and material choices. A US Presidential Proclamation effective from April 2025 applied a 25% tariff to imports of automobiles and certain automobile parts, which adds direct landed-cost pressure for imported harness content where exclusions do not apply. In the Eurasian Economic Union, the move to EAC RoHS 3.0 compliance for specified heavy-duty wire harness components takes effect on 1 July 2026, requiring updated certification and substance-control documentation for suppliers shipping into EAEU assembly ecosystems.
Value Chain Analysis
The wiring harness value chain spans raw materials (copper and increasingly aluminum conductors, polymers for insulation and overmolding), component specialists (terminals, seals, connector housings, clips, protective coverings), harness integrators and assemblers, and OEM-facing logistics that support JIT/JIS delivery to vehicle plants. Production is typically executed through sequential operations such as cutting and stripping, crimp termination, connector and sub-assembly build, formboard lacing, protective sleeving and marking, and end-of-line electrical testing, with workmanship and acceptance commonly aligned to IPC/WHMA-A-620. Tier-1 suppliers combine design-for-manufacture engineering with labor-intensive assembly, while higher-voltage EV content adds shielding, thermal-management provisions, and more stringent validation.
Bottlenecks in this chain increasingly sit in specialized connectors and variants rather than in wire itself. Long lead times for custom connector families and high part-number proliferation can stall programs even when commodity wire is available. Copper price volatility continues to influence procurement strategy and pricing pass-through discussions, while zonal and software-defined electrical architectures push upstream collaboration on standards, digital data exchange, and automation. OEMs and suppliers are responding through nearshoring and dual-sourcing of critical components, alongside investments in automation to reduce manual touch time and maintain output in higher-cost regions.
Competitive Landscape
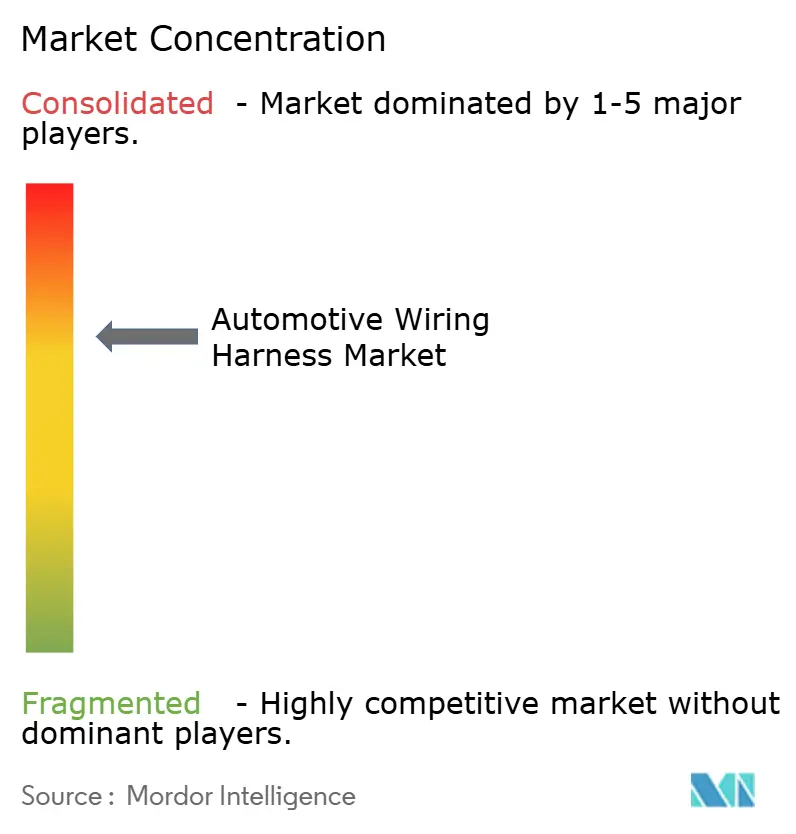
The automotive wiring harnessing industry is concentrated, with the three largest suppliers holding well over half of global revenue. Scale advantages manifest in raw-material procurement, global logistics contracts, and the ability to amortise capital-intensive automated crimping lines. Yet the push toward aluminum and zonal designs opens technical gaps that nimble specialists can address, suggesting that consolidation will coexist with selective niche entry.
Strategic emphasis across leading players centres on three pillars: material substitution, process automation, and digital engineering. Robotic loom-lay-out cells, powered by vision systems, now reduce manual touch time by double digits, improving yield consistency. At the same time, digital twins allow early wiring routing validation against thermal and EMC requirements, shortening development cycles. Suppliers that pair these capabilities with regionalised plants can promise both cost and speed, a combination gaining traction in sourcing scorecards.
Because zonal architectures reduce total wire length, suppliers risk revenue compression if they do not climb the value chain toward high-speed data connectors, active power-distribution modules, and software integration. Some leaders are therefore acquiring or partnering with connector specialists and software firms to broaden the scope. The inference is that competitive rivalry now pivots on system-integration breadth rather than on traditional cable manufacturing prowess alone.
Automotive Wiring Harness Industry Leaders
-
Sumitomo Corporation
-
Lear Corporation
-
Aptiv Plc
-
Yazaki Corporation
-
Leoni AG
- *Disclaimer: Major Players sorted in no particular order

Market Opportunities and Future Outlook
Electrification and the shift toward new E/E architectures are widening whitespace for suppliers that can deliver high-voltage capability, advanced connector systems, and automated manufacturing at scale. Yazaki's April 2026 announcement of a USD 66 million expansion in Nuevo Leon, Mexico, targets engineering and manufacturing capacity tied to vehicle electrification. Aptiv's Wuhan site in China, with the main structure topped out in January 2026, is positioned around high-voltage wire harnesses and EV charging components, reflecting how localized capacity and specialized EV content are becoming embedded in sourcing decisions.
A second opportunity track is tied to regional capacity build-out and localization linked to cost and trade considerations. Leoni began construction in July 2026 of a 35,000 sq m manufacturing facility in Bouskoura, Morocco, reinforcing Africa's role as a hub for labor-intensive harness assembly serving global platforms. On the technology and execution side, standardization and digital continuity from design to production are gaining importance as OEMs pursue zonal architectures that reduce total wire length but raise performance requirements per remaining line. That combination elevates demand for suppliers that can integrate DFM, robust testing, and automated assembly to manage complexity across mixed-material (copper-aluminum) and high-voltage systems.
Recent Industry Developments
- July 2026: Leoni commenced construction of a 35,000 sq m manufacturing facility in Bouskoura, Morocco, to expand capacity for automotive wiring systems. The project strengthens nearshore supply options for Europe while leveraging Morocco's established harness manufacturing ecosystem. It underlines the ongoing shift of labor-intensive harness assembly into competitive-cost regions.
- April 2026: Yazaki announced a USD 66 million investment in Santa Catarina, Nuevo Leon, Mexico, to expand engineering and manufacturing capabilities supporting vehicle electrification. The expansion signals continued localization of harness and related electrical content in North America-aligned supply chains. It also positions the company closer to OEM assembly footprints that require JIT/JIS delivery for complex looms.
- September 2024: LEONI announced progress on a high-voltage harness program for commercial vehicles, including completion of qualification tests and readiness for scale-up. The achievement underscores a move toward integrated thermal management solutions for heavy-duty EV platforms. This development reflects LEONI's push to bridge design and production stages for future-ready harness systems.


Research Methodology Framework and Report Scope
Market Definition and Coverage
For this study, the automotive wiring harness market is defined as revenue from ready-to-install wiring harness assemblies used to distribute power and signals inside vehicles. This includes bundled wires, terminals, connectors, clamps, and protective coverings for both low-voltage and high-voltage systems.
Scope exclusions: We exclude sales of discrete loose connectors or non-assembled parts sold independently, so the same hardware is not counted twice in the total.
Segmentation Overview
-
By Application
- Ignition System
- Charging & Power Supply System
- Drivetrain & Powertrain (ICE)
- High-Voltage Traction Harness (xEV)
- Infotainment, Cockpit & Telematics
- ADAS & Safety Control
- Body, Lighting & Cabin Comfort
-
By Conductor Material
- Copper
- Aluminum
-
By Voltage Rating
- Low-Voltage (<60 V)
- High-Voltage (60-1,000 V)
-
By Propulsion Type
- Internal Combustion Engine Vehicles
- Battery Electric Vehicles
- Plug-in Hybrid & Hybrid Vehicles
-
By Vehicle Type
- Passenger Cars
- Light Commercial Vehicles
- Heavy-duty Trucks & Buses
-
By Sales Channel
- OEM
- Aftermarket
-
By Geography
-
North America
- United States
- Canada
- Rest of North America
-
Europe
- Germany
- United Kingdom
- France
- Spain
- Russia
- Rest of Europe
-
Asia Pacific
- China
- Japan
- India
- South Korea
- Rest of Asia Pacific
-
Middle East
- GCC
- Turkey
- Rest of Middle East
-
Africa
- South Africa
- Egypt
- Rest of Africa
-
South America
- Brazil
- Argentina
- Rest of South America
-
North America
Data Sources, Market Sizing, and Validation
Desk Research
Desk research was used to anchor the market model to observable vehicle production and trade signals, then to sanity check the demand direction by region and vehicle mix. We relied on public datasets and technical context from sources such as OICA vehicle production releases, national transport and energy agencies that track electrification trends, UN Comtrade customs statistics for wires and cables, and ISO and SAE publications that clarify wiring and connector standards and typical system requirements.
To further firm up assumptions, we reviewed company filings, annual reports, investor presentations, and reputable press coverage on platform launches, localization, and capacity additions. A paid subscription for company financials and intelligence was used selectively to normalize segment disclosures and avoid mixing non-automotive wiring revenues into the total. These sources are illustrative, and many other public references were also used for data collection, validation, and clarification during the work.
Primary Interviews and Surveys
Primary calls and short surveys were used to validate what a typical harness bill of materials looks like by vehicle type, and how pricing shifts with copper and resin movements, content per vehicle, and regional sourcing. We also tested our assumptions with stakeholders across harness manufacturing, connector and terminal supply, and vehicle OEM procurement. Coverage was balanced across APAC, EMEA, and the Americas so regional mix did not get overstated.
Distribution of primary research fieldwork respondents
| Company type | Respondent position | Region |
|---|---|---|
| Top tier: 32% | CXOs: 22% | APAC: 46% |
| Mid tier: 46% | Functional/Unit leaders: 38% | EMEA: 35% |
| Smaller Players: 22% | Managers: 40% | Americas: 19% |
Market-Sizing & Forecasting
Sizing started with a top-down demand reconstruction that ties wiring harness consumption to vehicle production by region and powertrain mix. We then adjusted for wiring content per vehicle as electronics density rises. To keep totals practical, we corroborated them with selective bottom-up approximations, such as sampled harness ASP ranges by vehicle class, channel checks on replacement demand, and supplier revenue splits where disclosure quality was usable.
Key inputs used in the model included vehicle production volumes, EV and hybrid penetration, average harness weight and circuit complexity by vehicle category, copper price direction as a cost pass-through indicator, and regional manufacturing footprints that influence local sourcing and pricing. Where primary feedback showed a wide spread in harness value for similar vehicles, we used conservative mid-points and widened ranges only when the vehicle mix supported it.
Forecasting was done using scenario analysis supported by a light multivariate regression view. In this setup, production outlook and electrification rates drive volume, while material cost and content-per-vehicle drive pricing. Assumption gaps were handled through proxy indicators, such as applying platform-level electrical architecture shifts across similar models, and then re-testing the outputs with interview feedback before finalizing.
Data Validation & Update Cycle
Model outputs were checked against independent signals, including regional vehicle output trends, electrification adoption paths, and observed component pricing movements. We also reviewed results for year-to-year discontinuities that did not match industry behavior. When variances appeared large, we revisited the underlying drivers and re-contacted experts to confirm whether the change came from scope, pricing, or mix.
Before sign-off, the work went through multi-step internal reviews so assumptions, units, and currency conversions were consistent across countries and time. The report is refreshed annually, and interim updates are made when material events occur, such as step changes in vehicle production, policy-driven EV spikes, or major supply disruptions. Right before delivery, a final pass is completed so clients receive the most current view possible.
Mordor Intelligence's Automotive Wiring Harness Market Size Versus Other Published Estimates
Published market sizes for automotive wiring harnesses can look far apart even when all publishers focus on the same industry, because each publisher sets its own inclusion rules, base year, and price assumptions. Differences also show up when one model leans more on shipment volumes, and another leans more on revenue disclosures that may bundle adjacent electrical parts.
Some estimates roll up a broader electrical distribution scope and may include discrete connector sales or other non-assembled parts when reporting wiring harness totals. In the Mordor Intelligence model, only ready-to-install harness assemblies plus service replacement tied to harnesses are counted, and stand-alone connectors sold separately are kept out to reduce double counting.
Benchmark comparison
| Source | Market Size | Gaps in Research Methodology |
|---|---|---|
| Mordor Intelligence | USD 84.5 B (2026) | |
| Global Consultancy A | USD 50.09 B (2023) | Uses an earlier base year and a slower growth window, and the captured revenue scope can be narrower depending on how harness assemblies versus related electrical components are classified in company reporting. |
| Industry Publisher B | USD 64.82 B (2024) | Often leans on sales and volume-led reporting with manufacturer coverage that may not fully reconcile OEM-first-fit versus replacement service revenues, which can shift totals when regional mix and vehicle class splits differ. |
The spread in the table is mainly explained by year selection and what is treated as a complete harness assembly versus adjacent electrical parts, followed by how price and mix are carried forward. By keeping inputs tied to vehicle production, electrification mix, and realistic ASP bands that can be re-checked through interviews, our estimate stays traceable to clear steps that others can reproduce.


Key Questions Answered in the Report
What is the current Automotive Wiring Harness market size?
Industry estimates put 2026 global revenue at USD 84.5 billion, reflecting robust electronic content growth across vehicles.
How fast will the Automotive Wiring Harness market grow through 2031?
The market is expected to register a 10.18% CAGR, with high-voltage segments expanding well above the average at around 16.98%.
Why are aluminum conductors gaining traction in the Automotive Wiring Harness industry?
Aluminum offers significant weight and cost advantages over copper, and recent advances in joining technology have resolved earlier reliability concerns.
Which region is the fastest-growing for wiring harness production?
Africa shows the highest relative growth because many European OEMs are sourcing labor-intensive sub-assemblies there to meet local-content and cost objectives.
How are regulatory changes affecting Automotive Wiring Harness market share in safety systems?
Updated safety regulations in the United States, Japan and Europe require redundant circuits for ADAS, increasing harness complexity and lifting unit value for safety-specific looms.
Page last updated on:




