
Enterprise AI Market Size and Share
Market Overview
| Study Period | 2020 - 2031 |
|---|---|
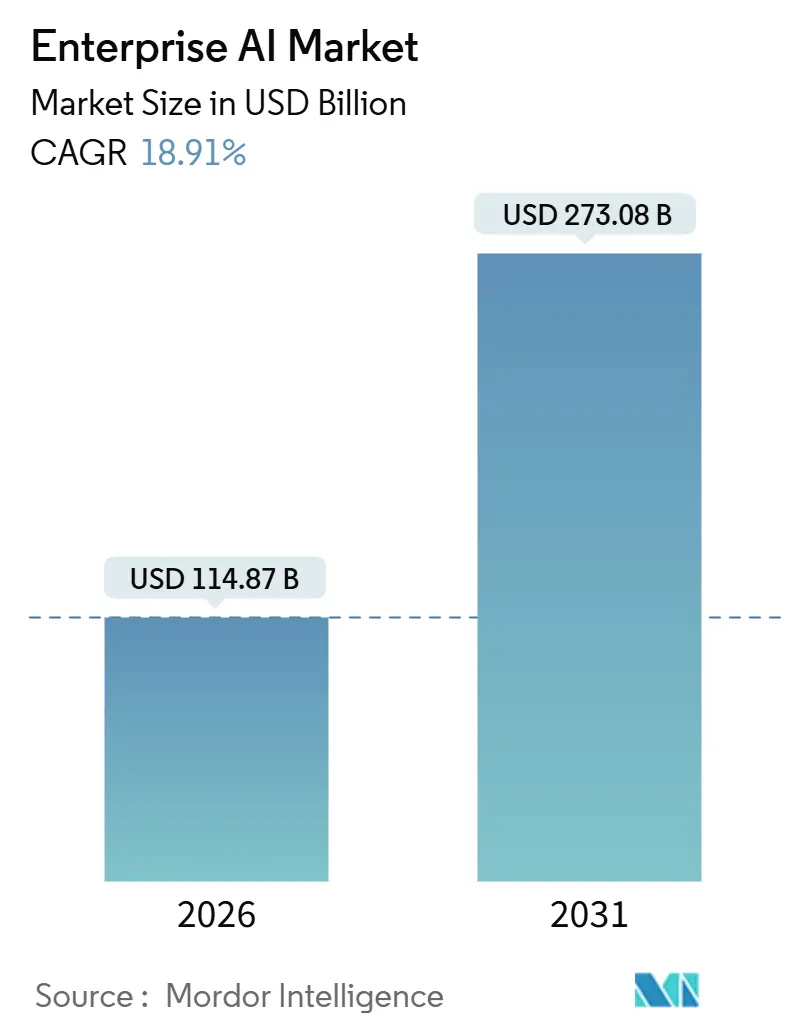
| Market Size (2026) | USD 114.87 Billion |
| Market Size (2031) | USD 273.08 Billion |
| Growth Rate (2026 - 2031) | 18.91 % |
| Fastest Growing Market | Asia Pacific |
| Largest Market | North America |
| Market Concentration | Medium |
Major Players *Disclaimer: Major Players sorted in no particular order Image © Mordor Intelligence. Reuse requires attribution under CC BY 4.0. | |
Enterprise AI Market Analysis by Mordor Intelligence
The Enterprise AI market size stood at USD 114.87 billion in 2026 and is projected to reach USD 273.08 billion by 2031, registering an 18.91% CAGR over 2026-2031. Enterprises are moving past pilots into production deployments, encouraged by specialized computing hardware, cloud-native AI-as-a-Service platforms, and vertical foundation models that lower entry barriers for mid-market firms. Hardware accelerators are expanding faster than the overall Enterprise AI market as organizations provision GPU and TPU clusters to serve large language models at scale. Small and medium enterprises are adopting foundation models via low-code platforms, while demand for AI-driven automation in customer service, software development, and supply chain optimization is accelerating. Compliance-ready vendors are gaining an advantage in the European Union following the provisional application of the AI Act.
Key Report Takeaways
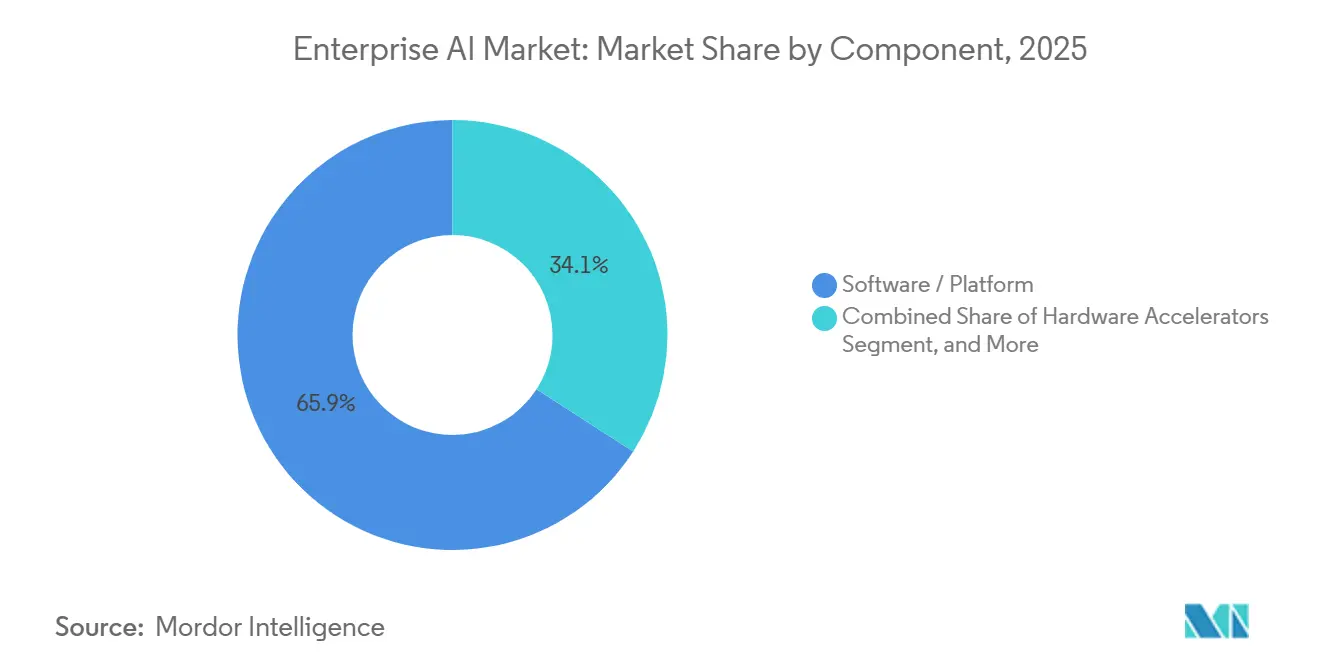
- By component, software and platforms led the Enterprise AI market with 65.89% of revenue in 2025, while hardware accelerators are projected to expand at a 19.39% CAGR through 2031.
- By organization size, large enterprises accounted for 71.43% of the Enterprise AI market share in 2025, while small and medium enterprises are expected to advance at a 19.34% CAGR during 2026-2031.
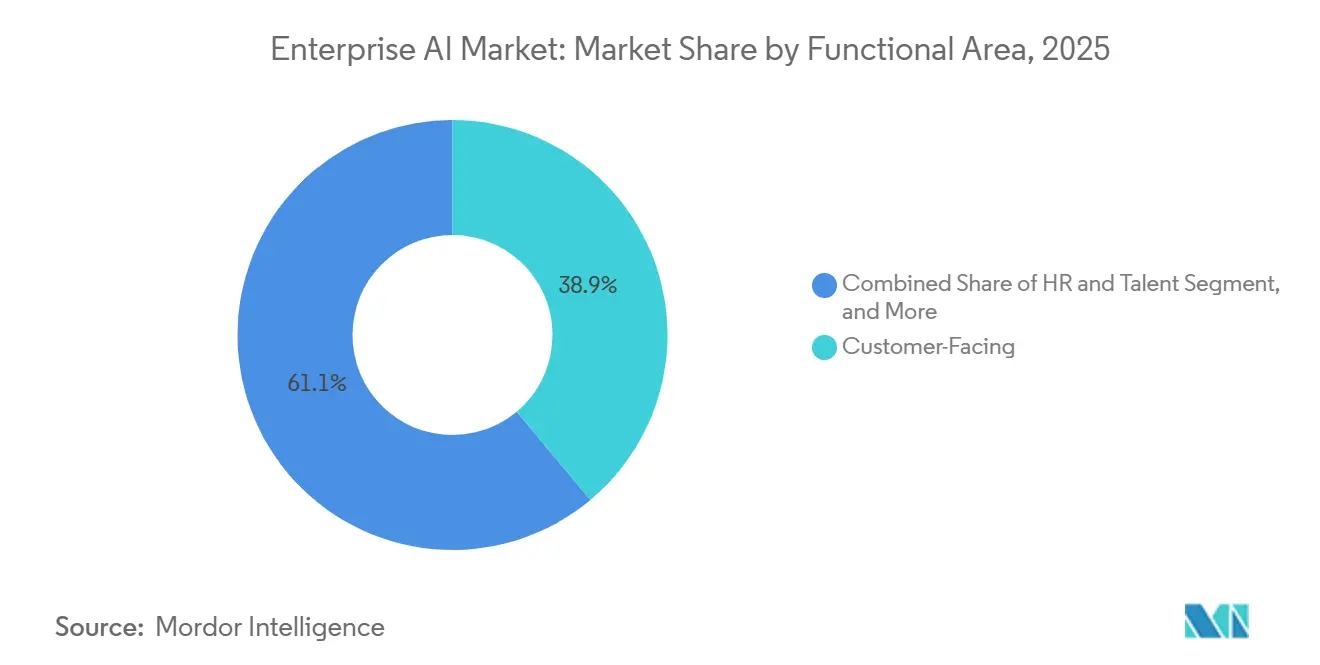
- By functional area, customer-facing applications accounted for 38.91% of 2025 spending, whereas human resources and talent workflows are forecast to grow at a 19.76% CAGR through 2031.
- By technology, machine learning and foundation models captured 49.77% adoption in 2025, while decision intelligence and optimization tools are anticipated to rise at a 19.71% CAGR over the forecast period.
- By end-user industry, banking, financial services, and insurance held 23.67% of the Enterprise AI market share in 2025, while healthcare and life sciences are projected to register a 20.77% CAGR through 2031.
- By deployment model, cloud solutions accounted for 67.33% of 2025 revenue, whereas hybrid and edge configurations are set to grow at a 19.53% CAGR across 2026-2031.
- By geography, North America generated 42.49% of 2025 revenue, while Asia-Pacific is expected to deliver the fastest 19.92% CAGR during the forecast horizon.
Note: Market size and forecast figures in this report are generated using Mordor Intelligence’s proprietary estimation framework, updated with the latest available data and insights as of January 2026.
Market Trends and Insights
Drivers Impact Analysis of Enterprise AI Market*
| Driver | (~) % Impact on CAGR Forecast | Geographic Relevance | Impact Timeline |
|---|---|---|---|
| Surging demand for automation and AI-based solutions | +4.2% | Global, concentrated in North America and Europe | Short term (≤ 2 years) |
| Need to analyze exponentially growing enterprise data sets | +3.8% | Global, notably Asia-Pacific and North America | Medium term (2-4 years) |
| Rise of cloud-based AI-as-a-Service platforms | +3.5% | Global, led by North America, expanding in Asia-Pacific | Short term (≤ 2 years) |
| Advances in specialized computing hardware | +2.9% | North America, Europe, and Asia-Pacific | Medium term (2-4 years) |
| Industry-specific foundation models democratizing AI for SMEs | +2.4% | Global, early traction in North America and Europe | Medium term (2-4 years) |
| Net-zero pledges driving AI-enabled carbon-optimization tools | +1.7% | Europe and North America, expanding to Asia-Pacific | Long term (≥ 4 years) |
| Source: Mordor Intelligence | |||
Surging Demand for Automation and AI-Based Solutions
Enterprises are redeploying labor from repetitive tasks toward strategic workstreams by embedding conversational AI in customer support and code-generation models in software engineering. IBM disclosed that its Watson platform processed more than 1 billion enterprise customer interactions in 2024, a 40% increase from 2023.[1]IBM Corporation, “IBM Annual Report 2024,” ibm.com Labor savings strengthen the business case for GPUs and inference clusters that underpin large language models. Unlike prior rule-based automation waves, foundation models handle unstructured email, audio, and contract text, enabling new workflows such as contract review and clinical documentation. As accuracy improves, leadership teams are authorizing AI to execute decisions rather than simply recommend actions. The focus has shifted from cost reduction to revenue enablement, positioning automation as a board-level growth lever.
Need to Analyze Exponentially Growing Enterprise Data Sets
Global data creation is tracking toward 175 zettabytes in 2025, compelling enterprises to adopt AI systems that classify, extract, and act on petabyte-scale repositories. Retailers rely on real-time demand sensing across thousands of SKUs, while manufacturers detect anomalies from millions of IoT sensor signals. Salesforce reported that its Einstein platform analyzed more than 1 trillion customer data points per week in fiscal 2024, powering predictive lead scoring and churn alerts. Classic business intelligence tools cannot parse such high-dimensional inputs, so machine learning models that scale horizontally are now mission-critical. Organizations that monetize data through predictive insights are better positioned to create new revenue streams and streamline working capital.
Rise of Cloud-Based AI-as-a-Service Platforms
Cloud delivery eliminates the capital outlay for on-premises GPU clusters and provides pay-as-you-go access to continually updated foundation models. Microsoft disclosed 50% year-over-year growth for Azure AI services in fiscal 2024 as enterprises embedded generative AI into customer-facing workflows.[2]Microsoft Corporation, “Microsoft Annual Report 2024,” microsoft.com Managed services ensure version control and security patches are handled by the hyperscaler, slashing the total cost of ownership. Continuous retraining on vendor-curated datasets pushes accuracy gains to customers without local engineering effort. The model does introduce switching costs, yet the scalability benefit currently outweighs lock-in concerns for most enterprises. As multi-cloud architectures mature, organizations aim to abstract inference endpoints to hedge vendor risk while retaining cloud economics.
Advances in Specialized Computing Hardware (GPU, TPU, NPU)
General-purpose CPUs cannot meet the parallelism required to train or serve large language models. NVIDIA’s H100 GPU delivered up to 30× the inference throughput of its predecessor in 2024, allowing enterprises to consolidate model serving infrastructure.[3]NVIDIA Corporation, “H100 Tensor Core GPU,” nvidia.com Google’s sixth-generation Trillium TPU achieved 4.7× peak performance over the prior generation, with a roadmap focused on energy efficiency. Enterprises reserve multi-year GPU capacity with cloud providers, while others deploy on-premises clusters to control latency and data residency. AMD’s MI300X has intensified price competition, lowering cost per tera-flop and broadening access to high-end accelerators. Hardware breakthroughs shorten training cycles, enabling quicker iteration on domain-specific models.
Restraints Impact Analysis of Enterprise AI Market*
| Restraint | (~) % Impact on CAGR Forecast | Geographic Relevance | Impact Timeline |
|---|---|---|---|
| Cultural and skills gap slowing enterprise adoption | -2.1% | Global, particularly Europe and Asia-Pacific | Medium term (2-4 years) |
| Data-sovereignty and privacy-regulation hurdles | -1.8% | Europe, Asia-Pacific, spillover to North America | Short term (≤ 2 years) |
| High implementation and infrastructure costs | -1.5% | Global, more pronounced in emerging markets | Short term (≤ 2 years) |
| Complexity in integrating AI with legacy systems | -1.3% | North America and Europe | Medium term (2-4 years) |
| Source: Mordor Intelligence | |||
Cultural and Skills Gap Slowing Enterprise Adoption
Demand for data scientists, MLOps engineers, and AI ethicists continues to exceed supply, inflating salaries and prolonging hiring cycles. Deloitte’s 2024 survey of 2,800 executives revealed that 68% cited talent shortages as the primary barrier to scaling AI. Beyond headcount, cultural resistance persists, as employees remain skeptical of algorithmic recommendations that alter daily workflows. Only one-third of workers reported receiving adequate AI upskilling, highlighting misalignment between executive ambition and workforce readiness. Without comprehensive change-management programs, enterprises risk underutilizing expensive AI infrastructure. Skills scarcity also drives services spending, as firms rely on system integrators to fill capability gaps.
Data-Sovereignty and Privacy-Regulation Hurdles
Regulations such as Europe’s AI Act require transparency and conformity assessments for high-risk applications, adding compliance overhead that slows deployment. The Act entered provisional application in 2024 and imposes strict disclosure rules for credit scoring and biometric surveillance. China’s Personal Information Protection Law mandates domestic data storage and security reviews for cross-border transfers, forcing multinational firms to maintain parallel AI stacks. Penalties under GDPR can reach 4% of global revenue, elevating regulatory risk. Smaller enterprises without dedicated legal teams face disproportionate burdens, widening competitive gaps. Vendors that embed governance tooling and privacy-preserving architectures gain preference in regulated sectors.
*Our forecasts treat driver/restraint impacts as directional, not additive. The impact forecasts reflect baseline growth, mix effects, and variable interactions.
Enterprise AI Market Segment Analysis
By Component:
Platforms Anchor Spending, Hardware SurgesSoftware and platforms accounted for 65.89% of revenue in 2025, as enterprises favored integrated toolchains that abstract away infrastructure complexity. The Enterprise AI market size for software reached USD 75.6 billion in 2025, underpinned by offerings such as Microsoft Azure AI Studio and Google Vertex AI. Hardware accelerators are forecast to post a 19.39% CAGR through 2031, the fastest among components, reflecting the compute intensity of large-scale inference workloads. Hardware’s growth elevates the Enterprise AI market by expanding total addressable compute capacity and lowering latency thresholds for real-time applications.
Capital intensity is illustrated by NVIDIA, whose fiscal 2024 data center revenue rose 217% to USD 47.5 billion, driven by H100 and Blackwell pre-orders. Cloud providers are locking in multi-year supply commitments to guarantee GPU availability, while enterprises in regulated industries are procuring on-premises clusters to retain data control. Services revenue follows infrastructure complexity, as system integrators manage data engineering, model deployment, and continuous monitoring. The interplay between platforms, hardware, and services underscores a virtuous cycle, better silicon enables richer platforms, which in turn generate services demand.



By Organization Size:
SMEs Accelerate as Barriers FallLarge enterprises held 71.43% of 2025 revenue thanks to in-house data science talent and the ability to amortize AI investments across global operations. However, SMEs are projected to outpace the broader Enterprise AI market with a 19.34% CAGR through 2031. Pre-trained foundation models embedded in SaaS applications eliminate the need for bespoke model development, enabling mid-market firms to match enterprise-grade capabilities. Salesforce Einstein and UiPath Automation Cloud illustrate how vendors package AI into low-code interfaces accessible to non-technical teams.
The democratization trend narrows the technology gap between global conglomerates and regional challengers. SMEs leverage pay-as-you-go inference endpoints to avoid upfront capex, while marketplace-based fine-tuning services allow domain-specific customization. Large enterprises still dominate custom model development for proprietary use cases such as algorithmic trading, but growth differentials suggest that AI maturity will converge across organization sizes by the decade’s end.
By Functional Area:
HR and Talent Emerge as High-Growth FrontierCustomer-facing functions led with 38.91% of 2025 deployments, as chatbots, recommendation engines, and sentiment analytics improved customer experience metrics. The Enterprise AI market size tied to HR applications is set to expand rapidly, reflecting a 19.76% CAGR over 2026-2031 as firms automate resume screening, career pathing, and workforce sentiment analysis. Talent-focused AI systems shorten time-to-hire and reduce attrition by unlocking predictive insights from employee data.
Operations and supply-chain workloads remain foundational, incorporating demand forecasting and predictive maintenance to optimize inventory and asset utilization. Finance, risk, and compliance use cases continue to mature through real-time fraud detection and regulatory reporting. The pivot toward HR underscores a broader evolution, enterprises now view internal productivity gains as equally critical as external revenue drivers.
By Technology:
Decision Intelligence Gains MomentumMachine learning and foundation models made up 49.77% of 2025 adoption, reflecting widespread use of supervised learning for classification and large language models for text generation. Decision intelligence tools are forecast to grow at a 19.71% CAGR, combining machine learning with optimization algorithms to recommend and execute actions. The Enterprise AI market share for decision intelligence is projected to rise as enterprises automate high-stakes decisions such as network routing and dynamic pricing.
Natural-language processing extends beyond customer chatbots into contract analysis and knowledge management. Computer vision applications proliferate from manufacturing inspection to healthcare diagnostics. The push toward multimodal models that natively handle text, images, and structured data is reducing the need for separate point solutions, streamlining enterprise procurement processes.
By End-User Industry:
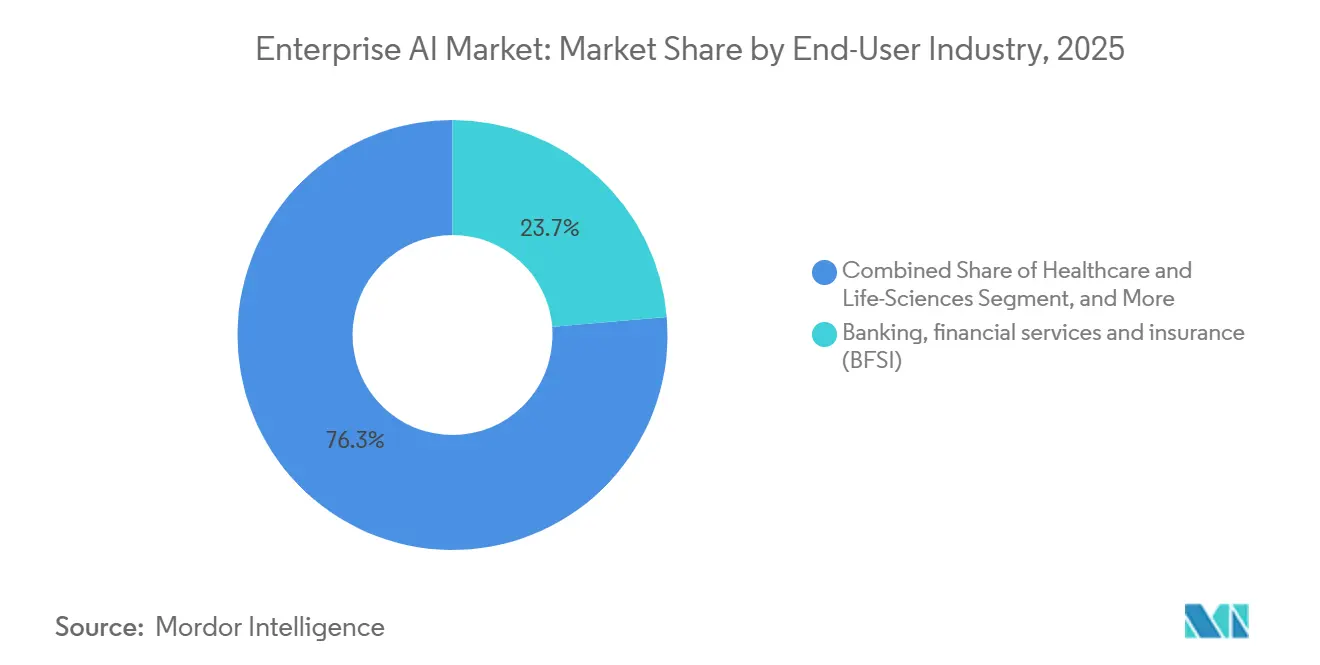
Healthcare Leads GrowthBanking, financial services, and insurance retained a 23.67% revenue share in 2025 through mature fraud detection and customer analytics deployments. Healthcare and life sciences are set to post the fastest CAGR of 20.77%, propelled by expedited regulatory approvals for AI-enabled diagnostics. The U.S. Food and Drug Administration had cleared more than 600 AI-supported medical devices by 2024. Pharmaceutical companies employ AI to identify drug candidates and optimize clinical trial design, compressing development timelines.
Manufacturing leverages predictive maintenance and quality inspection to increase uptime, while automotive firms invest in autonomous systems to differentiate premium models. Energy and utilities rely on AI for grid optimization and carbon tracking, guided by net-zero commitments. Media, telecommunications, and retail continue to refine personalization engines and ad targeting, illustrating AI’s versatility across verticals.
By Deployment Model:
Hybrid and Edge Move Center StageCloud remained dominant, accounting for 67.33% of 2025 revenue, but hybrid and edge deployments are forecast to grow at a 19.53% CAGR as latency and data residency concerns intensify. The Enterprise AI market size attributable to edge inference is climbing as autonomous vehicles, industrial robots, and fraud detection systems demand sub-second response times. NVIDIA Jetson shipments grew 40% in 2024, evidencing rising edge-compute adoption.
On-premises clusters persist in healthcare, finance, and government sectors, subject to strict sovereignty rules. Hybrid architectures blend cloud training with local inference, enabling continuous model updates without compromising data control. Microsoft Azure Stack exemplifies this approach by extending cloud services to customer datacenters.
Geography Analysis
North America Enterprise AI Market
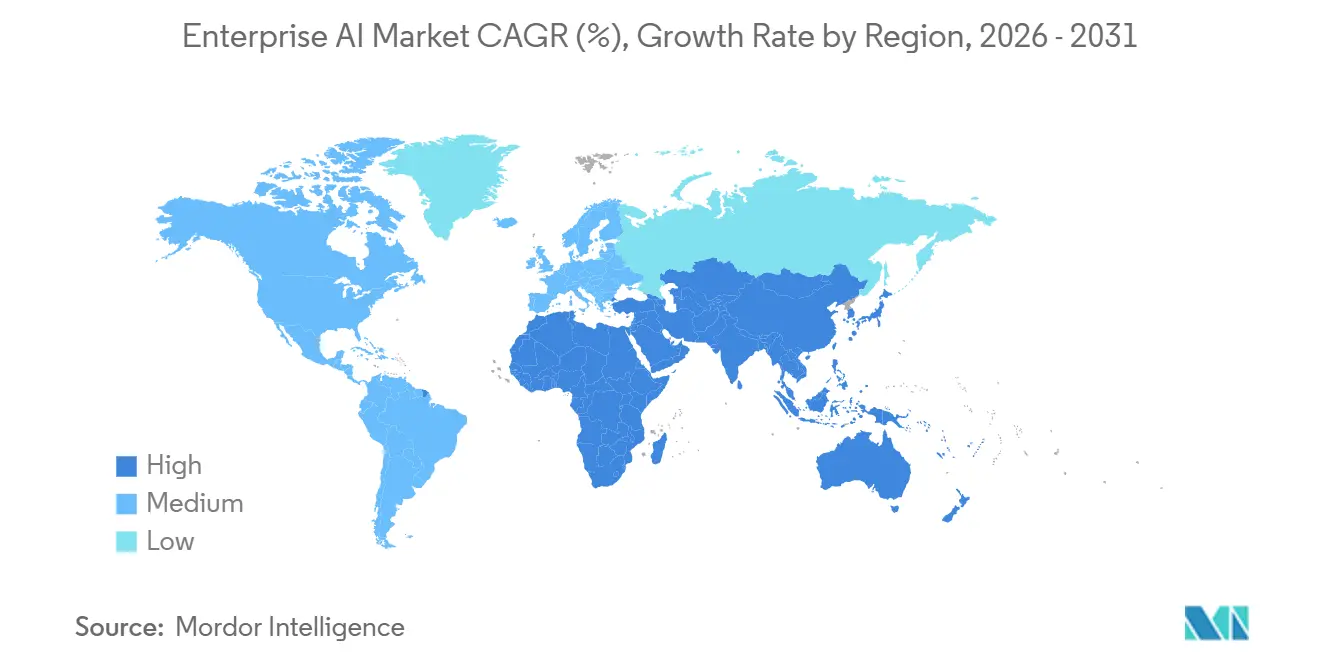
North America accounted for 42.49% of Enterprise AI market revenue in 2025, as hyperscaler data centers, venture funding, and university research concentrated innovation in the United States and Canada. National AI research institutes feed a robust talent pipeline, while a permissive regulatory environment accelerates time-to-production. Canada’s Vector Institute continues to commercialize academic breakthroughs, and Mexico is emerging as a nearshore location for AI-enabled business-process outsourcing. GPU supply constraints and salary inflation are current headwinds.
APAC Enterprise AI Market
Asia-Pacific is projected to deliver the fastest CAGR of 19.92% through 2031, driven by government-backed sovereign AI programs and localized foundation models in China, India, Japan, and South Korea. China’s USD 50 billion national AI plan finances domestic chip fabrication and model development, reducing reliance on foreign suppliers. India’s IndiaAI mission allocates USD 1.2 billion to build indigenous infrastructure and train 500,000 professionals by 2027. Japan subsidizes AI in manufacturing and healthcare, while South Korea pursues leadership in AI semiconductors. Australia exploits AI in mining and financial services, leveraging advanced digital infrastructure.
EMEA and South America Enterprise AI Market
Europe follows a measured trajectory, balancing innovation with strict governance under the AI Act. Germany, France, and the United Kingdom invest in public-private research hubs such as Fraunhofer Institutes and Station F, respectively. The Middle East and Africa are at an earlier stage of adoption but show momentum in smart city and energy optimization projects spearheaded by the United Arab Emirates and Saudi Arabia. South America, led by Brazil and Argentina, applies AI to precision agriculture and fintech. Infrastructure gaps and skills shortages temper growth in emerging regions, yet targeted investments and localization partnerships create openings for specialized vendors.

Regulatory Landscape
Enterprise AI deployments are increasingly shaped by cross-border governance requirements, led by the European Union's Regulation (EU) 2024/1689 (EU AI Act) and its phased implementation calendar. The Act entered provisional application in 2024 and introduces transparency and conformity expectations for high-risk systems, which raises vendor selection criteria around embedded governance, documentation, and controls for regulated enterprise workflows.
In the United States, federal policy signals emphasize national consistency over a state-by-state patchwork. In March 2026, the White House published a National Policy Framework for Artificial Intelligence with legislative recommendations, including preemption of state AI laws, and in June 2026 a presidential executive order on advanced AI innovation and security directed benchmarking for frontier-model cyber capabilities, while explicitly avoiding mandatory federal licensing. For global enterprises, these differences translate into dual operating models: EU compliance engineering for risk classification and transparency, alongside US operational readiness aligned to federal guidance and agency benchmarking expectations.
Value Chain Analysis
The enterprise AI value chain starts with compute and infrastructure suppliers (GPUs/TPUs/NPUs, servers, and cloud capacity), then moves through cloud and platform layers that provide model access, training and inference services, and MLOps tooling. Data engineering and storage (pipelines, vector stores, and knowledge graphs) form the next layer, followed by model development and fine-tuning (foundation and domain models) and orchestration frameworks that enable agentic workflows within applications. System integrators, consulting firms, and independent software vendors then package these capabilities into functional solutions for customer service, software development, HR, finance, and supply chain, with governance tooling (monitoring, security, auditability, and policy controls) increasingly embedded end-to-end as a gating requirement for production deployments.
Recent enterprise activity points to a shift from point solutions toward integrated, domain-specific AI stacks and repeatable delivery patterns. In May to June 2026, supply-chain focused initiatives such as Blue Yonder and NVIDIA's model training factory concept, along with Oracle Fusion Cloud SCM agentic applications, show AI being operationalized inside core enterprise systems rather than as standalone models. Partnerships that connect proprietary operational data with workflow platforms, such as FedEx Dataworks integrations with ServiceNow procurement flows, also underline that differentiated data access and clean, real-time pipelines are central bottlenecks and sources of advantage, while hybrid deployment patterns address latency and data residency constraints.
Competitive Landscape
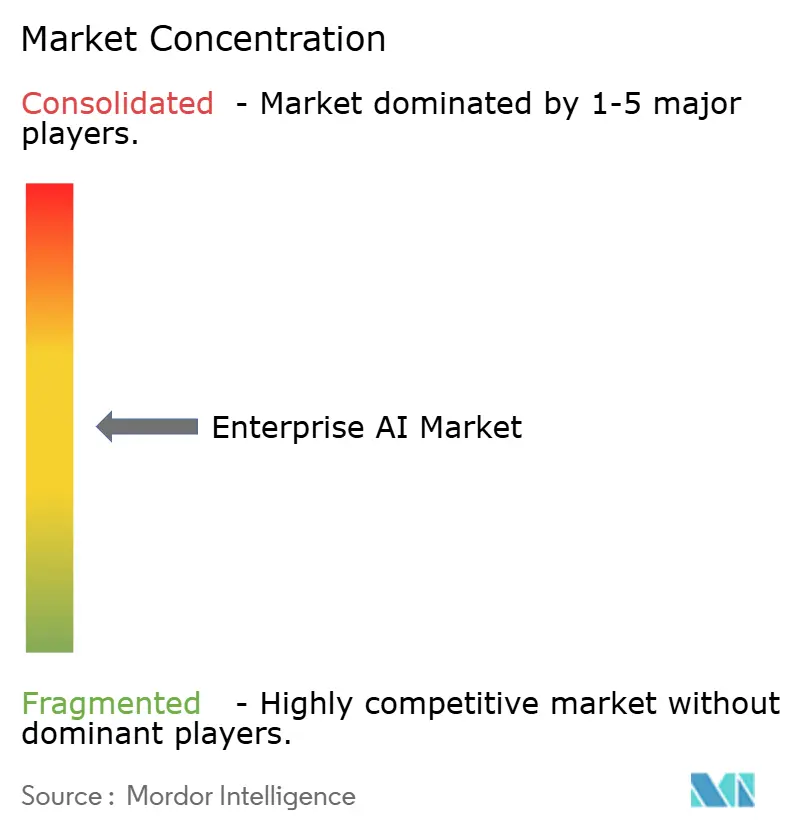
The Enterprise AI market is moderately concentrated. Hyperscalers Microsoft, Google, Amazon, and IBM maintain scale advantages by integrating chips, cloud, and foundation models. Specialized vendors such as C3.ai, DataRobot, and UiPath occupy high-value niches, offering domain-specific accelerators and low-code automation. Competitive intensity is rising as cloud leaders acquire point solutions to extend platform stickiness; Oracle’s 2025 acquisition of Cohere exemplifies this consolidation.
Patent activity signals strategic priorities. NVIDIA filed more than 1,200 AI patents in 2024, focused on GPU architecture, while IBM emphasized hybrid cloud AI and federated learning. Vendors compete on responsible AI features, including bias mitigation, explainability dashboards, and carbon efficiency. Disruptors such as Anthropic and Mistral AI differentiate by optimizing safety, interpretability, or multilingual capabilities. Industry clients increasingly evaluate vendors on governance tooling and energy-to-performance ratios, not just model accuracy. Multimodal offerings that fuse text, image, and video processing within a single stack are emerging as the next battleground.
Investment flows highlight the shift toward infrastructure scale. Microsoft committed USD 3 billion to expand its European AI data centers in December 2025 to address regional data residency requirements. NVIDIA’s Blackwell launch promises 2.5× performance gains for language models, sustaining hardware leadership. Amazon’s Bedrock Custom Models empowers enterprises to fine-tune foundation models while retaining intellectual property. These moves underscore a pattern, platform depth coupled with open customization is becoming the dominant go-to-market formula.
Enterprise AI Industry Leaders
Microsoft Corporation
IBM Corporation
Amazon Web Services Inc.
Google LLC
Oracle Corporation
- *Disclaimer: Major Players sorted in no particular order
Enterprise AI Market Companies Covered in this Report
- Microsoft Corporation
- IBM Corporation
- Amazon Web Services Inc.
- Google LLC
- Oracle Corporation
- Hewlett Packard Enterprise Company
- NVIDIA Corporation
- SAP SE
- Intel Corporation
- Wipro Limited
- NEC Corporation
- Accenture plc
- ServiceNow Inc.
- DataRobot Inc.
- UiPath Inc.
- C3.ai Inc.
- Palantir Technologies
- H2O.ai Inc.
- Snowflake Inc.
- Databricks Inc.

Market Opportunities and Future Outlook
Opportunities are expanding where enterprises can move AI from assisted decision support to execution inside core workflows, particularly through agentic architectures embedded in ERP, ITSM, SCM, and network-operations environments. Evidence of this shift shows up in 2026 rollouts across operationally intensive verticals: Deutsche Telekom expanded from pilot to production usage with OpenAI and reported more than 50,000 internal users for AI embedded in live calls and network management, while Rakuten Symphony deployed a unified Gen AI telecom intelligence ecosystem and reported materially faster root-cause analysis. These moves create whitespace for vendors that can provide production-grade orchestration, observability, and domain templates that plug into existing enterprise systems and data sources.
A second opportunity centers on compliance-ready deployments and resilience requirements that raise demand for governance tooling, data controls, and auditable model operations. The EU AI Act's phased obligations, combined with emerging oversight of major technology providers in regulated sectors, is pushing enterprise buyers toward platforms that package transparency, monitoring, and policy enforcement by default. At the same time, logistics and supply chain operators are demonstrating measurable productivity and operational improvements using AI agents and digital-twin approaches, which supports investment in real-time data fabrics, integration accelerators, and industry ontologies (including new entrants funded to productize these layers). Vendors that can standardize data-to-decision pipelines across hybrid environments, while maintaining governance and performance SLAs, have clear commercialization pathways in high-regulation and high-velocity operations.
Recent Industry Developments in Enterprise AI Market
- July 2026: Microsoft announced The Microsoft Frontier Company, a USD 2.5 billion initiative aimed at embedding AI engineers within enterprise customers to accelerate deployment of agentic AI systems. The announcement formalizes a forward-deployed delivery model that targets implementation bottlenecks such as integration, change management, and production hardening across complex enterprise environments.
- June 2026: Amazon Web Services announced a USD 1 billion forward-deployed engineering initiative to place dedicated teams with customers to co-develop agentic AI solutions. By pairing engineering talent with cloud infrastructure and managed AI services, AWS strengthens enterprise adoption pathways beyond self-serve model access and tooling.
- December 2025: Microsoft announced a USD 3 billion expansion of Azure AI infrastructure across Germany and France to support data residency requirements in the European Union. The investment deepens regional capacity for training and inference while aligning hyperscaler infrastructure planning with evolving governance expectations under the EU AI Act.


Enterprise AI Market Report Scope and Research Methodology
Market Definition and Coverage
For this study, the enterprise AI market covers the spending by organizations on AI software, AI-enabled platforms, and related implementation and support services that help businesses build, deploy, and run AI in day to day workflows.
Scope exclusions: We exclude consumer-only AI apps and devices, and we also exclude one-off custom projects that do not result in a repeatable enterprise AI product or service line.
Segments Covered in This Report
- By Component
- Software / Platform
- Services
- Hardware Accelerators
- By Organization Size
- Large Enterprise
- Small and Medium Enterprises
- By Functional Area
- Customer-Facing
- Operations and Supply-Chain
- Finance and Risk
- HR and Talent
- By Technology
- Machine Learning / Foundation Models
- Natural-Language Processing
- Computer Vision
- Decision Intelligence / Optimisation
- By End-User Industry
- Banking, financial services and insurance (BFSI)
- Manufacturing
- Automotive and Mobility
- IT and Telecom
- Media and Advertising
- Healthcare and Life-Sciences
- Retail and e-Commerce
- Energy and Utilities
- Other End-User Industries
- By Deployment Model
- On-Premise
- Cloud
- Hybrid / Edge
- By Geography
- North America
- United States
- Canada
- Mexico
- Europe
- Germany
- United Kingdom
- France
- Russia
- Rest of Europe
- Asia-Pacific
- China
- Japan
- India
- South Korea
- Australia
- Rest of Asia-Pacific
- Middle East and Africa
- Middle East
- Saudi Arabia
- United Arab Emirates
- Rest of Middle East
- Africa
- South Africa
- Egypt
- Rest of Africa
- Middle East
- South America
- Brazil
- Argentina
- Rest of South America
- North America
Data Sources, Market Sizing, and Validation
Desk Research
To set the foundation, we align on what qualifies as enterprise AI spend and what is counted as adjacent IT spend. Public sources help with that, such as OECD and World Bank digital economy indicators, IT spending and cloud adoption trackers published by agencies, and regulator and standards updates (for example, AI risk and compliance guidance).
We then add supply-side signals and product readiness indicators using sources such as US SEC filings and annual reports, corporate earnings decks, press releases, patent databases for AI-related enterprise software themes, and reputable industry association updates on enterprise software and data center demand. Where needed, a paid subscription for company financials and news intelligence is used to standardize vendor revenue references and reduce gaps caused by different reporting calendars. This list is illustrative only, and many other public sources were also used for data collection, cross-checks, and clarification.
Primary Interviews and Surveys
Primary work is used to test adoption reality and pricing assumptions, because enterprise AI buying is often budgeted across IT, business units, and innovation teams. We speak with enterprise buyers, system integrators, and AI solution and platform providers across key regions so that deployment patterns, average contract values, and ramp-up timelines can be checked before finalizing assumptions.
Distribution of primary research fieldwork respondents
| Company type | Respondent position | Region |
|---|---|---|
| Top tier: 26% | CXOs: 15% | APAC: 43% |
| Mid tier: 58% | Functional/Unit leaders: 25% | EMEA: 35% |
| Smaller Players: 16% | Managers: 60% | Americas: 22% |
Market-Sizing & Forecasting
Sizing is built using a top-down demand pool approach where enterprise software and cloud spending is reconstructed into an AI-addressable share, and then filtered by real deployment penetration discussed by practitioners. To keep the numbers grounded, we also run selective bottom-up approximations using a sampled set of supplier revenues, channel checks, and typical ASP-times-volume logic for common enterprise AI deployments.
Key inputs used in the model include enterprise cloud migration pace, AI workload intensity (training versus inference mix), usage of accelerators in enterprise environments, average contract values for AI platforms and AI-enabled applications, and services attach rates for deployment and governance. When bottom-up coverage is incomplete, gaps are handled by applying adoption and pricing ranges by region and by enterprise size, and those ranges are tightened through follow-up checks.
For forecasting, we rely on scenario analysis supported by trend lines in enterprise IT budgets and cloud consumption, then adjusted using expert views on regulation timing, productivity targets, and deployment bottlenecks like data readiness and talent availability. Growth paths are therefore kept practical, and they remain traceable to a small set of measurable indicators that can be refreshed each year.
Data Validation & Update Cycle
Before final sign-off, we run multiple checks to make sure the output matches independent market signals, not just a single assumption chain. Large year over year jumps are flagged, and we re-review drivers for logic, unit consistency, and currency conversion timing, followed by a second analyst review.
When interview feedback materially disagrees with desk signals, we re-contact respondents or add additional viewpoints from the same buyer group until the variance is understood. The report is refreshed annually, and interim updates are done when there are material events like major regulation changes, abrupt pricing shifts, or a clear change in enterprise adoption behavior. Right before delivery, a final pass is completed so clients receive an updated view rather than an older snapshot.
Mordor Intelligence's Enterprise AI Market Size Compared Against Other Published Estimates
Published enterprise AI market values can look far apart, even when they cover similar use cases, because each publisher draws the boundary differently and uses different demand signals to validate adoption. Differences in what gets counted as enterprise AI versus broader IT, how cloud consumption is treated, and how services are attached to software often create the biggest spread.
Cloud consumption growth signals and enterprise IT budget allocation checks are the evidence used to keep Mordor Intelligence tied to real deployment spend, and that discipline helps avoid counting consumer AI spend or generic IT modernization as enterprise AI. The remaining gaps usually come from how hardware accelerators are treated, whether internal build costs are included, the way ASP erosion is modeled over time, and how often estimates are refreshed after major platform pricing and feature changes.
Benchmark comparison
| Source | Market Size | Gaps in Research Methodology |
|---|---|---|
| Mordor Intelligence | USD 114.87 B (2026) | |
| Global Consultancy A | USD 107.16 B (2025) | Uses an earlier base year and may apply a broader enterprise AI definition across applications, which can shift totals depending on how services and cloud usage are bundled into the same spend pool. |
| Industry Publisher B | USD 31.47 B (2025) | Appears to focus on a narrower enterprise AI revenue lens and may exclude parts of supporting hardware and implementation services, which can materially reduce the counted value for early years. |
The table indicates that most of the difference is not due to math, it is due to what is included, which year is used, and how spend is validated. By anchoring the model to observable enterprise buying signals and then pressure-testing scope assumptions in interviews, we get a balanced estimate that can be repeated and updated with clear steps each cycle.


Key Questions Answered in the Report
What is the forecast revenue for the Enterprise AI market in 2031?
The Enterprise AI market is expected to reach USD 273.08 billion by 2031 at an 18.91% CAGR.
Which component segment is growing the fastest?
Hardware accelerators are projected to rise at a 19.39% CAGR as enterprises scale inference workloads.
Why is Asia-Pacific the fastest-growing region?
Government-funded sovereign AI programs and localized foundation models are driving a 19.92% CAGR in Asia-Pacific.
Which functional area shows the highest growth potential?
Human resources and talent applications are poised to expand at a 19.76% CAGR through 2031.
How are regulations influencing vendor selection in Europe?
The AI Act favors compliance-ready vendors that provide transparency, risk classification, and governance tooling.
What hardware trend is reshaping procurement strategies?
Advances in GPUs and TPUs, such as NVIDIA’s H100 and Blackwell architectures, enable higher inference throughput, prompting multi-year capacity reservations.
Page last updated on:




