
Market Overview
| Study Period | 2021 - 2031 |
|---|---|
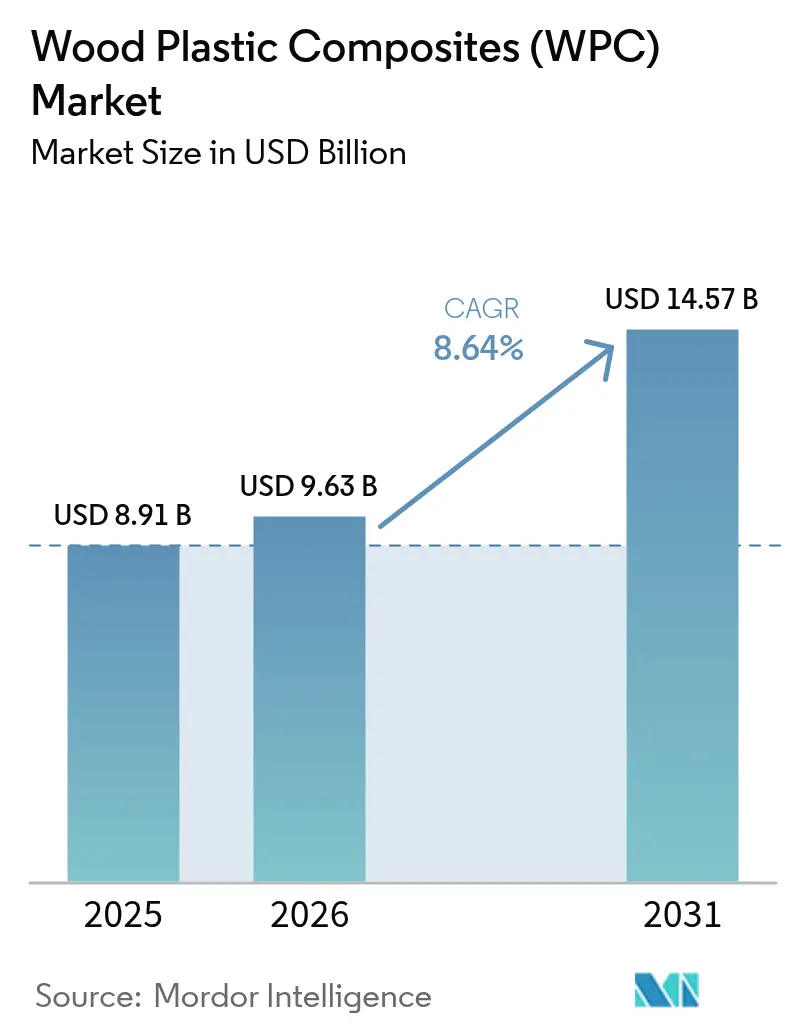
| Market Size (2026) | USD 9.63 Billion |
| Market Size (2031) | USD 14.57 Billion |
| Growth Rate (2026 - 2031) | 8.64% CAGR |
| Fastest Growing Market | Asia Pacific |
| Largest Market | Asia Pacific |
| Market Concentration | Medium |
Major Players *Disclaimer: Major Players sorted in no particular order Image © Mordor Intelligence. Reuse requires attribution under CC BY 4.0. | |
Wood Plastic Composites (WPC) Market Analysis by Mordor Intelligence
The Wood Plastic Composites Market size is projected to expand from USD 8.91 billion in 2025 and USD 9.63 billion in 2026 to USD 14.57 billion by 2031, registering a CAGR of 8.64% between 2026 to 2031. Mandatory wood-fiber-reuse targets in the European Union and China are transforming post-consumer wood from a disposal cost into valuable feedstock, easing raw-material pressure and anchoring demand for composite decking, fencing, and trim. Automotive lightweighting regulations in the European Union, United States, and China are accelerating polypropylene-based formulations, while co-extrusion technology is elevating capped profiles into a premium, maintenance-free option. Polymer-price volatility and fire-resistance certification hurdles remain key challenges, yet steady innovation in flame-retardant additives, glass-bubble fillers, and digital extrusion controls signals an industry pivot from commodity to engineered-material positioning. Competitive intensity stays moderate, with the five largest producers capturing roughly 38% revenue, leaving meaningful whitespace for regionally focused extruders and vertically integrated recyclers.
Key Report Takeaways
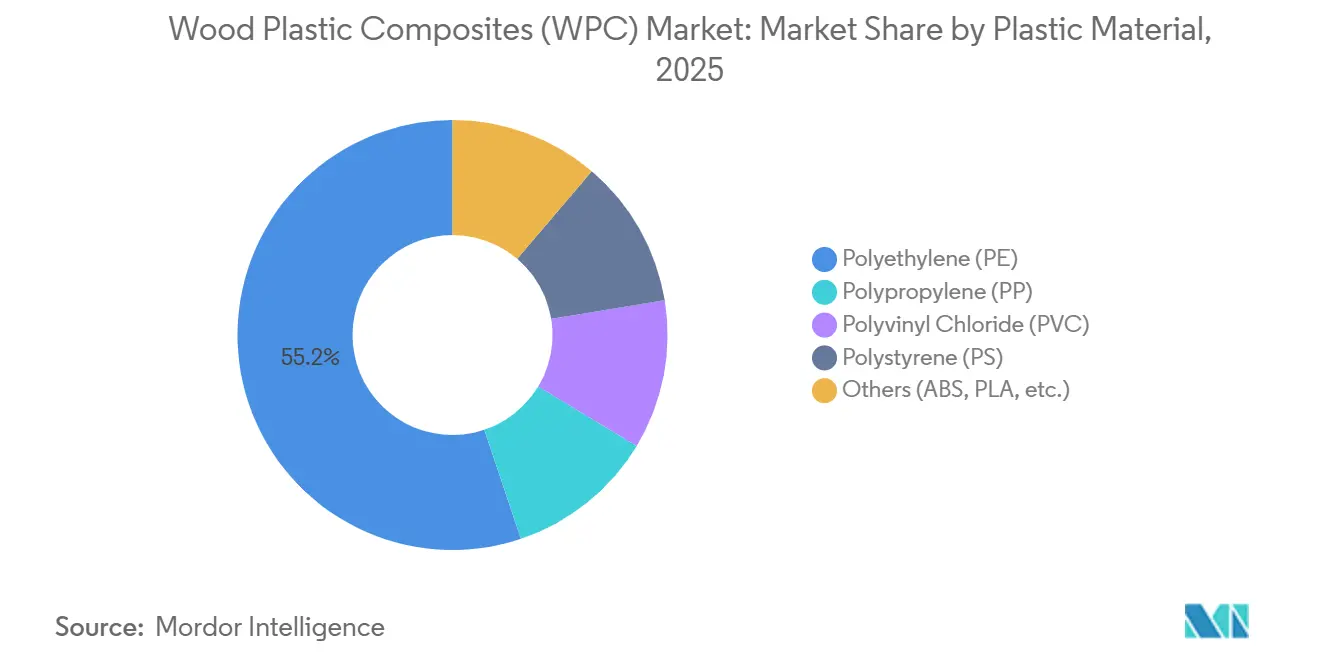
- By plastic material, polyethylene captured 55.16% of the wood plastic composite market share in 2025; polypropylene is projected to expand at a 9.26% CAGR between 2026 and 2031.
- By processing technology, extrusion commanded 70.36% of the wood plastic composite market size in 2025, while injection molding records the fastest projected CAGR at 9.15% through 2031.
- By product form, Uncapped (Conventional) WPC held 65.42% of 2025 revenue, whereas capped profiles will post a 9.56% CAGR to 2031.
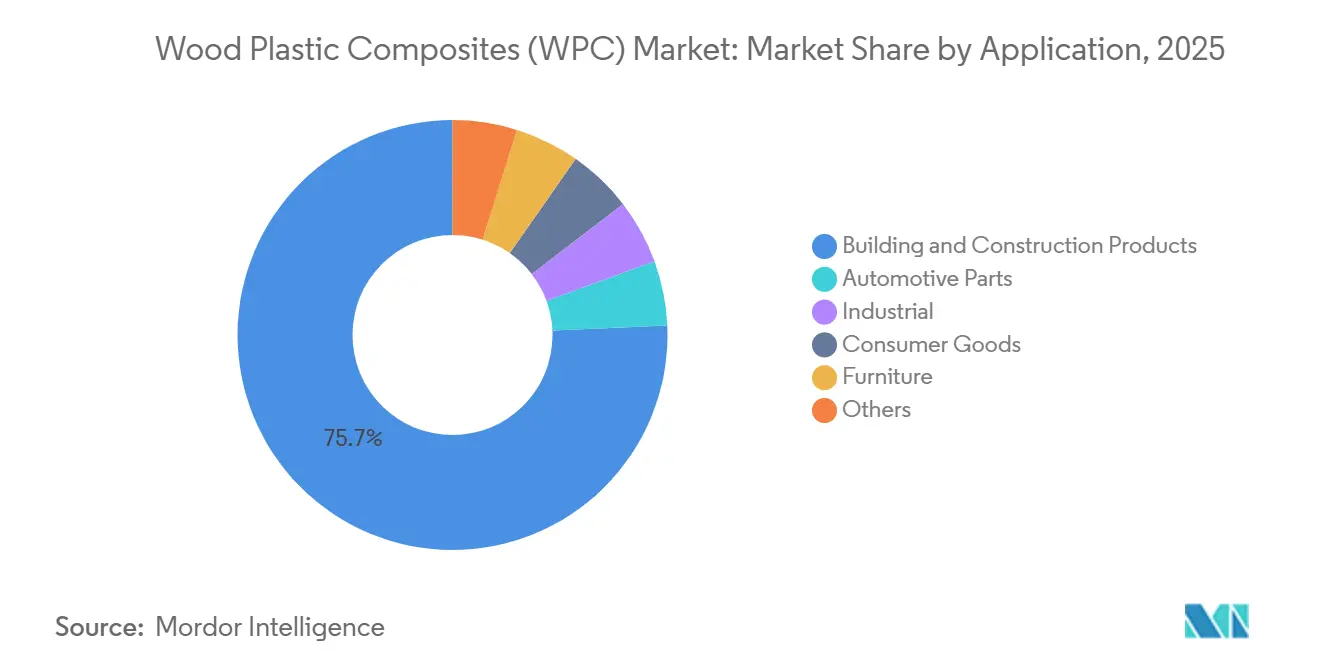
- By application, building and construction accounted for a dominant 75.71% of the wood plastic composite market size in 2025; automotive parts are advancing at a 9.42% CAGR to 2031.
- By geography, the Asia Pacific held 55.38% of the 2025 global revenue and is projected to sustain a 9.52% CAGR, outpacing every other region.
Note: Market size and forecast figures in this report are generated using Mordor Intelligence’s proprietary estimation framework, updated with the latest available data and insights as of 2026.
Global Wood Plastic Composites (WPC) Market Trends and Insights
Drivers Impact Analysis*
| Driver | (~) % Impact on CAGR Forecast | Geographic Relevance | Impact Timeline |
|---|---|---|---|
| Rise in DIY home-improvement & outdoor-living projects | +2.1% | North America, Europe, APAC urban cores | Short term (≤ 2 years) |
| Mandatory wood-fiber-reuse targets | +1.8% | EU core, China, spill-over to ASEAN | Medium term (2-4 years) |
| Shift toward lead-free PVC-based indoor WPC in Asia | +1.5% | China, India, Southeast Asia | Medium term (2-4 years) |
| Lightweighting push for non-structural automotive parts | +1.3% | Global, concentrated in EU & China automotive hubs | Long term (≥ 4 years) |
| Growing demand for low-maintenance urban landscaping products | +1.0% | APAC tier-2/3 cities, Middle East, North America suburbs | Short term (≤ 2 years) |
| Source: Mordor Intelligence | |||
Rise in DIY Home-Improvement & Outdoor-Living Projects
Lock-in effects from pandemic remodeling have persisted, keeping US outdoor-project spending above USD 90 billion in 2026 and lifting composite-decking specification rates among national builders. Big-box retailers have increased the wood plastic composites market shelf space by 30% since 2023, pairing digital design tools with one-day pickup to remove perceived project complexity. Homes marketed with pre-installed composite decks are closing 15% faster than comparable wood-deck listings, underscoring resale-value recognition among buyers. E-commerce penetration sits near 12% today, but direct-to-consumer brands are shortening sample-delivery windows to forty-eight hours, intensifying pressure on dealer-based incumbents. The resulting traffic funnel continues to ratchet up brand loyalty, as customers who complete a first WPC project report a 67% likelihood of specifying composites on subsequent outdoor jobs.
Mandatory Wood-Fiber-Reuse Targets
The European Union Waste Framework Directive revision, effective January 2024, compels member states to recycle 65% of municipal waste by 2035, with a distinct carve-out for wood streams. China’s 14th Five-Year Plan similarly mandates a 60% utilization rate for bulk industrial solid waste by 2025, naming lumber residues as a priority feedstock[1]National Development and Reform Commission, “14th Five-Year Plan for Circular Economy,” ndrc.gov.cn. As municipalities divert demolition timber into material recovery channels, composite extruders are securing multi-year offtake agreements that undercut sawmill demand for virgin flake. Germany’s Hamburg Sanitation Department, for instance, signed a ten-year supply contract with a regional extruder covering 30,000 tonnes annually, swapping previous incineration routes for mechanical recycling. Compliance with the European Union Deforestation Regulation, live since June 2023, further tilts sourcing away from imported hardwood decking toward local composite profiles.
Shift Toward Lead-Free PVC-Based Indoor WPC in Asia
Updated Chinese standard GB 18580-2017 caps lead at 90 ppm in indoor decorative products, catalyzing adoption of calcium-zinc and organotin-stabilized PVC-WPC. Indian standard IS 15871 is on track for a 2026 ratification with comparable limits, propelling capex into new twin-screw lines across Gujarat and Maharashtra. Though lead-free stabilizers add 8-12% material cost, certified PVC-WPC now qualifies for green-building incentives in Singapore’s BCA Green Mark and the UAE’s Estidama Pearl schemes. Guangdong-based plants commissioned since 2024 have raised regional capacity by 200,000 tonnes per year, aiming at interior wall cladding, door frames, and modular furniture exports to Southeast Asia and the Gulf Cooperation Council.
Lightweighting Push for Non-Structural Automotive Parts
The European Union’s post-2025 passenger-car CO₂ limit of 95 g/km imposes a monetary penalty near EUR 95 per exceeded gram, pricing every kilogram shed at roughly EUR 2 in avoided fines[2] European Commission, “Directive 2008/98/EC on Waste,” europa.eu. Injection-molded WPC interior panels deliver 15–20% mass savings against glass-fiber-reinforced PP while maintaining comparable impact strength. Volkswagen Group’s 2025 supplier-scorecard revision allocates bonus points to parts exceeding 25% recycled or bio-based content, automatically elevating qualifying WPC bids. China’s dual-credit scheme for new-energy vehicles magnifies the incentive by awarding lightweighting credits convertible to revenue, accelerating platform-wide material transitions at BYD and Geely.
Restraints Impact Analysis*
| Restraint | (~) % Impact on CAGR Forecast | Geographic Relevance | Impact Timeline |
|---|---|---|---|
| Temperature sensitivity & long-term wear/creep | -1.2% | Global, acute in high-temperature climates (Middle East, Southern U.S.) | Long term (≥ 4 years) |
| Volatility in recycled & virgin polymer prices | -0.9% | Global, most severe in regions dependent on imported resin (EU, India) | Short term (≤ 2 years) |
| Fire-resistance certification hurdles for high-rise construction | -0.7% | Urban centers with high-rise density (Asia-Pacific, Europe, North America) | Medium term (2-4 years) |
| Source: Mordor Intelligence | |||
Temperature Sensitivity & Long-Term Wear/Creep
WPC’s coefficient of thermal expansion is 3–5 times that of lumber, leading to 6 mm board growth over a 3 m span in Riyadh summer highs, which installers must offset with expansion gaps. Long-term creep testing published in the Journal of Materials in Civil Engineering states 15–20% mid-span deflection growth after five years under constant load for uncapped beams. Capped co-extruded profiles moderate surface temperature by 10–15°F and resist moisture ingress but cost 25–35% more, curbing uptake in price-sensitive projects. Glass-bubble fillers are promising mitigations, yet add USD 0.20 per linear foot, pressuring margins against premium hardwoods such as ipe.
Volatility in Recycled & Virgin Polymer Prices
Crude oil-linked polyethylene prices fluctuated by 22% between Q1 2024 and Q4 2025. Recycled HDPE trades at a 15–25% discount to virgin resin but suffers inconsistent melt-flow and contamination, lifting cleaning costs. The EU Carbon Border Adjustment Mechanism adds EUR 50–80 per imported-polymer tonne starting 2026, steering European extruders toward domestic recyclate even as supply remains tight. Bio-based PE from Brazilian sugarcane commands a 20–30% premium but insulates buyers from crude swings, giving vertically integrated producers a hedge over spot-market purchasers.
*Our forecasts treat driver/restraint impacts as directional, not additive. The impact forecasts reflect baseline growth, mix effects, and variable interactions.
Segment Analysis
By Plastic Material: Polypropylene Gains on Automotive Demand
Polyethylene retained 55.16% of 2025 volume, anchoring the wood plastic composites market through economy-grade decking and fencing. Polypropylene, however, is expanding at 9.26% CAGR on surging automotive applications where injection-molded WPC interior trim replaces glass-fiber reinforced PP, delivering 15% weight savings and improved recyclability. Polyvinyl chloride captures indoor wall and furniture niches, leveraging inherent fire resistance to command a 10–15% premium. Polystyrene remains confined to low-stress décor, whereas ABS and PLA occupy a small but fast-growing “others” slice as municipalities pursue compostable or bio-based credentials.
End-users perceive PP-WPC as an easy switch: it runs on existing automotive tooling, passes low-VOC cabin-air requirements in the European Union, and integrates seamlessly into circular supply chains seeking single-polymer stream recovery. HDPE’s supply-chain depth keeps it the first choice for commodity profiles, yet susceptibility to thermal expansion is steering premium lines toward capped co-extruded hybrids. Patent data show 31% of 2025 WPC filings involved co-extrusion die advancements, illustrating a shift from raw-material cost focus to process ingenuity.



By Processing Technology: Injection Molding Scales for Complex Geometries
Extrusion delivered 70.36% of 2025 output by virtue of low-cost, continuous-profile production suited to decking, siding, and fencing. Injection molding is growing at 9.15% CAGR as tier-1 suppliers install multi-cavity tools yielding six door panels per shot, slashing per-part cost to parity with glass-fiber PP. Over-molding fasteners inside WPC parts trims assembly labor by 12–15%, a decisive saving in labor-scarce European plants.
Compression molding and pultrusion remain specialized, servicing structural poles and pedestrian-bridge planking where longitudinal strength premiums outweigh slow cycle times. Capital outlays climb for co-extrusion lines, USD 2–3 million versus USD 1–1.5 million for single-layer extruders, favoring well-capitalized players and gradually consolidating capacity, a trend likely to lift average selling prices from 2027 onward.
By Product Form: Capped Profiles Take Premium Position
Un-capped profiles captured 65.42% of 2025 shipments, anchoring the wood plastic composites market share in price-sensitive residential and municipal projects. Capped co-extruded decking, however, is expanding at a 9.56% CAGR through 2031 as homeowners accept a 20–30% premium in exchange for reduced fading and easier cleaning. Performance tests published by ASTM International show capped boards retain 90% of original color after five years versus 70–75% for uncapped alternatives, making the upgrade an attractive life-cycle investment. Contractors report warranty claims drop by one-third when capped products are specified, easing service-call costs. Municipal buyers still favor uncapped grades for benches and boardwalks because initial outlay, not aesthetics, drives budget decisions.
Hybrid “partially capped” boards that coat only top and side surfaces entered volume production in 2025 and already hold 8% of segment demand, offering a middle ground between cost and durability. Large producers are capitalizing on higher margins: Trex noted that capped lines accounted for 68% of residential-decking revenue in its latest filing, lifting gross margin two points year over year. Smaller Asian extruders are catching up by licensing co-extrusion dies, but equipment costs of USD 2–3 million per line remain a barrier. As cap-layer pigment technology advances, color-matched railings and fascia boards are driving attachment sales, further enlarging the wood plastic composites market size attributable to premium systems.
By Application: Automotive Parts Break Out of Niche
Building and construction absorbed 75.71% of 2025 demand, reflecting entrenched use in decking, fencing, cladding, and trim across North America and Asia-Pacific. Within this umbrella, decking alone represented more than half of the installed volume, underpinned by a remodeling cycle that continues to favor low-maintenance materials. Fencing is the fastest riser in construction, gaining from privacy concerns in suburban housing and perimeter needs for schools and parks. Municipal landscaping products, benches, planters, and pergolas, are surging due to city mandates for water-saving and long-life assets, widening the installed footprint and pushing distributors to carry broader SKUs. Collectively, these uses keep construction central to the wood plastic composites market size at least through 2028.
Automotive parts are the standout growth pocket, projected to climb at a 9.42% CAGR as OEMs chase weight reduction to meet tightening fleet CO₂ limits. Door panels, trunk liners, and package trays molded from polypropylene-based WPC trim 15–20% mass versus glass-fiber PP while hitting low-VOC targets for cabin air, a decisive procurement metric in the European Union. BYD and Geely already deploy WPC interior trim on electric-vehicle platforms, gaining 2–3% range extensions that translate directly into consumer appeal. The segment’s momentum is also attracting aftermarket converters that retrofit conventional models with lighter panels, opening a secondary revenue stream for suppliers. As more tier-1 vendors lock in composite programs, automotive could lift its wood plastic composites market share from today’s mid-single digits to near 10% by the end of the decade.
Geography Analysis
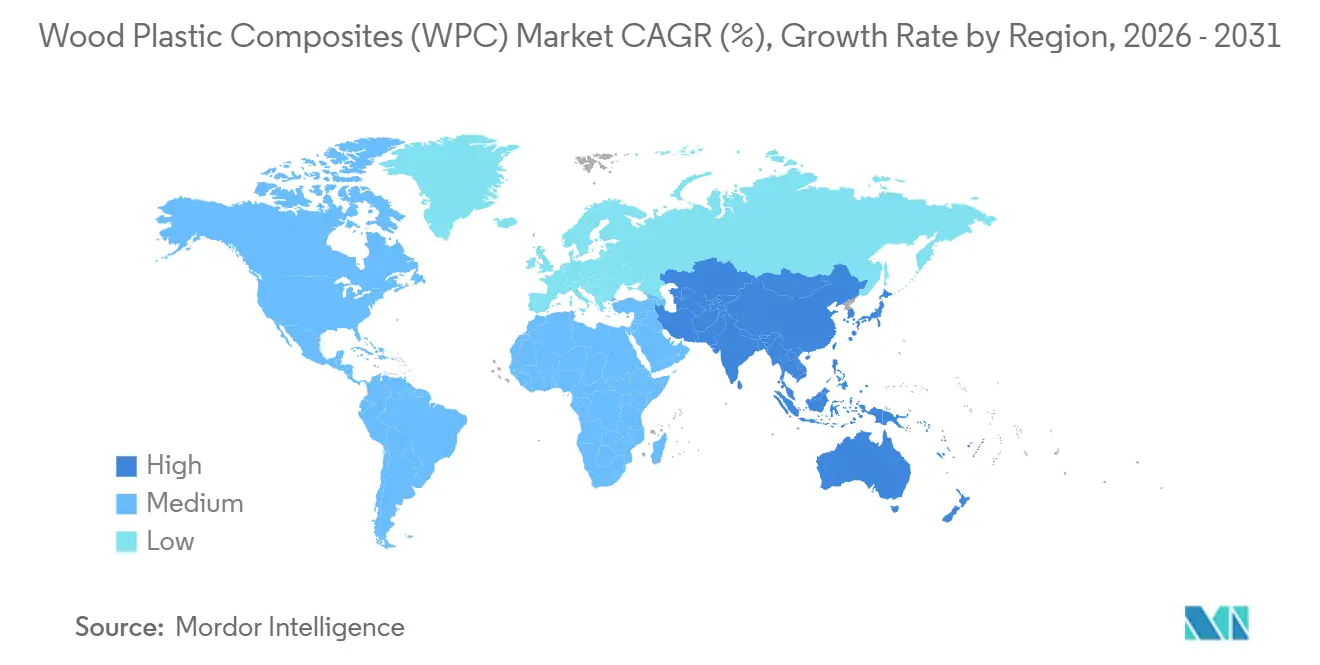
Asia-Pacific produced 55.38% of global revenue in 2025 and is set to compound at 9.52% through 2031, driven by China’s push to a 70% urban population share and India’s state-subsidized housing surge. Municipal bids in Hefei now require WPC park furniture in all new greenfield developments exceeding 3 ha, accelerating capex into capped-profile lines within Zhejiang and Anhui provinces. Southeast Asian markets, Vietnam, Thailand, Indonesia, absorb rising pallet and crate demand linked to export-manufacturing growth and ISPM-15 compliance, boosting industrial-grade WPC shipments.
North America held a significant portion of 2025 sales, owing to a USD 495 billion remodeling pool where outdoor projects remain the single fastest-growing spend category. Builders shifting away from chemically treated lumber favor composite decking for warranty and resale-value optics. Canadian provincial rebates for energy-efficient refurbishments indirectly benefit composite cladding and railing adoption. Mexico’s emergent extrusion corridor near Monterrey supplies US demand under USMCA tariff protections, shortening transit lead times.
Europe’s share trails its population weight but stands to climb as landfill bans on construction waste tighten in Germany, the Netherlands, and the Nordics. The EU’s Carbon Border Adjustment adds cost pressure to imported hardwoods, advantaging locally extruded composites certified under EN 15804 environmental-product declarations. Meanwhile, Middle East and South America exhibit pockets of double-digit growth, Dubai’s WPC park mandates, Brazil’s resort deck refurbishments, and Chile’s earthquake-resilient façade retrofits underscore latent potential once supply-chain hurdles ease.

Value Chain Analysis
The WPC value chain starts with wood fiber inputs (sawmill by-products, demolition wood, and other recovered wood streams) plus thermoplastic resins and additives. Resin choice (HDPE/PE for commodity decking and fencing, PP for injection-molded automotive interiors, and PVC for indoor profiles) shapes formulation and processing; resin often represents 40-60% of manufacturing cost, leaving producers exposed to crude-linked price swings. For recycled plastics, feedstock quality control, cleaning, and compounding are key value-add steps, particularly for capped and co-extruded profiles where surface finish and colorfastness are specification-critical.
Manufacturing is led by extrusion for continuous profiles, with injection molding gaining traction for more complex parts. Co-extrusion requires higher capital investment and tighter process control, which increases the importance of die suppliers, additive formulators (including flame-retardant and UV systems), and digital extrusion controls. Documentation is increasingly treated as a procurement gate, especially in Europe under the EU Deforestation Regulation (in force since June 2023), pushing traceability deeper into fiber sourcing and supplier audits. Some producers have responded by upgrading capacity and documentation, including KR New Materials Co., Ltd. expanding to more than 40 lines in Xuancheng, China (February 2026) while strengthening supply chain documentation for EUDR-related requirements. Downstream, construction products move through builders, contractors, big-box retail, and dealer networks, while automotive applications flow through tier-1 molders and OEM qualification processes. Environmental declarations, including EN 15804-aligned EPDs used in public procurement, are increasingly used to support specification decisions for premium systems.
Competitive Landscape
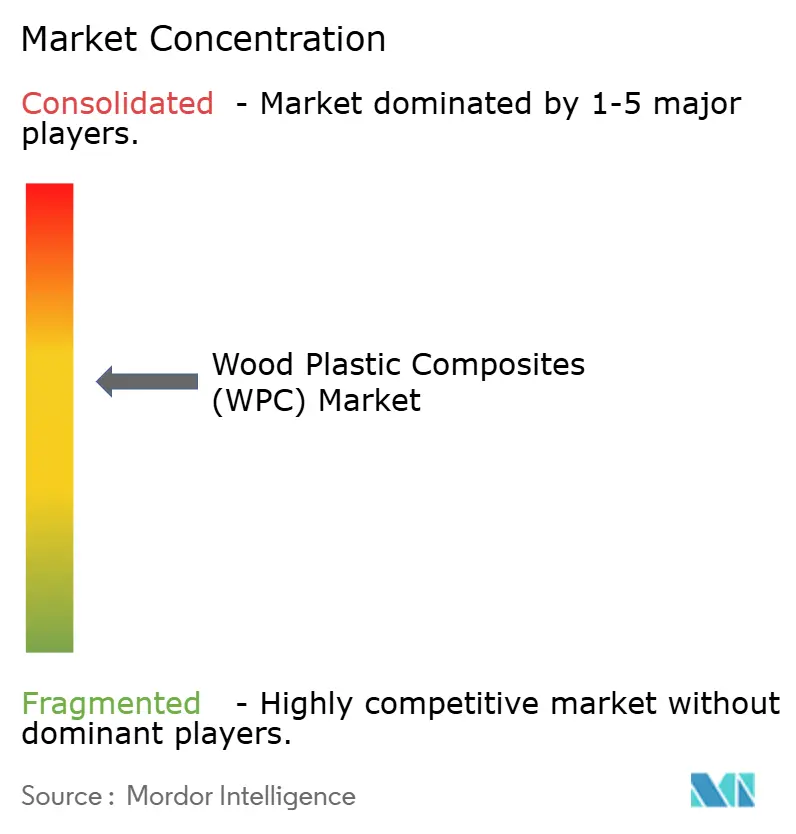
The Wood Plastic Composites (WPC) market exhibits moderate concentration. North American brand leaders wield extensive patent portfolios around co-extrusion and embossing, supporting gross margins near 40%. Scandinavian challenger PolyPlank leans on bio-based PLA to court municipal buyers fulfilling zero-landfill targets, a niche strategy but one enabling contract wins in Stockholm’s 2025 public-park overhaul. Achieving ISO 9001 and ASTM D7032 certification has become table stakes for public procurement, naturally filtering out under-capitalized entrants and nudging the sector toward gradual consolidation.
Wood Plastic Composites (WPC) Industry Leaders
Trex Company Inc.
The AZEK Company Inc.
UFP Industries, Inc.
Fiberon (Fortune Brands Innovations)
Oldcastle APG (CRH)
- *Disclaimer: Major Players sorted in no particular order

Market Opportunities and Future Outlook
Biobased and recycled-content formulations are a practical whitespace, supported by procurement programs that score circularity and by the growing use of environmental documentation in construction tenders. Trex also frames vertical integration into reclaimed feedstocks as a scalable lever (over 95% reclaimed polyethylene film and wood fiber in its sourcing), while China added a formal evaluation pathway for greener WPC through GB/T 35612-2024 (released June 2024, implemented January 2025). These examples raise the commercial value of stable, spec-compliant recycled streams, and they favor producers that can control contamination, maintain melt-flow consistency, and document fiber traceability.
On the product and process side, premiumization and manufacturing modernization create room for differentiated entrants and for incumbents upgrading lines. Deckorators opened a USD 77 million, 253,310-square-foot plant in Lackawanna, New York (June 2026) to expand capacity for its Surestone technology decking, pointing to continued investment in higher-performance platforms. In Asia, KR WPC added an ASA/PVC co-extruded WPC line for outdoor applications (May 2026), aligning with the broader shift toward capped and co-extruded offerings where weathering resistance and aesthetics support higher margins. Separately, digital controls are moving from pilot to production, with Necowood citing digital-twin lines and AI-driven surface defect detection (June 2026), reinforcing an opportunity for equipment, software, and quality systems that reduce scrap and tighten consistency, particularly for capped profiles and automotive-grade PP-WPC where qualification tolerances are tighter.
Recent Industry Developments
- July 2026: Trex Company announced a realignment of its North American distribution network, designating Specialty Building Products (SBP) as its sole national distributor for decking and railing and transitioning away from Boise Cascade. The change concentrates channel execution under a single national partner, simplifying go-to-market coordination across dealers and contractors. It also raises the competitive bar for other brands to match service levels and inventory availability through distribution.
- April 2026: UFP Industries announced the acquisition of Oldcastle APG's MoistureShield decking operating assets to expand manufacturing capacity for its Deckorators composite decking business and add CoolDeck composite decking technology. The transaction adds assets and know-how that increase output capability and broaden performance-led product positioning. It also tightens competitive intensity in capped and specialty decking, where technology differentiation and capacity access influence shelf space and contractor preference.
- July 2025: James Hardie Industries completed its acquisition of The AZEK Company in a cash-and-stock transaction. The combination links AZEK's composite decking and outdoor living portfolio with a larger exterior building materials platform. With scale across products and channels, the merged footprint can influence specification pull-through and support bundled selling in residential construction and remodeling.


Research Methodology Framework and Report Scope
Market Definition and Coverage
In this methodology, the wood plastic composites (WPC) market covers composite lumber and profiles made by blending wood fibers or wood flour with thermoplastic resins, then forming them into finished or semi-finished products for common end uses.
Scope exclusions: Pure wood products, pure plastic profiles, and non-thermoplastic composites that do not use a wood fiber plus thermoplastic blend are excluded.
Segmentation Overview
- By Plastic Material
- Polyethylene (PE)
- Polypropylene (PP)
- Polyvinyl Chloride (PVC)
- Polystyrene (PS)
- Others (ABS, PLA, etc.)
- By Processing Technology
- Extrusion
- Injection Molding
- Compression & Pultrusion
- By Product Form
- Capped (Co-extruded) WPC
- Uncapped (Conventional) WPC
- By Application
- Building & Construction Products
- Decking
- Fencing
- Molding & Trimming
- Landscaping & Outdoor
- Automotive Parts
- Industrial
- Consumer Goods
- Furniture
- Others
- Building & Construction Products
- By Geography
- Asia
- China
- India
- Japan
- South Korea
- ASEAN
- Rest of Asia-Pacific
- North America
- United States
- Canada
- Mexico
- Europe
- Germany
- France
- United Kingdom
- Italy
- Nordics
- Rest of Europe
- South America
- Brazil
- Argentina
- Rest of South America
- Middle East and Africa
- Saudi Arabia
- Turkey
- South Africa
- Nigeria
- Rest of Middle East and Africa
- Asia
Data Sources, Market Sizing, and Validation
Desk Research
Desk research was used to set the base structure of the market model and to anchor assumptions that can be checked consistently year to year. We leaned on public construction and housing indicators, plastics and polymers statistics, and wood products context, then used trade flows for composite profiles to refine regional demand signals.
Typical references included sources such as the US Census Bureau construction and housing series, Eurostat construction output and trade tables, UN Comtrade import and export statistics, the International Energy Agency for macro and industrial indicators, and published standards and technical notes from ASTM International and similar bodies. Company annual reports, investor presentations, and industry press were also reviewed to understand product mix shifts such as capped versus uncapped boards and how recycled content is positioned, and then a paid subscription for company financials and patent databases was used selectively to validate activity and technology direction. The specific sources named here are illustrative, and other public documents were used for data collection, cross-checking, and clarification.
Primary Interviews and Surveys
Primary inputs were gathered from WPC value chain participants such as raw material suppliers, compounders, profile producers, distributors, and large end users in building products and related applications. These interviews were used to test real selling price ranges, typical resin mix by type, channel margins, and how demand tracks renovation cycles across APAC, EMEA, and the Americas.
Distribution of primary research fieldwork respondents
| Company type | Respondent position | Region |
|---|---|---|
| Top tier: 27% | CXOs: 13% | APAC: 46% |
| Mid tier: 55% | Functional/Unit leaders: 29% | EMEA: 35% |
| Smaller Players: 18% | Managers: 58% | Americas: 19% |
Market-Sizing & Forecasting
The sizing starts with a top-down build where construction activity, renovation intensity, and composite profile consumption signals are used to reconstruct a realistic demand pool by region, which is then translated into WPC value using observed price bands. To avoid overstating totals, the output is corroborated using selective bottom-up checks such as sampled producer capacity and utilization discussions, distributor throughput checks, and a simple ASP times volume sanity check on key applications.
Key model inputs included housing starts and repair and remodeling spend direction, decking and exterior cladding adoption cues, resin cost movements (PE, PP, and PVC), wood fiber availability and pricing signals, and trade movement for composite profiles in major import markets. Where a clean volume trail was not available for a country, we bridged gaps using proxy indicators like construction output growth, per capita outdoor living spend direction, and expert-validated adoption ranges, then normalized the result to regional totals.
For forecasting, scenario analysis was used with a base case that reflects expert consensus on construction cycles and material substitution trends, then slopes were adjusted for resin price volatility and expected penetration of capped and co-extruded products. This kept the forecast explainable and repeatable, even when some sub-markets had limited public disclosure.
Data Validation & Update Cycle
Outputs were checked against independent signals such as construction activity direction, trade movement, and supplier commentary on demand strength, then unusual jumps were reviewed before final sign-off. When the model showed sharp changes that could not be explained by resin prices, housing activity, or channel feedback, respondents were re-contacted so assumptions could be corrected.
Each report is refreshed annually, and interim updates are made when material events occur that can move demand or pricing, such as major policy shifts, sustained resin price shocks, or visible construction slowdowns. Before delivery, one final analyst pass is completed so the numbers reflect the most current information available.
Mordor Intelligence's Wood Plastic Composites Wpc Market Size Compared With Other Published Estimates
Published market values for WPC often do not line up because the counted product boundary and the pricing point in the chain differ, and the year used for the snapshot is not always treated the same way. Differences also show up when some sources use more aggressive adoption assumptions for building products, instead of grounding the model in observable construction and trade signals.
Import and export movements for composite profiles, along with construction and renovation indicators, are the checks that keep Mordor Intelligence tied to the same defined demand pool used for the USD 8.91 B (2025) estimate, rather than letting adjacent plastic profiles or broader building materials drift into the total.
Benchmark comparison
| Source | Market Size | Gaps in Research Methodology |
|---|---|---|
| Mordor Intelligence | USD 8.91 B (2025) | |
| Global Consultancy A | USD 8.89 B (2025) | Uses a similar global year anchor, but its outlook assumes a steeper adoption curve into 2033, which can amplify the forward value when ASP progression is not re-tested with channel feedback each cycle. |
| Industry Publisher B | USD 9.76 B (2025) | Starts from a different base-year setup and a higher growth posture through 2034, and it can include a wider mix by type and application without always separating WPC profiles from nearby plastic composite products in end use reporting. |
Across the three figures, the 2025 values cluster tightly, and the spread becomes more visible when forecasting posture, scope boundaries, and price-chain choice change. Our approach stays practical by linking demand to construction and renovation signals, validating price bands through interviews, and then only extending the forecast when the drivers can be explained and rechecked.


Key Questions Answered in the Report
How large will the wood plastic composites market be by 2031?
It is forecast to reach USD 14.57 billion by 2031, expanding at an 8.64% CAGR from 2026.
Which plastic resin is growing fastest inside composite formulations?
Polypropylene is rising at a 9.26% CAGR, propelled by automotive lightweighting mandates.
Are capped profiles really worth the price premium?
Yes, they retain 90% of initial color after five years and cut homeowner maintenance costs, justifying a 20–30% upcharge.
What region leads current demand?
Asia-Pacific accounts for 55.38% of global revenue and continues to outpace other regions.
Who are the leading manufacturers?
Trex Company, The AZEK Company, UFP Industries, PolyPlank Solutions, and Anhui Sentai collectively hold about 38% global share.
Page last updated on:




