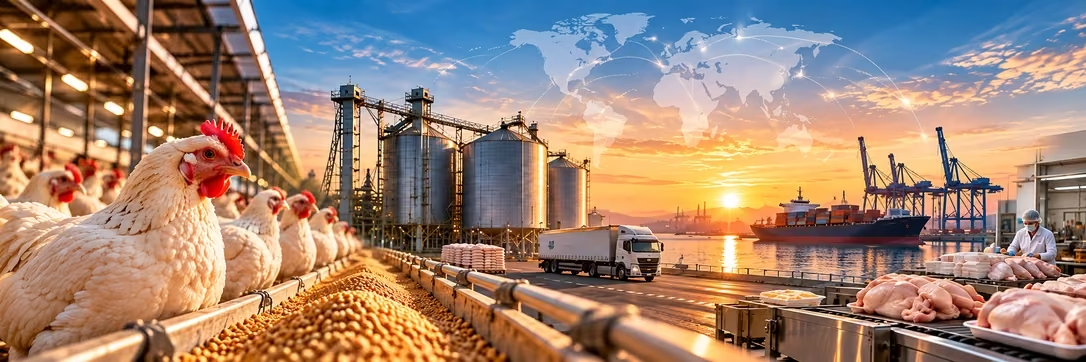
Chicken supply can usually recover quickly after a disruption. In 2026, the pressure is sitting further upstream, where breeder flocks take far longer to replace.
H5N1, falling hatchability, and higher feed and freight costs are making that weakness harder to absorb. For buyers, breeder capacity is becoming a bigger factor in how quickly chicken supply can recover.
Executive Summary
Broiler breeder capacity is becoming the key constraint to watch in the US chicken market. Breeder flocks can take more than a year to rebuild, while current hatchability is already around 75% and could decline further over time. That makes each breeder loss harder to absorb when H5N1 returns.
Other pressures compound the risk. Disruption in the Strait of Hormuz is increasing freight and input costs, while the US cattle herd entered 2026 at its lowest January level since 1951, leaving buyers fewer options to shift demand to beef.
For procurement teams heading into Q4 renewals, breeder availability, hatchability, and feed costs deserve more weight in contract discussions. These are the factors most likely to determine how quickly chicken supply can recover after another disruption.
At a Glance
- 1Six vessels crossed the Strait of Hormuz on August 11, 2026, compared with a pre-war level of roughly 130 to 140 a day. The drop has kept Gulf-linked freight and feed-import costs elevated.
- 2H5N1 has been confirmed in commercial flocks across 12 states during the 2026 wave. US layer depopulations reached 12.4 million birds in the first three months of 2026, compared with 5.4 million during the entire second half of 2025.
- 3US broiler breeder hatchability is around 75% today. A Texas A&M model shows it moving toward 60% by 2050, which would increase the eggs required to produce 9 billion broilers from 12 billion to 15 billion a year.
- 4New World screwworm was confirmed in a Texas calf on June 3, 2026. The US cattle herd is also at 86.2 million head, its smallest since 1951, leaving the wider protein market with less room to absorb another supply shock.
- 5Gulf shipping has become considerably more expensive. War-risk insurance has increased from around 0.25% to between 3% and 10% of vessel value, while Hapag-Lloyd has added a USD 1,500 surcharge for standard containers on Gulf-touching routes, rising to USD 3,500 for special equipment.
Chicken Supply Chain Disruption: Four Shocks, One Shared Bottleneck
Four developments are putting pressure on the chicken supply chain at the same time. Disruption around the Strait of Hormuz is raising freight and input costs, H5N1 is removing birds from production, breeder hatchability has been declining, and tight cattle supply is limiting one of the alternatives buyers normally have when chicken becomes expensive.
The slower part of the problem sits with breeder flocks. Egg-laying and breeder birds accounted for roughly 75% of the nearly 185 million US birds lost to H5N1 since 2022 as of January 2026, with further losses through the spring and summer. A broiler farm can return to production relatively quickly, while rebuilding breeder flocks can take more than a year.
Broiler breeder hatchability is also lower than it used to be. Rates have moved from around 85% in the 1990s to roughly 75% today, which means the industry already needs more eggs to produce the same number of broilers. When H5N1 removes birds from the breeder pool, replacing that future production becomes more difficult.
The cattle market adds pressure from outside poultry. New World screwworm does not affect chicken directly, but its return creates another risk for a cattle industry already working with the smallest US herd since 1951. A slower cattle rebuild leaves restaurants, retailers, and consumers with fewer easy alternatives when chicken prices rise.
Previous poultry disruptions had more relief elsewhere in the system. During the 2022 to 2023 HPAI wave, feed costs were falling. In 2025, broiler production increased 2.1% year over year, while wholesale breast prices fell from USD 2.77 per pound in the middle of the year to USD 1.16 by year end. In 2026, several of those pressures are running at the same time, leaving less spare capacity to absorb another disruption.
Chicken Supply Chain Risk: Price vs. Availability
The risks facing buyers fall into two broad groups. Some show up mainly through price because supply is still available at a higher cost, while others come from capacity that takes months or years to rebuild.
The difference matters when deciding how to respond. Freight and feed costs can move within weeks, making pricing terms and hedging more useful. Breeder flocks and cattle herds take much longer to recover, so buyers may need to look more closely at supplier concentration and available sourcing alternatives.
| Market Group | Track | Lag to Price Impact | Verdict |
|---|---|---|---|
| Consumers | Price | 6 to 8 weeks | Household budgets feel the pressure first, with egg prices likely to move earlier |
| Restaurants & QSR | Price, tipping to availability | Immediate for menus, 6 to 8 weeks for wholesale | Wing- and tender-heavy chains carry the greatest margin exposure |
| Egg Markets | Availability | Already moving | The segment remains the most exposed within poultry after absorbing a large share of H5N1 losses |
| Beef & Pork | Availability | 2 to 3+ years | Tight cattle supply gives buyers less room to shift demand across proteins |
| Small and Mid-size Producers | Availability | 6 to 18 months | Feed-cost pressure and flock losses can put more pressure on smaller operators |
| Import-dependent Countries | Availability | Immediate to 6 months | Supply buffers remain limited in several markets, with the position varying by country |
Chicken Cost Scenarios Through Q4 2026: Hormuz-Related Impacts
The Strait of Hormuz is the fastest-moving part of the current cost picture. Freight, insurance, fuel, and feed-related costs can change relatively quickly if shipping traffic improves, which makes vessel traffic a useful short-term signal for buyers.
The scenarios below isolate Hormuz-related feed, fuel, and freight effects on US wholesale chicken prices. H5N1, breeder capacity, and New World screwworm sit outside the model so the effect of shipping conditions can be viewed separately.Chicken Cost Scenarios Through Q4 2026: Hormuz-Related Impacts
| Scenario | Hormuz Assumption | Modeled Impact on US Wholesale Chicken Price | Cost Impact |
|---|---|---|---|
| Conservative | Traffic stays under 15 vessels a day through Q4 2026 | +6% to +9% vs. pre-closure baseline | Crude remains around USD 88 to 95 a barrel, diesel stays above USD 3.80 a gallon, and the full freight and feed premium continues into Q4 |
| Baseline | Traffic gradually improves toward 30 to 40 vessels a day by Q4 2026 | +3% to +5% vs. pre-closure baseline | Crude eases toward an estimated USD 78 to 85 a barrel, while roughly 45% to 55% of the freight and feed premium is removed |
| Optimistic | A corridor agreement restores traffic above 60 vessels a day by Q4 2026 | +1% to +2% vs. pre-closure baseline | Crude moves toward its pre-war range of around USD 70 to 75 a barrel and most freight premiums ease |
Pricing Supplier Concentration Risk for a Wing-and-Tender QSR Chain
A regional quick-service chain in the southern United States had traditionally renewed its chicken supply contracts on a straightforward 12-month cycle. The procurement team reviewed the previous year's price, adjusted for inflation, and signed the next agreement.
By Q4 2026, that approach was giving the team too little information. Wings, tenders, and sandwiches made chicken central to the menu, while several suppliers were exposed to the same breeder regions, H5N1 control zones, and feed-cost pressures. The team knew supply costs were becoming harder to predict, but it could not see where the biggest concentration sat inside its supplier base.
The analysis mapped the chain's suppliers against breeder-flock capacity by region and compared hatchery locations with active H5N1 control zones. Feed-cost exposure tied to Gulf-linked grain and fertilizer routes was then added to the same supplier map.
Each supplier was placed into one of three exposure tiers based on the share of contracted volume linked to breeder stock located inside or close to an active control zone. The work combined Mordor Intelligence primary research with hatchery operators and breeder-flock managers with publicly available USDA APHIS control-zone data and Gulf freight indices.
The chain received a landed-cost range for each supplier under the three Hormuz scenarios, along with a concentration score showing how much of that supplier's volume came from higher-risk breeder areas.
Across the chain's 220-unit supplier network, the median concentration score was 64 out of 100. Around 64% of contracted chicken volume came from breeders operating within or adjacent to an active H5N1 control zone as of July 2026. The two highest-volume suppliers accounted for roughly 38% of total contracted tonnage, and both scored above 80.
With that view, the procurement team could decide where to act first. Lower-exposure supply could be secured earlier, terms could be revisited with suppliers carrying greater concentration risk, and a wider price range could be kept on the remaining volume until conditions became clearer.
A company can have several chicken suppliers and still carry heavy concentration risk if those suppliers depend on the same breeder regions, hatcheries, or feed routes. That dependency rarely appears in the quoted price or the supplier count.
Bringing breeder geography, H5N1 control zones, and Hormuz-linked freight exposure together gives buyers a clearer view of where several contracts could come under pressure at once. It also gives procurement teams something more useful than a broad market warning because they can see which suppliers need attention before the next renewal.
Strategic Synthesis: Why Chicken Supply Risks Could Outlast the Current Shocks
The pressures affecting chicken are moving on different timelines. Hormuz traffic can improve quickly, bringing some relief to freight, insurance, fuel, and feed costs. Breeder capacity takes much longer to recover because rebuilding a flock can take more than a year.
H5N1 also remains a continuing animal-health risk, while broiler breeder hatchability has been declining over a much longer period. The cattle market has its own timeline, with the herd already at its lowest level since 1951 and any meaningful rebuild taking years.
For buyers, that makes the duration of the pressure as important as the first price increase. Freight costs may begin easing while breeder availability remains tight, and beef may stay expensive even after poultry conditions improve. Q4 sourcing decisions therefore need to account for which risks can clear quickly and which will remain in the system well beyond the current headlines.
Executive Imperatives: Five Chicken Sourcing Actions Before Q4 2026 Renewals
- 1Map supplier exposure to active control zones before Q4 renewal.Twelve states carried confirmed H5N1 detections as of June 2026, and breeder flocks take much longer to rebuild than broiler production. The North America Poultry Meat Market research tracks those differences by region.
- 2Track Hormuz transit counts alongside freight and feed costs.Traffic stood at six vessels a day on August 11, 2026. The Cargo Shipping Market coverage provides additional context on the corridor, while the current scenario model shows how a sustained move toward 30 to 40 vessels a day would reduce a meaningful share of the freight and feed premium.
- 3Include tight beef supply in protein planning.Ground beef has already reached USD 7.12 per pound and the US cattle herd is at its smallest level since 1951. The North America Red Meat Market research tracks the supply position by cut and region, which matters when assessing how much demand can realistically move away from chicken.
- 4Model egg-price exposure separately from broiler prices.Egg-laying flocks have absorbed a large share of cumulative H5N1 losses, and retail egg prices can carry a 6-to-8-week lag after depopulation events. The United States Egg Market research follows that restocking cycle and the resulting price effect.
- 5Include hatchability in multi-year chicken cost assumptions.The Texas A&M path from 75% hatchability toward 60% by 2050 would require roughly 3 billion additional eggs a year to produce the same 9 billion broilers. The United States Poultry Meat Market research provides the broader production context behind that capacity requirement.
The Next Layer of Intelligence: Mapping Chicken Supplier Exposure and Landed Costs
A buyer can be exposed to several of these risks through the same supplier. A processor may depend on breeders near an H5N1 control zone, buy feed affected by higher transport or fertilizer costs, and serve customers that have limited room to move toward beef.
Looking at each issue separately can hide that concentration. Mordor Intelligence's Value & Supply Chain Analysis maps supplier concentration against control-zone data and models landed costs under different Hormuz reopening scenarios. Primary interviews with hatchery and breeder-flock operators add a view of where capacity pressure is building before it reaches contracts, menus, or shelves.
For buyers heading into a possible chicken supply shortage or a more expensive renewal cycle, that gives the sourcing conversation a clearer starting point. It shows which supply needs to be secured first, where contract terms deserve another look, and where more flexibility may be needed.
Related Insights
Edible Oils in Crisis: How Global Conflicts Are Reshaping India's Supply Chain
GST Reforms 2025: India's Agriculture-Food Sector Reset
Summer's Triple Threat: A Stress Test for Pharma Supply Resilience