
Market Overview
| Study Period | 2021 - 2031 |
|---|---|
| Forecast Data Period | 2026 - 2031 |
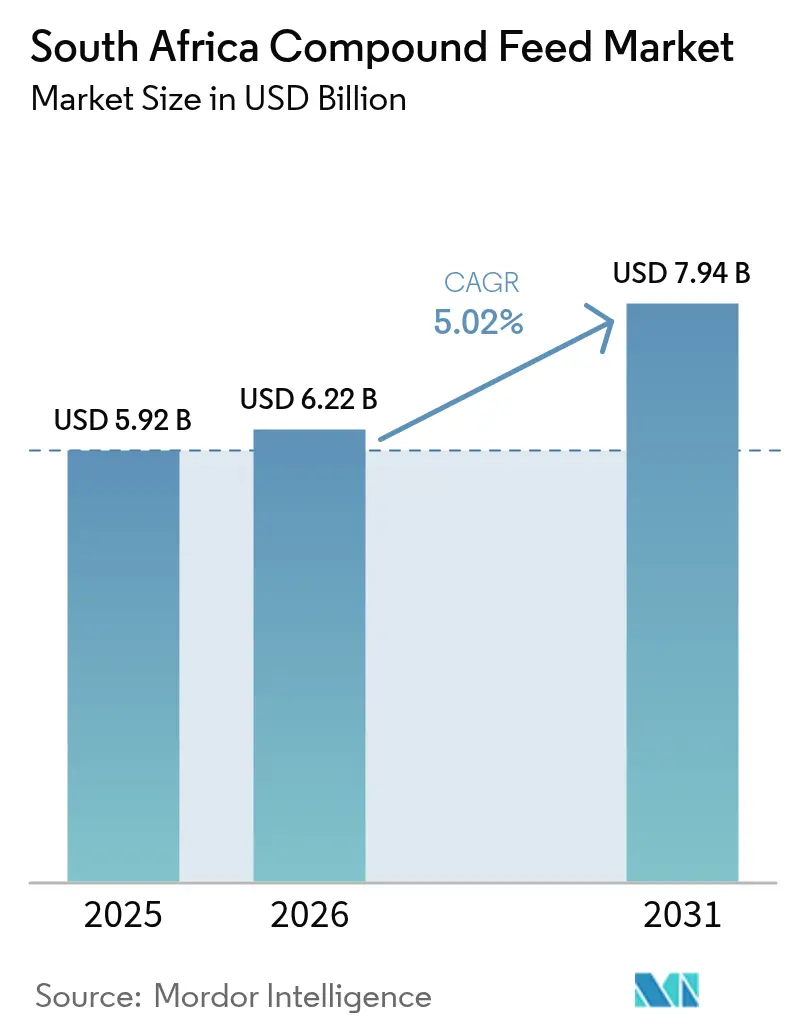
| Base Year Market Size (2025) | USD 5.92 Billion |
| Market Size (2026) | USD 6.22 Billion |
| Market Size (2031) | USD 7.94 Billion |
| Growth Rate (2026 - 2031) | 5.02% CAGR |
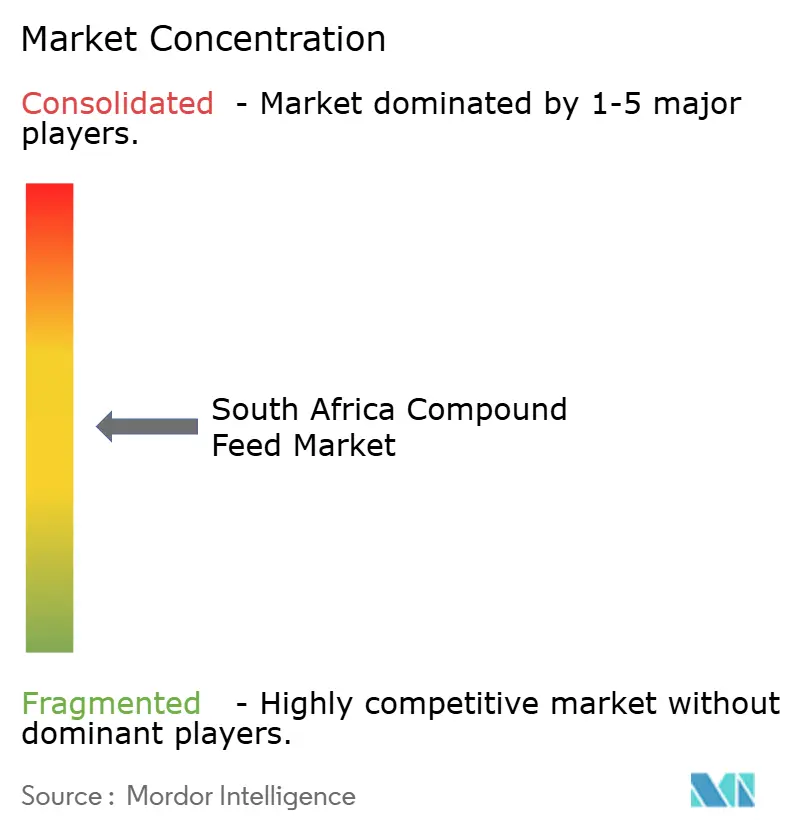
| Market Concentration | Medium |
Major Players *Disclaimer: Major Players sorted in no particular order Image © Mordor Intelligence. Reuse requires attribution under CC BY 4.0. | |
South Africa Compound Feed Market Analysis by Mordor Intelligence
The South Africa compound feed market size was valued at USD 5.92 billion in 2025 and estimated to grow from USD 6.22 billion in 2026 to reach USD 7.94 billion by 2031, at a CAGR of 5.02% during the forecast period (2026-2031). Steady poultry restocking after the outbreak of highly pathogenic avian influenza, rising aquaculture licensing under Operation Phakisa, and the rapid uptake of enzyme-based supplements are lifting overall demand, even as frequent grid disruptions pressure milling costs. Integrated poultry groups insulate themselves from Transnet rail delays by running captive mills, while independents rely on least-cost formulation software and solar arrays to stay competitive. Biosecurity mandates that require feed traceability are expanding the premium segment, and elevated maize volatility is accelerating ingredient diversification toward sunflower meal and imported soybean meal. Collectively, these shifts indicate a market where power resilience, precision nutrition, and regulatory compliance surpass sheer production scale as key differentiators.
Key Report Takeaways
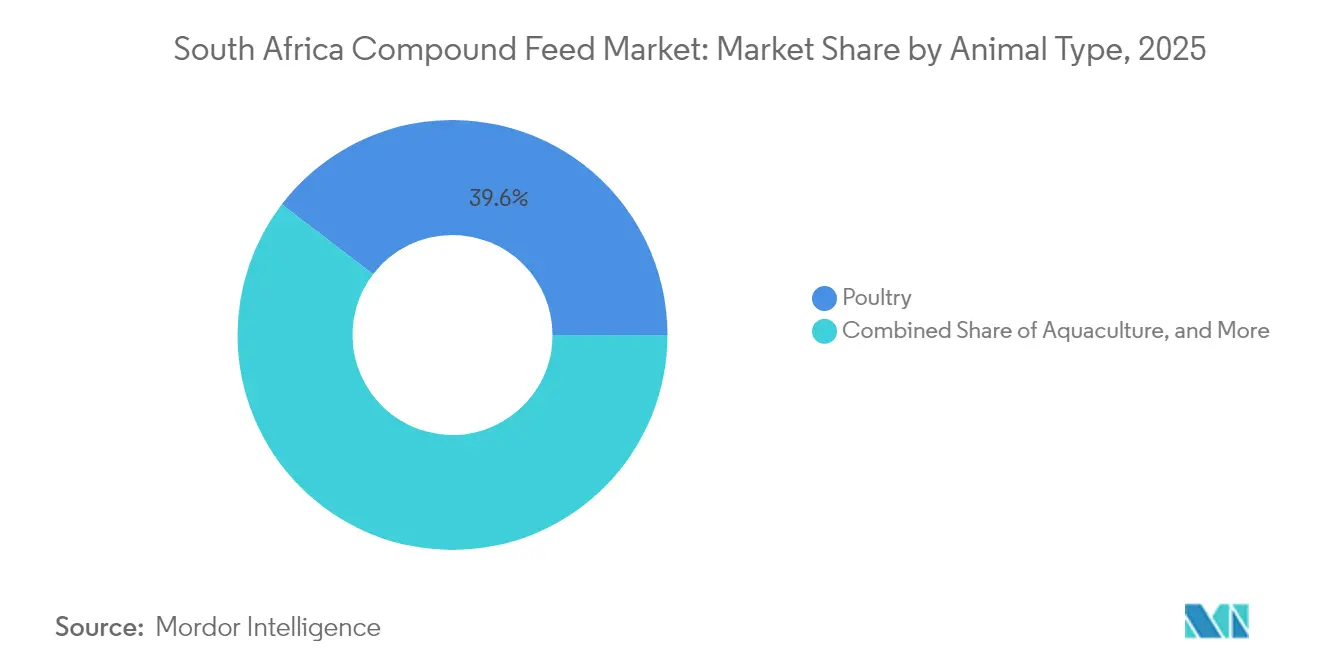
- By animal type, poultry commanded 39.60% of South Africa compound feed market share in 2025, while aquaculture is projected to grow fastest at 7.22% through 2031.
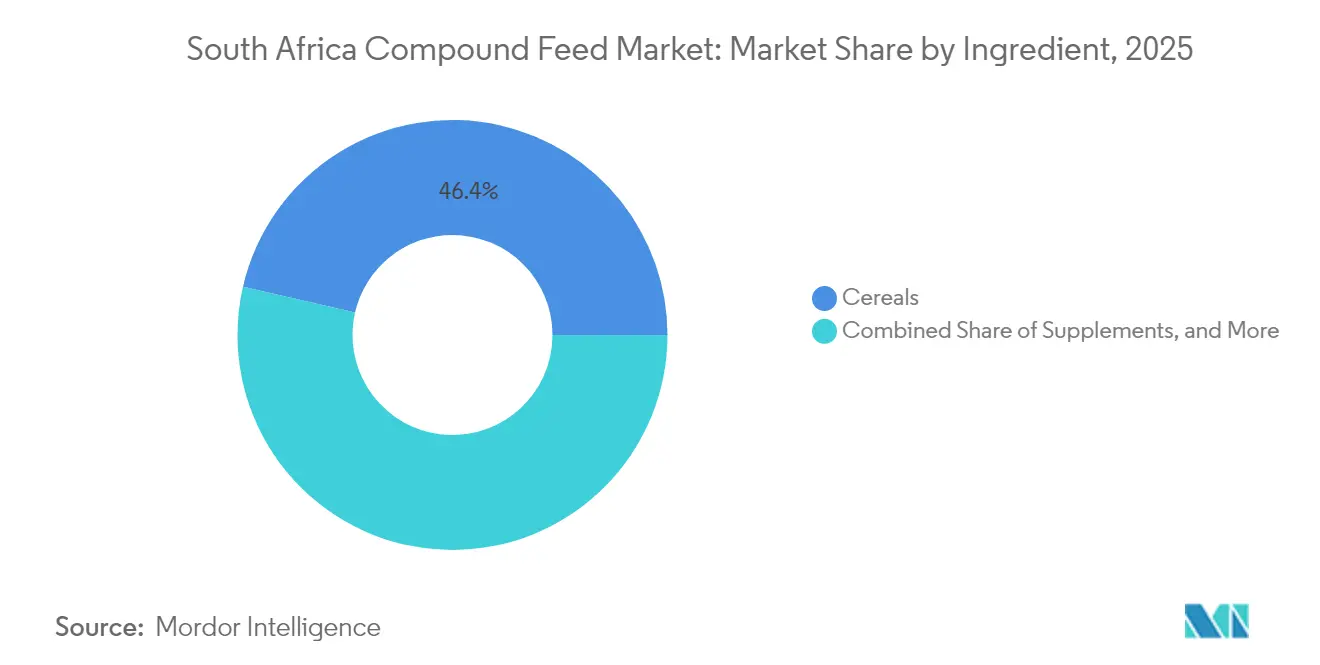
- By ingredient, cereals contributed 46.40% of the South Africa compound feed market size in 2025, and supplements are projected to register the highest CAGR at 6.55% between 2026 and 2031.
Note: Market size and forecast figures in this report are generated using Mordor Intelligence’s proprietary estimation framework, updated with the latest available data and insights as of 2026.
South Africa Compound Feed Market Trends and Insights
Drivers Impact Analysis*
| Driver | (~) % Impact on CAGR Forecast | Geographic Relevance | Impact Timeline |
|---|---|---|---|
| Increasing demand for poultry products | +1.2% | National, with concentration in Western Cape, Gauteng, and KwaZulu-Natal broiler belts | Medium term (2-4 years) |
| Rise in prevalence of livestock diseases | +0.8% | Limpopo, KwaZulu-Natal, and Eastern Cape for FMD, and national for avian influenza | Short term (≤ 2 years) |
| Growing consumer demand for animal protein | +1.0% | National, with urban centers driving per-capita consumption growth | Long term (≥ 4 years) |
| Accelerating aquaculture commercialization | +0.6% | Coastal provinces (Western Cape, Eastern Cape, KwaZulu-Natal) and inland dams | Long term (≥ 4 years) |
| Stricter bio-security and feed safety regulations driving premium formulations | +0.7% | National, enforced by Department of Agriculture, Land Reform and Rural Development | Medium term (2-4 years) |
| Rapid mill-scale investment to offset load-shedding costs | +0.9% | Gauteng, Western Cape, and Free State milling hubs | Short term (≤ 2 years) |
| Source: Mordor Intelligence | |||
Increasing Demand for Poultry Products
Broiler placements increased in early 2024 following the return of flocks culled during 2023 avian influenza outbreaks, which revived grain-based feed orders despite higher per metric ton delivery expenses under enhanced biosecurity rules [1]Source: South African Poultry Association, “Broiler Placements and Production Statistics 2024,” sapoultry.co.za. Astral Foods introduced dedicated feed trucks and single-bin systems while regaining export certification. Retailers’ antibiotic-free mandates are accelerating the adoption of phytase and xylanase blends that trim feed-conversion ratios from 1.82 to 1.75 and recover wheat-bran energy. Quantum Foods scaled cage-free layer barns, prompting higher synthetic methionine and calcium inclusion to protect shell quality. The poultry segment thereby anchors overall growth, even while cheap imported chicken constrains miller pricing power and prioritizes feed efficiency.
Rise in Prevalence of Livestock Diseases
Foot-and-mouth disease outbreaks in Limpopo and KwaZulu-Natal in 2024 restricted cattle movements, resulting in a 12% decline in feedlot demand in quarantined zones [2]Source: Department of Agriculture, Land Reform and Rural Development, “Act 36 Proposed Amendments 2024,” dalrrd.gov.za. Persistent buffalo reservoirs near Kruger National Park force biannual vaccinations and stimulate interest in documented, traceable rations carrying batch-level audits. Recurrent avian influenza accelerated the shift to single-age broiler complexes, which necessitate farm-specific feed and just-in-time logistics, thereby straining independent mill capacity. African swine fever in the Eastern Cape and Limpopo caps pig-herd expansion, yet drives the uptake of pelleted starter diets that lower exposure for smallholders. Disease volatility raises fixed costs, but it differentiates mills that are able to deliver segregated runs with real-time traceability.
Growing Consumer Demand for Animal Protein
Value-added chilled meats require precise carcass weights, nudging feeders toward precision diets that yield uniform growth curves. Dairy drink demand is rising 1.8% annually, even as drought trimmed cow numbers, strengthening reliance on total mixed rations that maximize solids per kilogram of dry matter. Aquaculture contributes less than 1% of supply today but targets a tenfold rise by 2030, hinging on high-protein feeds for tilapia and catfish now constrained by fishmeal import tariffs. Feed mills must therefore straddle cost-sensitive commodity lines and premium formulations that satisfy an emerging sustainability niche.
Accelerating Aquaculture Commercialization
Operation Phakisa aims to produce 20,000 metric tons of farmed fish by 2030, thereby increasing demand for floating pellets containing 32–38% crude protein and a balanced amino acid profile. Domestic fishmeal is scarce, and tariffs add an average of USD 225 to imported lots, squeezing farmer margins. Abalone ranchers in the Western Cape employ kelp-soy blends fortified with attractants to support temperature-sensitive growth, segmenting supply to specialized mills. Agricultural Research Council trials have shown catfish feed-conversion ratios of 1.4–1.6 when using extruded pellets. Only a handful of mills own the required extrusion lines. Early adopters willing to invest in extrusion and fishmeal substitutes thus position themselves for double-digit feed growth as licensing accelerates.
Restraints Impact Analysis*
| Restraint | (~) % Impact on CAGR Forecast | Geographic Relevance | Impact Timeline |
|---|---|---|---|
| Fluctuating raw-material (maize and soybean) prices | -0.9% | National, with acute impact on Gauteng and Western Cape milling hubs | Short term (≤ 2 years) |
| Complex and evolving regulatory approval timelines | -0.4% | National, administered by Department of Agriculture, Land Reform and Rural Development | Medium term (2-4 years) |
| Chronic grid-power outages disrupting milling operations | -0.7% | Gauteng, Western Cape, Eastern Cape, and KwaZulu-Natal industrial zones | Short term (≤ 2 years) |
| Grain-rail and port bottlenecks limiting timely ingredient supply | -0.6% | Gauteng, Free State, and Western Cape dependent on Transnet rail corridors | Medium term (2-4 years) |
| Source: Mordor Intelligence | |||
Fluctuating Raw-Material (Maize and Soybean) Prices
Yellow maize on SAFEX traded between USD 176 and USD 264 per metric ton in 2024, as erratic rainfall reduced output to 13.5 million metric tons, 17% below the 2023 level [3]Source: JSE Limited, “SAFEX Agricultural Commodities Data 2024,” jse.co.za. Soybean meal prices climbed amid South American premiums and rand weakness, squeezing margins by metric ton. Substitutions with sunflower and canola meals introduced amino-acid shortfalls that required synthetic lysine and methionine. Real-time least-cost software reduces waste by 3–5%, yet uptake remains limited among small mills that lack NIR spectroscopy. Volatility is structural, given South Africa’s swing-exporter role, obliging mills to hedge futures and stockpile grain during harvest windows.
Complex and Evolving Regulatory Approval Timelines
Formula registration under Act 36 typically averages 9-15 months and costs between USD 825 and USD 1,375 per product for laboratory analyses. 2024 draft rules extend timelines by another 3–6 months to test mycotoxins and heavy metals, delaying market entry for innovative acids and phytogenics. Parallel import approvals for novel additives replicate the burden, handing established suppliers an advantage. The backlog slows innovation transfer from Europe and North America, dampening productivity gains that could offset grain inflation. Risk-based fast tracks remain under discussion without a firm launch date.
*Our forecasts treat driver/restraint impacts as directional, not additive. The impact forecasts reflect baseline growth, mix effects, and variable interactions.
Segment Analysis
By Animal Type: Poultry Dominance, Aquaculture Upswing
Poultry feed captured 39.60% of South Africa compound feed market share in 2025, reflecting both broiler restocking and layer upgrades for cage-free compliance. Broiler diets now feature higher-dose enzyme packs that improve feed-conversion ratios, preserving margins amid imported chicken competition. Ruminants remain second in volume, but drought and FMD movement bans suppressed placements, cooling demand for high-energy finishing rations. Swine feed trials, capped by African swine fever protocols that limit herd growth to niche commercial clusters. Poultry, therefore, anchors scale but demands continual cost control as retail price wars restrain feed pass-through.
Aquaculture feed is projected to grow at a 7.22% CAGR, redefining the growth profile of the South Africa compound feed market. Operation Phakisa licenses stimulate tilapia and catfish farms that require floating, extruded pellets with controlled water stability. Limited extrusion capacity and reliance on fishmeal favor early movers investing in specialized lines. As output scales up, aquaculture promises higher gross margins than commodity poultry feed, provided ingredient bottlenecks are solved. Exotic segments, such as ostrich and game, remain small but command premium pricing, contributing incremental profit without significant volume growth.



By Ingredient: Cereals Anchor Volume, Supplements Capture Value
Cereals accounted for 46.40% of total market share in 2025 and remain the backbone of energy supply in broiler starters, finisher crumbles, and total mixed rations for dairy. Although maize price swings heightened the adoption of wheat bran and molasses blends, necessitating amino acid corrections to maintain growth rates. Cakes and meals, led by soybean meal, offer protein density but expose mills to import logistics and currency volatility. By-products, such as maize gluten feed and canola meal, diversify formulations but vary in their nutrient profiles, requiring robust quality control.
Supplements are projected to expand at 6.55% CAGR, the fastest among ingredients, as millers deploy enzymes, amino acids, and probiotics to compress crude-protein levels and comply with antibiotic-free retail mandates. DSM-Firmenich protease blends and Evonik’s MetAMINO analogs lower nitrogen excretion, aligning with emissions guidelines and justifying price premiums. Organic acids and phytogenics replace growth-promoter antibiotics, while precision mineral packs address traceability requirements. This bifurcation of high-volume cereals and high-margin supplements defines margin pools inside the South Africa compound feed market.
Geography Analysis
Gauteng and the Western Cape represented the largest share of the 2025 market due to the presence of dense broiler complexes, port access for soybean meal, and the largest cluster of ISO-certified mills. Transnet rail disruptions compel these mills to hold larger maize buffers, which elevates working-capital costs but safeguards supply to integrated poultry groups. KwaZulu-Natal accounts for roughly 19.60% of demand, anchored by broilers in the Midlands and expanding dairy herds along the coast. FMD zones in the north have depressed feedlot placements.
In the Free State and North West, surplus maize hubs are seen as feedlot operators integrate backward, trimming purchases from commercial mills. Limpopo and Mpumalanga offer emerging opportunities as catfish projects in inland dams secure licenses, but limited milling infrastructure raises delivered feed costs. The Eastern Cape remains drought-affected, with beef and dairy herds severely impacted, and smallholder feed demand is rising only where government subsidy programs fund pelleted rations.
Coastal provinces are poised to capture a disproportionate share of aquaculture feed growth. Western Cape abalone ranches require kelp-soy blends, while KwaZulu-Natal tilapia farms seek floating red-tilapia pellets with 34–36% protein. Ingredient sourcing hurdles and scarce extrusion lines constrain immediate volume. A location near ports reduces transport costs for imported fishmeal. Geography, therefore, reflects a split between landlocked maize corridors that dominate established poultry, and coastal belts that incubate the next growth wave for the South Africa compound feed market.
Regulatory Landscape
South Africa regulates compound feed under the Fertilisers, Farm Feeds, Agricultural Remedies and Stock Remedies Act, 1947 (Act 36 of 1947), administered by the Department of Agriculture, Land Reform and Rural Development (DALRRD) through the Registrar. Manufacturers, importers, and sellers are required to register products with the Registrar, and registrations are typically issued for three-year validity periods. Registration conditions are tied to compliance on labeling, declared ingredients, additive inclusion levels, and tolerance limits specified in ministerial regulations.
Imports of finished feed and selected animal-origin inputs used in compounding (including processed animal protein) require DALRRD permits through animal health import controls, which adds compliance requirements for mills that rely on traded proteins and specialized ingredients. Facility-level requirements also apply for certain operations, including veterinary-approved standards for farm-feed mixing establishments referenced under protocols such as VPN/41/2012-01, supporting auditable production controls and the tighter feed traceability demanded by downstream livestock and poultry biosecurity programs.
Competitive Landscape
The South Africa Compound Feed Market is moderate. Integrated producers Archer Daniels Midland Co., Alltech, Inc., RCL Foods Ltd., Novus International, Inc., and Land O'Lakes, Inc. operate captive mills that ensure ingredient priority and steady off-take, providing them with economies of scale and the ability to withstand price squeezes during maize peaks. Independent formulators such as Nova Feeds, Meadow Feeds, and Serfco Feeds compete on customized formulations and advisory services, supplying dairy cooperatives and feedlots that value technical support.
RCL Foods’ 2024 unbundling of Rainbow Chicken, while retaining Epol, Driehoek, and Molatek, signals a pivot toward specialty ruminant nutrition and exits the head-to-head broiler feed rivalry, freeing capacity for niche, higher-margin lines. International additive suppliers DSM-Firmenich, Evonik, and Novus expand in-country technical teams, shifting competition from raw-cost toward nutrient-yield metrics.
Royal De Heus’ 1.2 MW solar array exemplifies capital-driven differentiation, ensuring production during Stage 6 load shedding and reducing power costs per metric ton. Smaller mills unable to fund embedded generation face consolidation pressures. ISO 22000 certification is now a quasi-ticket for supplying export-oriented farms, raising entry barriers and reinforcing scale advantages. Aquaculture feed remains the white-space arena where no incumbent holds more than niche capacity, inviting technology-rich entrants.
South Africa Compound Feed Industry Leaders
Alltech, Inc
Land O'Lakes, Inc.
Archer Daniels Midland Co.
RCL Foods Ltd.
Novus International, Inc
- *Disclaimer: Major Players sorted in no particular order

Market Opportunities and Future Outlook
Aquaculture commercialization and higher-value specialty formulations add whitespace beyond commodity poultry and ruminant rations, especially where extrusion capacity is constrained. Operation Phakisa targets 20,000 metric tons of farmed fish by 2030, but only a handful of local mills operate extrusion lines for floating pellets. That gap leaves room for targeted capacity additions, toll-manufacturing models, and partnerships with farms and license holders in coastal provinces. Public-sector enabling investment also supports this pathway, including the Eastern Cape Provincial Government-backed infrastructure build-out for the Coega Aquaculture Development Zone (ADZ), which began with the first 100 hectares.
Feed assurance and cost-risk tools are also shifting from optional to commercial requirements, creating demand for mills and additive suppliers that can provide auditable, digitally traceable inputs and reduce procurement uncertainty. In June 2026, the Animal Feed Manufacturers Association (AFMA) announced a review of its Code of Conduct to integrate advanced traceability, digital auditing, and risk-based compliance systems, aligning with stronger biosecurity and retailer-led transparency requirements. On the input side, AFMA engagement with the Johannesburg Stock Exchange (JSE) to introduce a soymeal futures contract highlights a practical approach for hedging a key protein cost, while rising uptake of enzymes, amino acids, and probiotic solutions supports performance-led premiumization within supplements.
Recent Industry Developments
- July 2026: The Animal Feed Manufacturers Association (AFMA) confirmed that South African feed production recovered by about 3.7% in 2025 versus the 6.9 million tons produced in 2024. The update underscored poultry as a key driver of volume recovery, reinforcing the importance of reliable ingredient supply and milling uptime as demand normalizes.
- May 2026: AFMA announced a comprehensive review of its Code of Conduct to integrate advanced traceability, digital auditing, and risk-based compliance systems. The review supports tighter biosecurity alignment and retailer transparency across the local mill network.
- September 2024: Royal De Heus commissioned a 1.2 MW rooftop solar array with battery storage at its Modimolle feed mill to keep pellet-press operations running during Eskom load-shedding. The project supports production continuity for poultry and ruminant customers and sets a reference point for energy resilience investments among South African millers.


Research Methodology Framework and Report Scope
Market Definition and Coverage
For this study, the market covers the value of manufactured compound feed sold in South Africa for livestock and poultry, where multiple ingredients are formulated into finished feed and supplied through commercial channels.
Scope exclusions: This sizing does not count on-farm mixing and feed made for own consumption, and it also excludes standalone feed additives sold separately from finished compound feed.
Segmentation Overview
- By Animal Type
- Poultry
- Ruminants
- Swine
- Aquaculture
- Other Animal Types
- By Ingredient
- Cereals
- Cakes and Meals
- By-Products
- Supplements
Data Sources, Market Sizing, and Validation
Desk Research
Desk research helped set the South Africa market context and provided consistent starting points for the model. We relied on public, repeatable references such as South Africa government agriculture and trade statistics, customs import-export series, central bank inflation and exchange-rate time series, and livestock and poultry production releases from official bodies.
To tighten the assumptions, we also reviewed sources such as industry and producer association updates, peer-reviewed animal nutrition literature, and publicly available company reports and presentations that discuss feed volumes, input costs, and capacity moves. Where needed, a paid subscription for company financials and an import-export shipment-level database were used to cross-check revenue ranges and raw material flow signals. The sources listed here are illustrative only, and many other references were also used for data collection, validation, and clarification.
Primary Interviews and Surveys
Primary work focused on validating what desk inputs could not fully explain, especially product mix shifts, price pass-through timing, and channel margins. We spoke with a mix of feed manufacturers, ingredient distributors, large livestock and poultry producers, and industry experts across South Africa so assumptions could be checked before totals were finalized.
Input from these conversations was used to confirm utilization patterns, typical contract durations, and how demand responds to livestock cycles and grain price moves, which then helped narrow the acceptable range for the final number.
Distribution of primary research fieldwork respondents
| Company type | Respondent position | Region |
|---|---|---|
| Top tier: 27% | CXOs: 13% | APAC: 45% |
| Mid tier: 52% | Functional/Unit leaders: 42% | EMEA: 35% |
| Smaller Players: 21% | Managers: 45% | Americas: 20% |
Market-Sizing & Forecasting
Sizing was built using a mix of top-down and bottom-up logic so the outcome stayed realistic even when some data points were imperfect. On the top-down side, production and trade data were used to reconstruct the local demand pool for compound feed, which was then translated into value using species-level feed mix and observed pricing ranges. We then corroborated the totals with selective bottom-up approximations such as sampling manufacturer revenue bands, checking channel pricing, and applying volume-by-ASP tests for the main animal groups.
Key inputs tracked included livestock and poultry population trends, commercial slaughter and production indicators, typical inclusion rates by species, local grain and oilseed meal price direction, and import reliance for specific ingredients. Where the bottom-up view had gaps, the missing pieces were handled through conservative ranges anchored to capacity signals and validated price bands, then reconciled back to the demand-pool totals.
For forecasting, scenario analysis was applied around the variables that drive consumption and pricing most directly, followed by a time-series check so the trajectory does not jump unrealistically. Assumptions on herd and flock dynamics, input cost movements, and pass-through lag were reviewed with experts so the forward view stayed practical.
Data Validation & Update Cycle
Validation was done through triangulation across multiple checks so a single source did not decide the outcome. Model outputs were compared against independent signals such as implied feed volumes by species, trade flows of key ingredients, and price movement versus grain benchmarks, and any obvious variances were investigated before sign-off.
A second analyst review was used to re-check formulas, units, and year alignment, and any large variance triggered follow-up outreach to re-test the assumption that caused it. Reports are refreshed annually, with interim updates when material events occur, and a final pre-delivery pass is completed so clients receive the latest updated view.
Mordor Intelligence's South African Compound Feed Market Size Versus Other Published Estimates
Published market sizes for South African compound feed can differ because not everyone counts the same scope, and the pricing logic is also handled differently across models. The gaps usually come from what is treated as commercial compound feed versus informal mixing, how raw material swings are translated into selling prices, and whether the base year aligns to the same inflation and currency timing.
The main gap comes from whether informal milling and on-farm mixing are included in the revenue total, where Mordor Intelligence counts only commercially manufactured compound feed sold into the market and cross-checks species-level price progression against grain and oilseed meal indicators.
Benchmark comparison
| Source | Market Size | Gaps in Research Methodology |
|---|---|---|
| Mordor Intelligence | USD 5.92 B (2025) | |
| Regional Consultancy A | USD 4.20 B (2024) | Uses an earlier base year and can understate value when input-cost pass-through is delayed or uneven across animal groups, and the split between commercial feed and informal supply is not clearly evidenced. |
| Trade Journal B | USD 6.90 B (2031) | Applies a faster growth path and higher ASP expansion into the forecast years, and it is not always clear how adjacent feed categories are kept out when projecting the total forward. |
Taken together, the differences largely come down to scope inclusion and how price movement is carried into the year being reported. The method stays traceable to a defined demand pool and simple checks, which makes it easier to revisit the same inputs when new production, trade, and pricing signals emerge.


Key Questions Answered in the Report
How large is the South Africa compound feed market in 2026?
The South Africa compound feed market size is USD 6.22 billion in 2026.
Which segment is growing fastest through 2031?
Aquaculture feed is projected to expand at a 7.22% CAGR through 2031 as Operation Phakisa licensing accelerates.
What is driving higher supplement use in feed formulations?
Stricter antibiotic-free mandates and volatile grain prices are pushing mills toward enzymes, amino acids, and probiotics that improve feed efficiency and lower nitrogen excretion.
How are feed mills coping with Stage 6 load-shedding?
Capitalized mills are installing solar-battery systems that cut grid reliance by up to 40% and secure uninterrupted production, giving them a 12% cost edge during outages.
Why are regulatory timelines considered a restraint?
Registering new formulas under Act 36 can take up to 15 months and recent draft rules add residue testing that further extends approval by 3-6 months, slowing innovation adoption.
Which provinces hold the most feed demand today?
Gauteng and Western Cape together account for about 54.20% of national tonnage due to dense poultry production and port access for imported soybean meal.
Page last updated on:






