
Online Advertising Market Size and Share
Market Overview
| Study Period | 2020 - 2031 |
|---|---|
| Market Size (2026) | USD 323.74 Billion |
| Market Size (2031) | USD 525.39 Billion |
| Growth Rate (2026 - 2031) | 10.17 % |
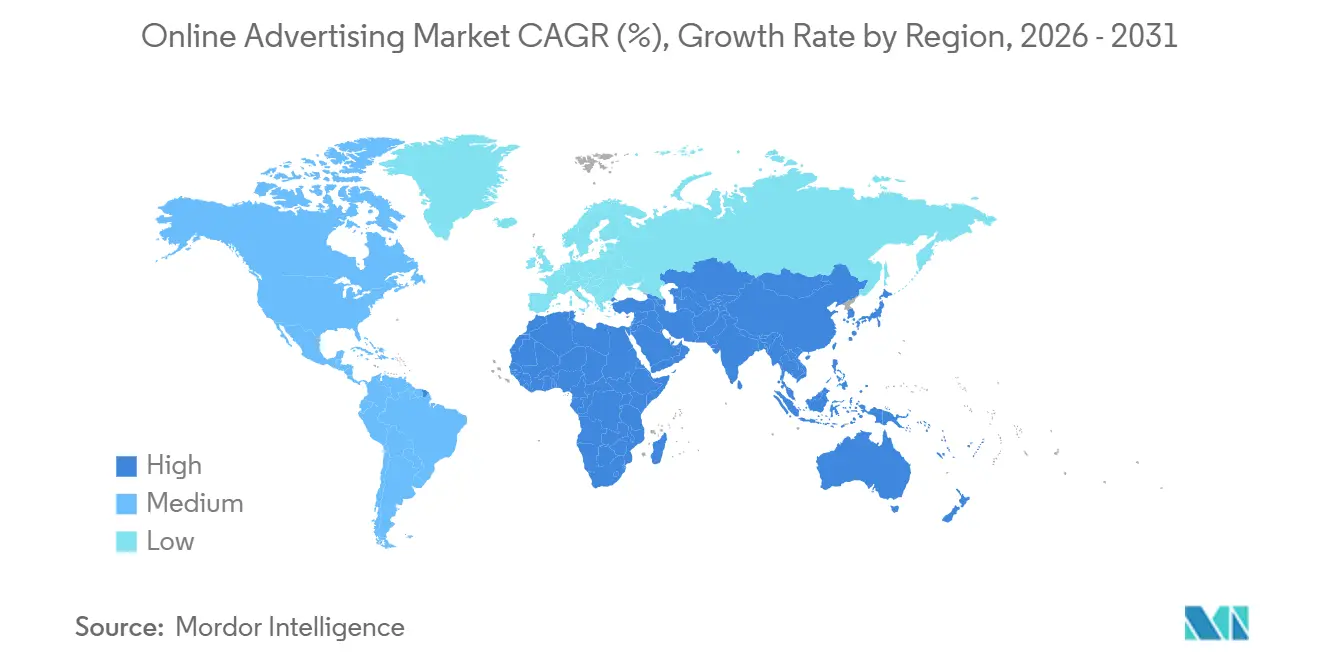
| Fastest Growing Market | Asia Pacific |
| Largest Market | North America |
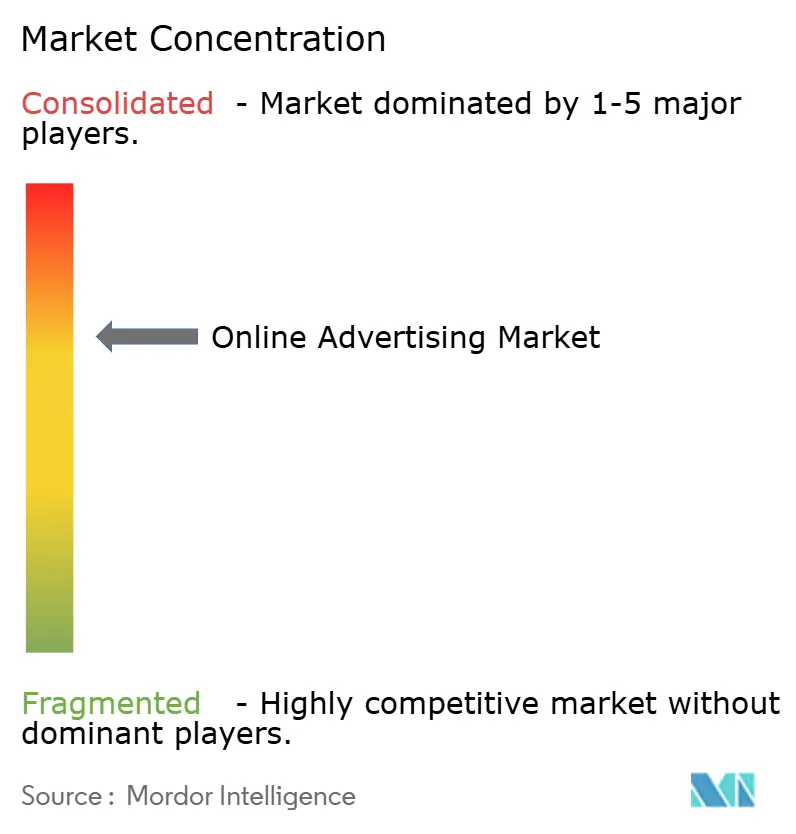
| Market Concentration | Medium |
Major Players *Disclaimer: Major Players sorted in no particular order Image © Mordor Intelligence. Reuse requires attribution under CC BY 4.0. | |
Online Advertising Market Analysis by Mordor Intelligence
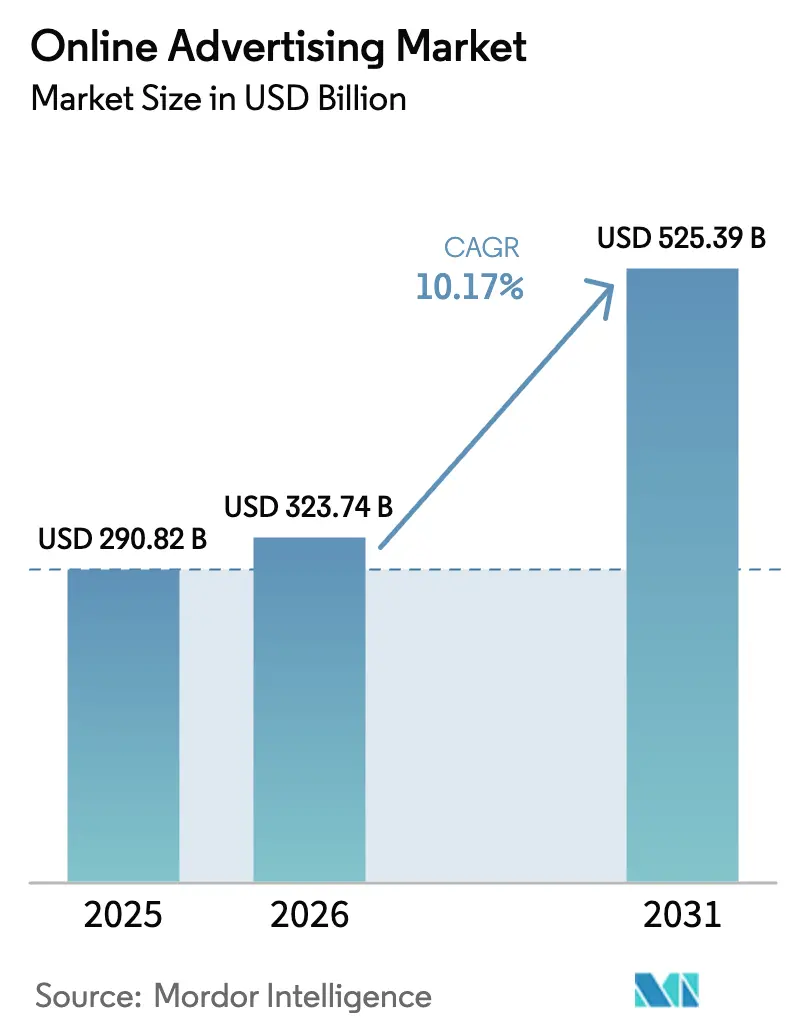
The Online Advertising Market size is projected to expand from USD 290.82 billion in 2025 and USD 323.74 billion in 2026 to USD 525.39 billion by 2031, registering a CAGR of 10.17% between 2026 to 2031.
Growth reflects a steady shift of budgets from linear television toward addressable digital channels, the rapid monetization of retail media networks, and deeper use of programmatic automation that links spend to measurable purchase outcomes. Advertisers favor auction-based inventory that updates bids in milliseconds, rely on short-form video that outperforms static banners, and chase audiences migrating to mobile and connected-TV screens. Competitive advantage now stems from ownership of first-party consumer data rather than pure scale, while regional growth differentials favor Asia Pacific, where super-apps integrate shopping, payments, and social feeds inside single log-ins. Against this backdrop, privacy regulation, digital-services taxes, and bot-driven fraud raise compliance costs for mid-sized ad-tech firms and concentrate spend within larger platforms able to absorb new overheads.
Key Report Takeaways
- By ad buying model, programmatic real-time bidding led with 54.28% of online advertising market share in 2025 and is expanding at an 11.22% CAGR through 2031.
- By platform, mobile commanded 63.79% of online advertising market size in 2025, while connected TV is advancing at an 11.09% CAGR to 2031.
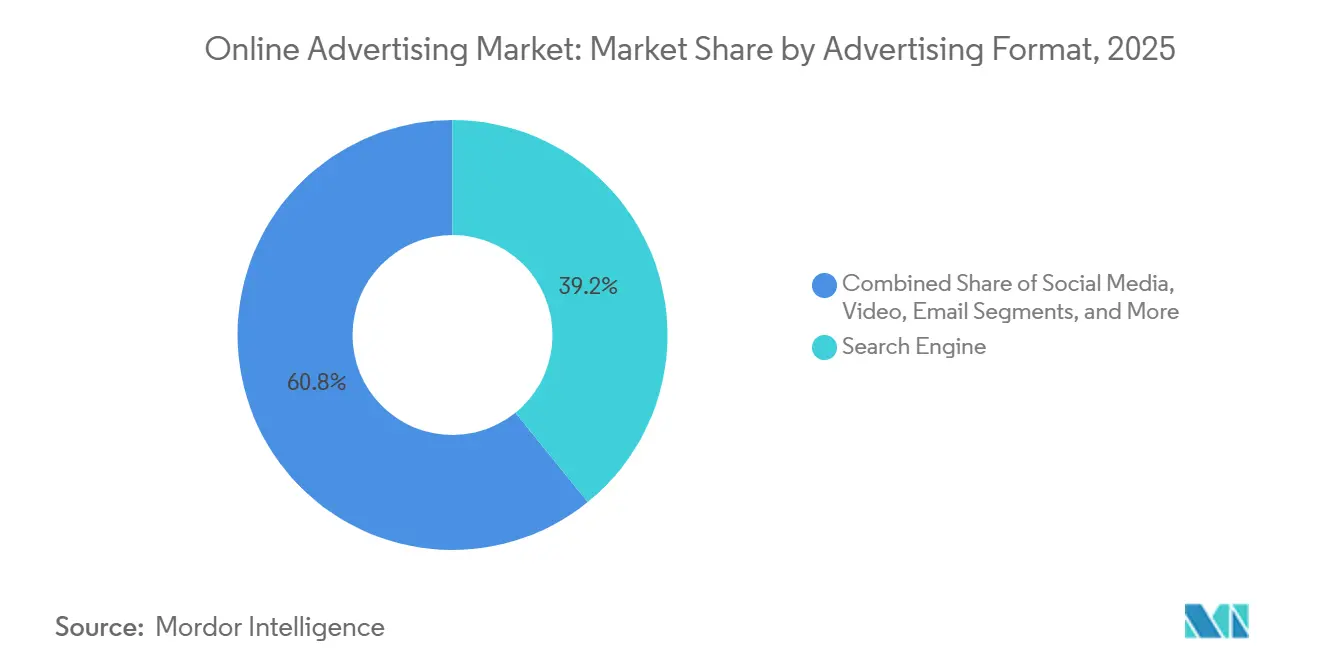
- By advertising format, search retained 39.16% revenue share in 2025; video is the fastest-growing format at a 10.59% CAGR through 2031.
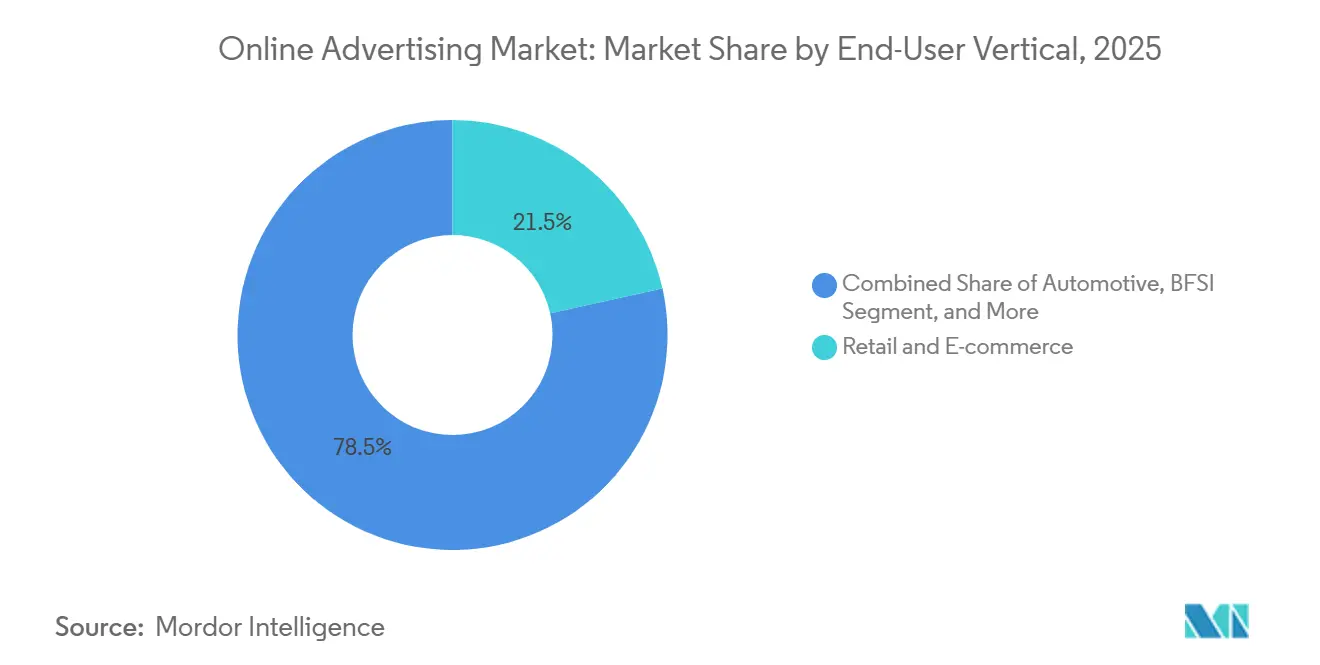
- By end-user vertical, retail and e-commerce captured 21.53% of spending in 2025 and is projected to expand at a 10.84% CAGR to 2031.
- By geography, North America held about 35.19% of the online advertising market in 2025, while Asia Pacific recorded the fastest double-digit growth rate through 2031 at 11.37%.
Note: Market size and forecast figures in this report are generated using Mordor Intelligence’s proprietary estimation framework, updated with the latest available data and insights as of January 2026.
Market Trends and Insights
Drivers Impact Analysis of Online Advertising Market*
| Driver | (~) % Impact on CAGR Forecast | Geographic Relevance | Impact Timeline |
|---|---|---|---|
| Retail Media Networks Monetization Driving Closed-Loop ROAS for CPG Brands | +2.1% | Global, with concentration in North America, Europe, and China | Medium term (2-4 years) |
| Increasing Smartphone Penetration Boosting Mobile Ad Impressions Globally | +1.8% | Global, with acceleration in Asia Pacific, Middle East, and Africa | Long term (≥ 4 years) |
| Shift of TV Budgets to Connected TV Platforms Expanding Programmatic Video Inventory | +2.3% | North America and Europe core, emerging in Asia Pacific | Medium term (2-4 years) |
| 5G-Enabled Immersive Video Ads Accelerating Spend in South-East Asia | +1.5% | South-East Asia primary, spill-over to India and Middle East | Medium term (2-4 years) |
| AI-Generated Dynamic Creative Optimization Reducing CPA in North America | +1.6% | North America and Europe, early adoption in Australia | Short term (≤ 2 years) |
| Commerce-Search Integration in Super-Apps Fueling In-App Ads Across China and South-East Asia | +1.9% | China and South-East Asia core, limited adoption in South America | Medium term (2-4 years) |
| Source: Mordor Intelligence | |||
Retail Media Networks Monetization Driving Closed-Loop ROAS for CPG Brands
Retail media networks grew into strategic profit centers in 2025 as Amazon Ads, Walmart Connect, and Instacart Ads jointly attracted roughly USD 50 billion in annual spend. Brands value the closed-loop attribution that links on-site impressions to confirmed checkouts, eliminating guesswork around viewability proxies. Bain and Company calculated three-to-five-times higher return on ad spend for retail media versus open-web display in 2025. Sam’s Club extended its Member Access Platform by giving suppliers transactional data for granular audience segmentation capabilities that conventional publishers cannot match. As a result, legacy display outlets lose budget share, and inventory supply is concentrating in vertically integrated ecosystems that own both ad server and point of sale.
Increasing Smartphone Penetration Boosting Mobile Ad Impressions Globally
Global smartphone subscriptions hit 6.8 billion in 2025, lifting mobile to 63.79% of total spend and giving advertisers an always-on screen that dominates daily media time.[1]Ericsson, “Mobility Report,” ericsson.com Users average 4.8 hours per day on handheld devices, more than double desktop engagement. Cheaper 5G phones in India, Indonesia, and Nigeria are enlarging addressable audiences where desktop ownership remains below 20%. Google’s Performance Max campaigns generated 18% more conversions per dollar on mobile placements than desktop during H1 2025, reinforcing advertiser preference for mobile-first creative strategies.
Shift of TV Budgets to Connected-TV Platforms Expanding Programmatic Video Inventory
Linear television spend in the United States fell 8% year-over-year in 2025, freeing USD 7 billion that migrated to connected-TV environments offering audience targeting and real-time reporting. Amazon introduced ads on Prime Video in 2024, instantly adding 200 million ad-supported viewers. Roku’s platform revenue grew 16% in 2025, with programmatic channels contributing 55% of ad sales compared with 42% in 2023. Advertisers gain household-level segmentation and 90% completion rates that broadcast cannot replicate, accelerating cord-cutting and pressuring traditional network margins.
5G-Enabled Immersive Video Ads Accelerating Spend in South-East Asia
5G subscriptions in South-East Asia passed 150 million in 2025, unlocking high-definition vertical video and augmented-reality try-ons that were bandwidth-constrained on 4G.[2]GSMA Intelligence, “Mobile Economy Asia Pacific 2025,” gsma.com TikTok reported 22% higher engagement for immersive ads in Indonesia versus standard in-feed units. Telkomsel’s partnership with Google enables zero-rated video inventory, extending reach among price-sensitive users while preserving first-party behavioral insights.[3]Telkomsel, “Google Partnership,” telkomsel.com This convergence of network speed, sensor-rich devices, and creative tooling raises brand appetite for experiential formats across South-East Asia.
Restraints Impact Analysis of Online Advertising Market*
| Restraint | (~) % Impact on CAGR Forecast | Geographic Relevance | Impact Timeline |
|---|---|---|---|
| Signal-Loss from Third-Party-Cookie Deprecation in the EU Undermining Targeting | -1.4% | Europe core, with secondary impact in North America and Australia | Medium term (2-4 years) |
| Digital-Services Taxes in the United Kingdom and France Squeezing Platform Margins | -0.8% | United Kingdom and France primary, potential expansion to Germany and Italy | Short term (≤ 2 years) |
| Strict Privacy Regulations such as CCPA and LGPD Raising Compliance Costs | -1.1% | North America (California), South America (Brazil), with influence in Asia Pacific | Long term (≥ 4 years) |
| Fraudulent Traffic from AI-Generated Bots Inflating CPMs in Emerging Markets | -0.9% | Emerging markets in Asia, Africa, and South America, with spill-over to Europe | Medium term (2-4 years) |
| Source: Mordor Intelligence | |||
Signal-Loss from Third-Party-Cookie Deprecation in the European Union Undermining Targeting
Google’s staged phase-out of third-party cookies removed cross-site IDs for 65% of European web users by mid-2025. IAB Europe recorded a 23% decline in programmatic CPMs for open-web publishers during H1 2025. Criteo’s European revenue slid 11% year-over-year in Q2 2025 as commerce-data partnerships failed to fully replace deterministic cookies. Privacy Sandbox APIs remain below 30% adoption as of December 2025, widening the performance gap between walled gardens and open web.
Digital-Services Taxes in the United Kingdom and France Squeezing Platform Margins
The United Kingdom’s 2% and France’s 3% levies on gross digital-ad revenue extracted roughly USD 1.2 billion from platform operators in 2025. Smaller supply-side platforms such as PubMatic and Magnite absorbed 4%–6% hits to net income, forcing fee hikes to advertisers or lower revenue shares to publishers. Uncertainty around a wider EU-wide tax in 2027 delays infrastructure investment and nudges some vendors to relocate legal entities.
*Our forecasts treat driver/restraint impacts as directional, not additive. The impact forecasts reflect baseline growth, mix effects, and variable interactions.
Online Advertising Market Segment Analysis
By Advertising Format:
Video Accelerates as Short-Form Monetization MaturesVideo accounted for 29% of 2025 spend and is growing at a 10.59% CAGR, outpacing the broader online advertising market. YouTube Shorts logged 70 billion daily views in 2025, and Alphabet activated mid-roll monetization in Q2, unlocking fresh inventory.[4]Alphabet, “Q2 2025 Earnings Call,” abc.xyz TikTok’s in-feed units generated USD 14.5 billion in 2024 revenue, expanding 35% year-over-year. Advertisers embed product tags inside video frames for one-tap purchases, blending commerce with entertainment. Search retained a leading 39.16% share in 2025 because intent-rich queries convert two-to-three times better than interruptive placements, though growth moderates as incremental query volume plateaus. Display faces structural headwinds from cookie deprecation, steering spend to contextual placements that carry lower CPMs. Email remains niche for direct-to-consumer brands using owned lists to bypass platform fees, yet inbox saturation and tightening spam filters cap scale.
A second wave of innovation ties video directly to transaction data. Amazon’s Fire TV integrates shoppable overlays tied to Prime checkout, while Meta’s Advantage+ generates video creatives on the fly, trimming CPA by 12% in pilot studies. As video merges with commerce and automation, the format’s share within online advertising market size is poised to keep widening over the forecast horizon.



By Platform:
Connected-TV Disrupts Linear as Addressability ScalesMobile maintained 63.79% of spend in 2025 because smartphones accompany users throughout the day and drive multisession behavior. Connected-TV share remains smaller but rises at an 11.09% CAGR, the fastest platform trajectory within the online advertising market. Amazon’s Prime Video introduced ads to 200 million global viewers, temporarily softening CPMs by 12% in Q1 2024 before demand caught up. Roku finished 2024 with 85 million active accounts, and Samsung Ads now reads viewing data from 60 million smart TVs across North America and Europe. Desktop usage declines among younger cohorts who favor mobile-first consumption, though it retains value for workplace B2B campaigns. Other screens such as in-game or digital out-of-home add incremental reach but lack unified measurement, limiting budget flows for now.
Cross-screen identity solutions seek to tie household-level exposure on connected-TV to mobile retargeting. The Trade Desk’s Ventura OS offers a single dashboard for planning across display, audio, and streaming, simplifying workflow for midsize advertisers entering programmatic buying. As addressability improves, connected-TV could challenge mobile for incremental dollars, especially for brand video budgets relocating from broadcast.
By End-User Vertical:
Retail and E-commerce Lead as Attribution TightensRetail and e-commerce represented 21.53% of 2025 spend and will rise at a 10.84% CAGR, mirroring the expansion of retail media networks. Walmart Connect delivered USD 3.4 billion in fiscal-2025 revenue, up 26% year-over-year. Instacart Ads exceeded USD 1 billion in 2024, capturing trade-marketing budgets directly at the point of purchase. Automotive lifted digital outlays 14% in 2025 to launch new EV models using high-impact video and live streams that bypass traditional dealerships. BFSI leans on mobile-first ads to promote app-based banking and contactless payments. Healthcare remains regulated outside the United States, yet telehealth apps create privacy-compliant channels for condition-specific messaging. Verticals without transaction data, such as broadcast media, face yield compression, making first-party commerce insight the determinant of future share within the online advertising market.
Retailers increasingly extend their data off-site. Sam’s Club and Carrefour sell shopper segments into streaming and social channels, producing omnichannel frequency control. As closed-loop attribution becomes standard, retail and e-commerce share of online advertising market size should keep climbing, squeezing publishers that cannot match purchase-based optimization.
By Ad Buying Model:
Programmatic RTB Extends Lead as Automation DeepensProgrammatic RTB already accounts for 54.28% of 2025 spend and posts an 11.22% CAGR, reinforcing automation as the default workflow. Open-auction liquidity allows long-tail advertisers to enter with sub-USD 1,000 budgets, although small buyers pay higher effective CPMs than enterprise cohorts who negotiate volume discounts. Programmatic guaranteed appeals to brand campaigns seeking placement in premium content under fixed rates but grows slower because supply is finite and publishers prefer yield-maximizing auctions. Manual insertion orders continue for tent-pole events but shrink in share as agencies digitize. Self-serve dashboards from Meta and Google simplify campaign setup for SMBs but push creative burden onto advertisers, making generative AI tools critical.
Independent players innovate to compete with walled gardens. The Trade Desk’s Kokai AI uses large language models to correlate contextual signals with bid modifiers, reducing wasted impressions by 18% for automotive pilots. Magnite posted 31% year-over-year CTV revenue growth in Q3 2025 as streaming apps shifted unsold inventory from direct deals into programmatic pipes. As more impressions pass through automated auctions, programmatic RTB’s share of online advertising market share will likely exceed 60% before 2031.
Geography Analysis
North America Online Advertising Market
North America contributed 35.19% of 2025 spending, anchored by the United States where per-capita outlay reached USD 650 and Google, Meta, and Amazon absorbed over 60% of budget. Canada rose 9% in 2025, powered by Loblaw’s PC Optimum and Canadian Tire’s Triangle Rewards retail networks. Mexico advanced 12% as Mercado Libre monetized shopper data. While privacy regulation such as the California Consumer Privacy Act lifts compliance overhead, high-value consumers sustain premium CPMs.
APAC Online Advertising Market
Asia Pacific is the fastest-growing region at an 11.37% CAGR. China generated roughly USD 120 billion in 2025 advertising revenue as Taobao and Douyin blended video, commerce, and payments. India, Indonesia, and Vietnam rely on mobile-only users, letting advertisers skip desktop era infrastructure. Japan shifted budgets to connected-TV where NHK and Fuji Television launched ad-supported streaming. South Korea doubles down on super-app ecosystems from Naver and Kakao. Australia’s CartologyAI pushes programmatic audio while New Zealand emulates these models.
Europe Online Advertising Market
Europe faces cookie deprecation and digital-services taxes that damp open-web monetization. Germany, the United Kingdom, and France deliver 55% of regional spend. The United Kingdom still grew 7% in 2025 as brands took refuge within walled gardens.[5]Advertising Association, “Q4 2025 Report,” adassoc.org.uk France saw 18% connected-TV growth thanks to Canal+ programmatic ad insertion. Italy and Spain expanded 9% and 8% respectively on back of mobile commerce.
South America Online Advertising Market
South America added 13% in 2025, with Brazil at 60% of regional spend as Mercado Libre and Magazine Luiza grew retail media. Argentina contracted 5% amid currency stress. Lower per-capita outlay at USD 85 limits upside, and connected-TV trails due to broadband gaps.
MEA Online Advertising Market
Middle East and Africa are the smallest yet expanding swiftly. The United Arab Emirates and Saudi Arabia concentrate 70% of Middle East spend. Turkey rose 15% in 2025 despite lira volatility, and South Africa increased 11% on mobile WhatsApp Business placements. Infrastructure bottlenecks restrain high-bandwidth formats but young demographics offer long-run potential within the online advertising market.

Regulatory Landscape
The regulatory environment for online advertising is tightening around privacy, ad transparency, and substantiation of claims, which raises compliance workload for advertisers, publishers, and ad-tech intermediaries. In the European Union, the Digital Services Act (DSA) places ad-labeling and transparency duties on platforms, including requirements to disclose key information about ad targeting and the parties involved, with obligations intensifying for Very Large Online Platforms (VLOPs) operating at scale (commonly referenced at 45 million+ monthly EU users). Separately, Regulation (EU) 2024/900 on the transparency and targeting of political advertising (enacted in March 2024) introduces standardized transparency notices and repository-style disclosure expectations for online political ads, increasing operational and verification requirements for campaigns, platforms, and verification partners.
The United Kingdom is developing its approach through programs such as the Online Advertising Taskforce (progress reporting in 2025) and ongoing privacy enforcement under the UK GDPR and PECR. In May 2026, the UK Information Commissioner’s Office (ICO) provided advice to the Department for Science, Innovation and Technology (DSIT) regarding potential new exceptions to PECR Regulation 6 (cookie and similar tracking rules) for online advertising, while noting that any tracking-related changes still sit alongside UK GDPR obligations for personal data processing. In the United States, the Federal Trade Commission (FTC) continues a principles-led framework under Section 5 of the FTC Act (truthful, non-deceptive, evidence-backed claims) and endorsement and testimonial guidance under 16 CFR Part 255, shaping disclosure practices across influencer, performance, and brand advertising.
Competitive Landscape
The market remains oligopolistic; Google, Meta, and Amazon captured about 55% of 2025 spend by pairing search, social, commerce, and streaming with unmatched first-party data graphs. Walled gardens integrate ad server, demand-side platform, and measurement tools, creating high switching costs for advertisers chasing closed-loop attribution. Independent ad-tech firms such as The Trade Desk, Magnite, and PubMatic aggregate open-web inventory, but their upside depends on publishers sharing authenticated identifiers as third-party cookies disappear.
Retail media networks add a third competitive pillar. Amazon, Walmart, and Instacart wield transaction histories that deliver SKU-level attribution unavailable to traditional outlets. Technology is the new moat: Meta’s Advantage+ auto-generates ad variants and trimmed CPA by 12% in Q3 2025, while The Trade Desk’s Kokai adjusts bids by local weather to cut waste by 18%. Smaller vendors lacking proprietary AI face fee compression as advertisers gravitate toward platforms bundling media, creative, and analytics.
Regional specialists also gain. Tencent in China and Grab in South-East Asia embed ads inside super-apps combining chat, ride-hailing, and payments, creating walled gardens on a geographic scale. ByteDance integrates checkout into TikTok Shop across 12 markets, raising ROAS by 18% in pilots. As data privacy regimes tighten, platforms that own login graphs remain best positioned to capture incremental share within the online advertising market.
Online Advertising Industry Leaders
Google LLC
Meta Platforms Inc.
Amazon.com Inc. (Amazon Ads)
ByteDance Ltd. (TikTok)
Microsoft Corp. (LinkedIn, Bing Ads)
- *Disclaimer: Major Players sorted in no particular order
Online Advertising Market Companies Covered in this Report
- Google LLC
- Meta Platforms Inc.
- Amazon.com Inc. (Amazon Ads)
- ByteDance Ltd. (TikTok)
- Microsoft Corp. (LinkedIn, Bing Ads)
- Alibaba Group (Alimama)
- Tencent Holdings Ltd. (WeChat, Tencent Ads)
- Baidu Inc.
- Snap Inc.
- Pinterest Inc.
- X Corp. (Twitter)
- Spotify Technology S.A.
- Roku Inc.
- Comcast Corp. (FreeWheel)
- Samsung Ads
- Verizon Media (Yahoo)
- Adobe Inc.
- Oracle Advertising
- The Trade Desk Inc.
- Magnite Inc.
- Criteo S.A.
- Taboola Inc.
- PubMatic Inc.

Market Opportunities and Future Outlook
Retail media and closed-loop measurement continue to expand budget headroom for platforms that can connect ad exposure to purchase outcomes, illustrated by Amazon Ads, Walmart Connect, and Instacart Ads reaching about USD 50 billion in combined annual spend in 2025 within the report context. This supports whitespace for off-site retail media extensions and interoperable measurement workflows that let retailers and advertisers apply shopper segments beyond owned-and-operated inventory (for example, selling segments into streaming and social to support omnichannel frequency control). On the supply side, connected-TV programmatic pipes are expanding as streaming ad tiers and programmatic insertion mature, but identity resolution and cross-screen measurement remain uneven across publishers, leaving room for independent activation and measurement layers.
Privacy-driven signal loss and transparency mandates are also changing product strategy and investment priorities. In Europe, cookie deprecation and DSA transparency requirements push advertisers toward first-party data, consent-based measurement, contextual buying, and clean-room style collaboration, concentrating value in platforms and publishers with authenticated traffic. Infrastructure and AI capability are becoming practical constraints and opportunity areas: Meta disclosed very large 2026 capex plans tied to AI data center and cloud infrastructure, and in July 2026 it announced an expansion of its Richland Parish, Louisiana data center campus to 5GW with an investment of USD 50 billion, highlighting how compute availability can influence auction latency, modeling, and creative automation at scale. As a result, demand grows for tools that reduce creative and measurement friction (dynamic creative optimization, modeled conversion measurement, and privacy-safe audience activation), while mid-sized ad-tech firms face higher barriers where compliance and compute depth are missing.
Recent Industry Developments in Online Advertising Market
- April 2026: Google announced the transition of Dynamic Search Ads (DSA) to AI Max for Search campaigns, with the change scheduled to take effect in September 2026. The shift consolidates automation and targeting into a newer AI-led workflow, requiring advertisers and agencies to update campaign structures, creative inputs, and measurement practices for search buying.
- December 2025: Google enabled AI-generated video ads in YouTube Shorts, reducing creative production cycle time from weeks to hours. Faster iteration supports higher testing velocity for short-form video, and it increases competitive pressure on advertisers that lack in-house creative automation.
- April 2024: Amazon introduced ads on Prime Video, materially increasing global ad-supported streaming inventory by bringing ads to a large viewer base. This accelerated the shift of brand video budgets into connected-TV and supported broader programmatic demand for premium streaming supply.


Online Advertising Market Report Scope and Research Methodology
Market Definition and Coverage
For this study, the market covers paid advertising delivered through internet-connected devices, where campaigns are bought and measured on common pricing bases like CPM, CPC, CPA, or fixed fees. It includes placements sold through self-serve tools, programmatic pipes, and direct insertion orders.
Scope exclusions: Production fees, influencer barter arrangements, and non-internet digital out-of-home inventory are excluded from the market value.
Segments Covered in This Report
- By Advertising Format
- Social Media
- Search Engine
- Video
- Display Advertising
- By Platform
- Mobile
- Desktop and Laptop
- Connected TV
- Other Platforms
- By End-User Vertical
- Automotive
- Retail and E-commerce
- Healthcare and Pharma
- BFSI
- Telecom
- Other End-User Verticals
- By Ad Buying Model
- Programmatic Real-Time Bidding
- Programmatic Guaranteed
- Direct Insertion Order
- Self-Serve
- By Geography
- North America
- United States
- Canada
- Mexico
- South America
- Brazil
- Argentina
- Rest of South America
- Europe
- Germany
- United Kingdom
- France
- Italy
- Spain
- Rest of Europe
- Asia Pacific
- China
- Japan
- South Korea
- India
- Australia
- New Zealand
- Rest of Asia Pacific
- Middle East and Africa
- Middle East
- United Arab Emirates
- Saudi Arabia
- Turkey
- Rest of Middle East
- Africa
- South Africa
- Rest of Africa
- Middle East
- North America
Data Sources, Market Sizing, and Validation
Desk Research
Desk work starts by mapping the spend pool and the delivery channels that make online advertising measurable in dollars. We rely on public references such as U.S. Census retail e-commerce statistics, the International Telecommunication Union for connectivity indicators, OECD national accounts for ad intensity versus GDP, and the World Bank for inflation and exchange-rate series.
To keep assumptions grounded, additional checks are taken from SEC filings and investor presentations of major digital publishers and ad-tech intermediaries, earnings call transcripts, and reputable association and regulator websites that describe ad rules and privacy limits. When structured company financials are needed, or when patent signals, shipment-level trade data for ad-related hardware, or contract and tender details have to be quantified, we also use approved paid database subscriptions for those exact use cases. The desk sources listed here are illustrative, and many other public references were used for data collection, cross-checks, and clarification.
Primary Interviews and Surveys
Primary work is used to sanity-check channel shares, pricing progression, and buying-model splits, since those move faster than most public datasets. We speak with demand-side teams (brand and performance marketers), supply-side teams (publishers and networks), and service providers. After that, we validate differences across APAC, EMEA, and the Americas so the final mix is not dominated by one region's channel and monetization pattern.
Distribution of primary research fieldwork respondents
| Company type | Respondent position | Region |
|---|---|---|
| Top tier: 37% | CXOs: 13% | APAC: 47% |
| Mid tier: 45% | Functional/Unit leaders: 35% | EMEA: 30% |
| Smaller Players: 18% | Managers: 52% | Americas: 23% |
Market-Sizing & Forecasting
Sizing begins with a top-down demand reconstruction where total ad budgets are rebuilt from digital media spend signals, internet user and smartphone penetration, and the ongoing shift from offline media to online formats. The totals are then allocated using observable mix indicators such as search versus display and video share, mobile versus desktop and CTV usage, and the split between programmatic RTB, direct insertion orders, and self-serve buying.
To keep the totals from drifting, we corroborate the outcome with selective bottom-up approximations, including sampled publisher revenue roll-ups, channel checks on CPM and CPC ranges, and volume-by-coverage checks (impressions, clicks, and video views translated through typical monetization rates). Where bottom-up pieces are incomplete, gaps are filled using proxy weights from comparable geographies and then adjusted after primary feedback confirms the direction and size of the gap.
For forecasting, scenario analysis is used because pricing, privacy rules, and platform mix can change in steps instead of smoothly. Inputs that matter most include digital ad load trends, cookie and identifier changes, retail media growth rates, CTV inventory expansion, and expected CPM and CPC movements, which are reviewed with interviewees so the final outlook stays practical and explainable.
Data Validation & Update Cycle
Validation is done through triangulation and variance checks so the model stays traceable. We compare outputs against independent signals like regional digital spend trends, publisher revenue direction, and buying-model shifts, and then anomalies are reviewed before sign-off.
If a material mismatch is found, the team re-checks assumptions, re-contacts relevant respondents, and revisits currency timing and inflation treatment to remove avoidable distortions. The report is refreshed annually, and interim updates are made when major events occur, such as policy changes that impact tracking, large demand shocks, or sudden pricing moves. Before delivery, a final analyst pass is completed so clients get the latest updated view.
Mordor Intelligence's Online Advertising Market Estimate Compared With Other Published Estimates
Published market sizes for online advertising do not always line up because the boundaries of what is counted can be slightly different, even when the label looks identical. Differences usually come from what is included as ad spend, how buying models are treated, and whether adjacent items like production services are mixed into the number.
The table also shows that year selection and currency timing can widen the spread, since pricing and volume can move quickly across search, video, and CTV. Some estimates lean on broader "internet advertising" definitions that blend more activity types, while others build from media-spend pools but apply different channel splits and growth cases that are not always checked with market participants.
Benchmark comparison
| Source | Market Size | Gaps in Research Methodology |
|---|---|---|
| Mordor Intelligence | USD 323.74 B (2026) | |
| Industry Research Publisher A | USD 566.58 B (2026) | Uses a broader digital ad-spend scope that can pull in adjacent monetization categories and wider platform definitions, which lifts the total versus a strictly defined online advertising pool. |
| Trade Publisher B | USD 888.52 B (2026) | Reported under an internet advertising framing that can include a wider set of internet-based promotion revenues and related offerings, which inflates totals when compared with narrower paid-media counting. |
The table points to a scope-driven gap, and in Mordor Intelligence's model the value is limited to paid ads delivered on internet-connected devices and excludes production fees, influencer barter, and non-internet digital out-of-home, which pulls the 2026 total below broader spend-style figures. With the same basic inputs visible in public data and then tuned by primary checks, the result stays balanced and repeatable, and users can trace changes back to clear mix and pricing drivers.


Key Questions Answered in the Report
What is the current size of the online advertising market?
The online advertising market reached USD 323.74 billion in 2026 and is forecast to grow to USD 525.39 billion by 2031.
Which platform is expanding fastest within digital advertising?
Connected-TV is the fastest-growing platform, advancing at an 11.09% CAGR through 2031 as streaming services scale ad-supported tiers.
Why are retail media networks attracting more ad spend?
They link ad impressions to confirmed checkouts inside the same ecosystem, delivering three-to-five-times higher return on ad spend than open-web display.
How does third-party-cookie deprecation affect advertisers?
Removal of cookies in Europe cut programmatic CPMs 23% for open-web publishers, pushing advertisers toward first-party data inside walled gardens.
Which region offers the highest growth potential?
Asia Pacific leads with an 11.37% CAGR thanks to mobile-first populations, super-app ecosystems, and rising disposable incomes.
What role does AI play in digital advertising?
Generative AI automates creative production and bid optimization, lowering cost-per-acquisition by double-digit percentages in early deployments.
Page last updated on:


 Your data is secure and never sold or shared.


