
Data Center Construction Market Analysis by Mordor Intelligence
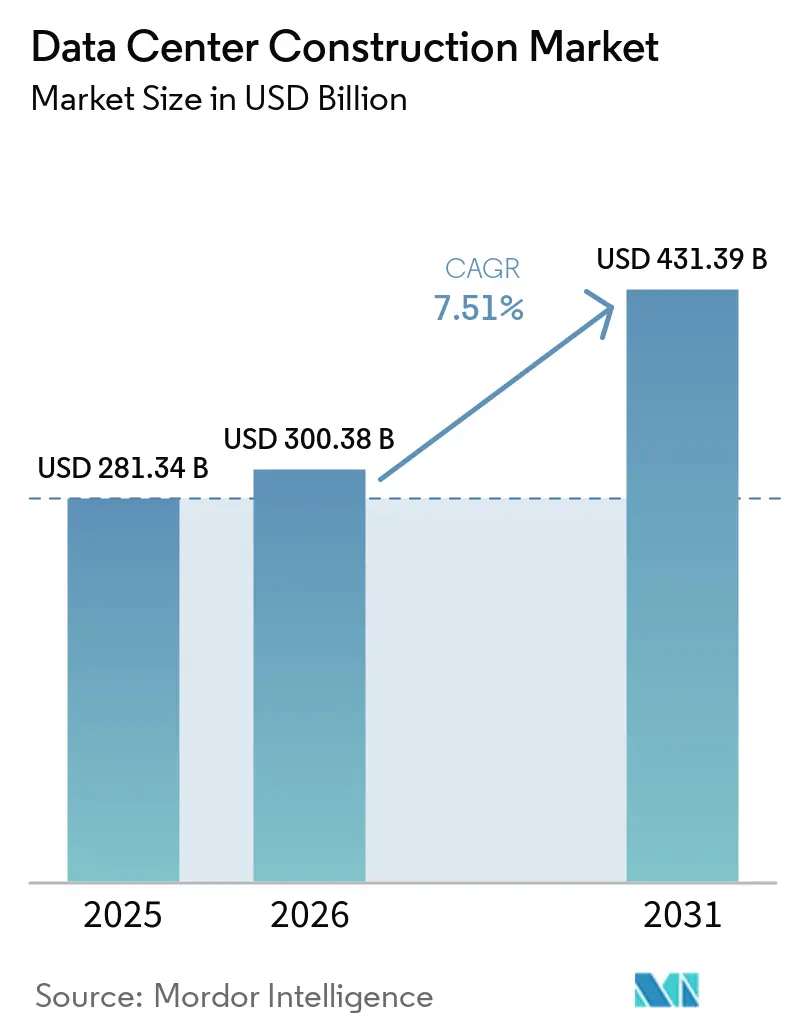
The data center construction market size is estimated at USD 300.4 billion in 2026 and is projected to be USD 322.9 billion in 2027, reaching USD 460.2 billion by 2032, growing at a CAGR of 7.34% from 2027 to 2032.
Cloud and analytics demand supports new facilities, with liquid cooling linking computing density to building design in the United States. Campus-scale commitments concentrate substantial civil, electrical, and mechanical delivery requirements at individual sites. Rising site costs and connection-linked energy requirements constrain how readily developers can translate that demand into new facilities. Developers facing higher site costs and renewable-supply conditions on grid connections are likely to favor contractors coordinating design, electrical, and cooling scopes. This shifts competition toward integrated delivery that addresses both capital exposure and the facility's energy requirements.
Key Report Takeaways
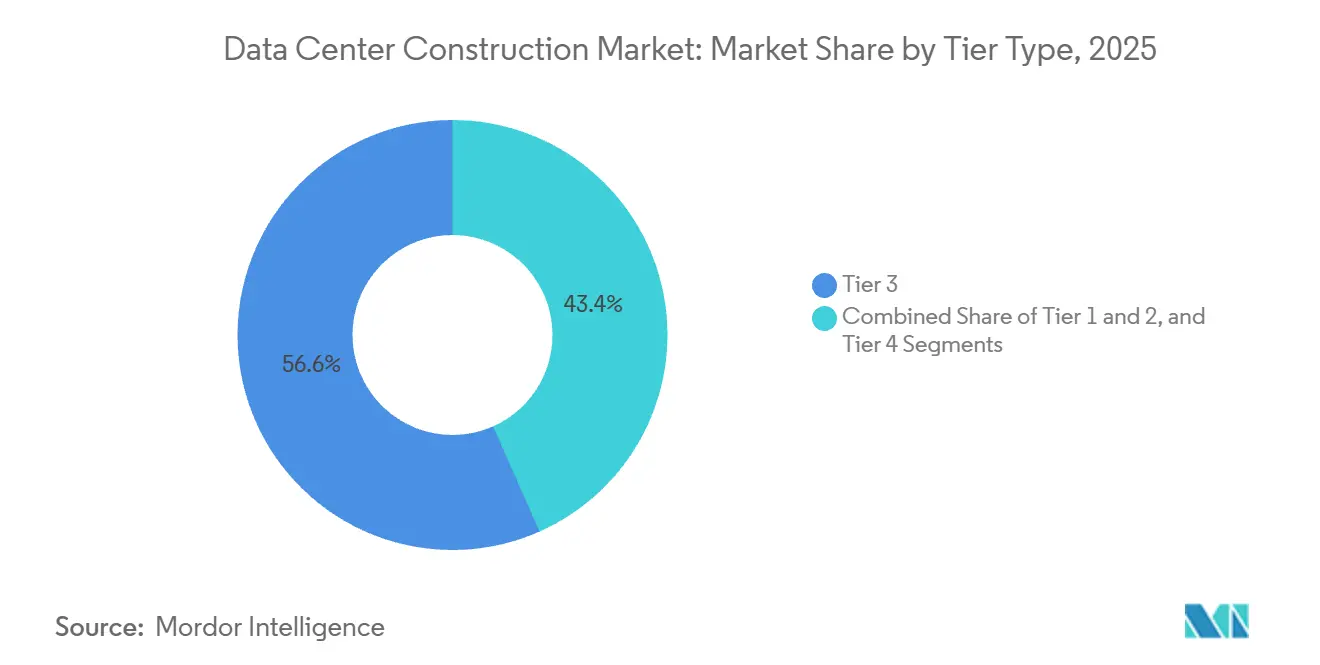
- By tier type, Tier 3 held a 56.75% data center construction market share in 2026, while Tier 4 is forecast to be the fastest-growing segment at a CAGR of 7.96% from 2027 to 2032.
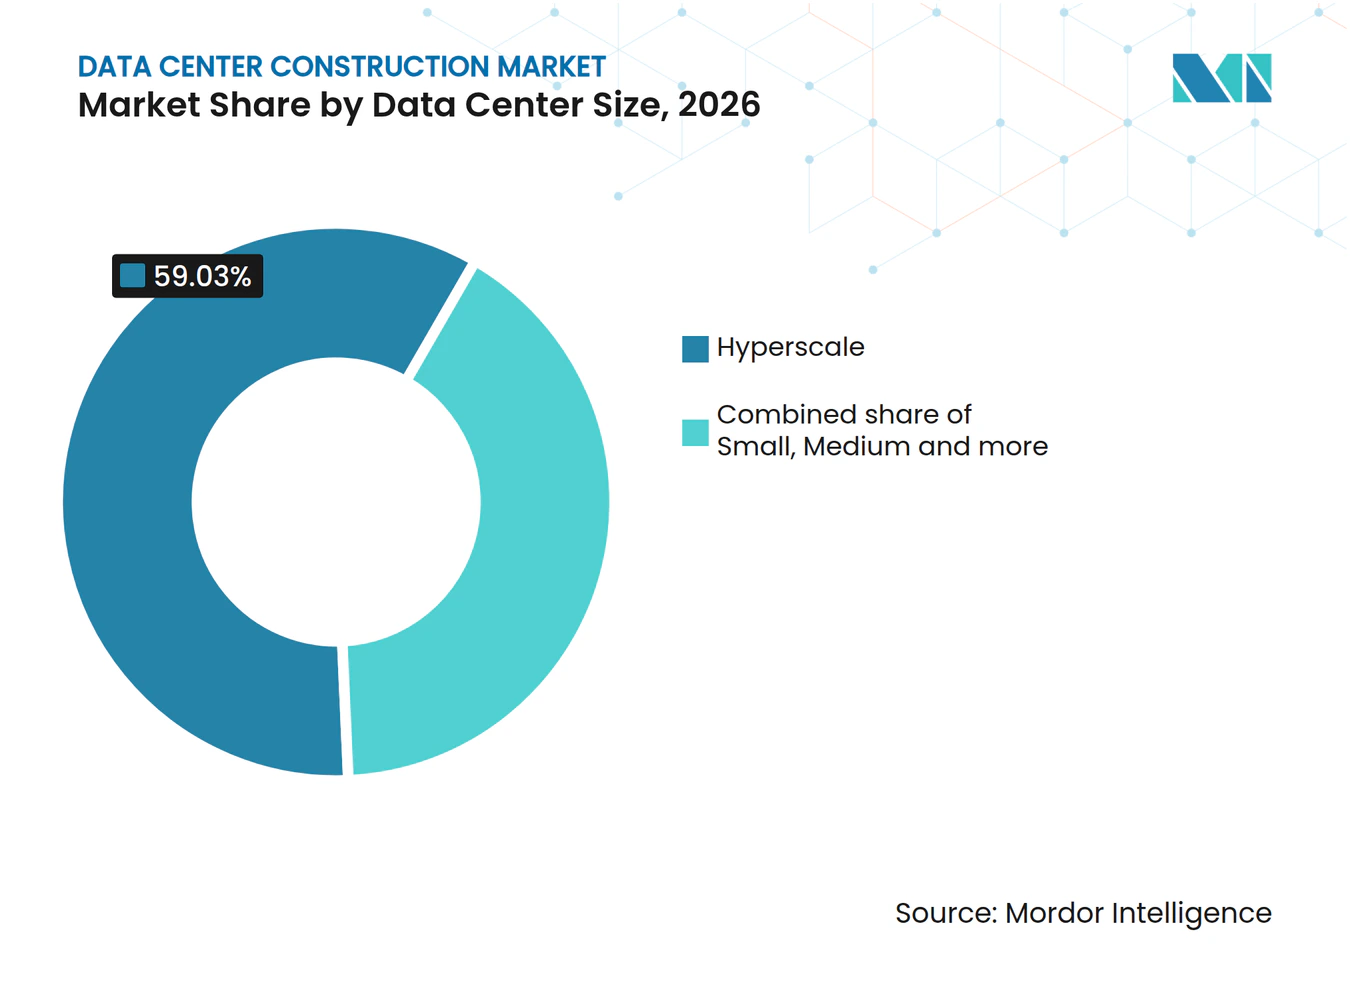
- Across data center sizes, hyperscale facilities led with a 59.03% share of the data center construction market size in 2026 and are forecast to grow fastest at a CAGR of 8.4% from 2027 to 2032.
- By data center type, colocation facilities led with 54.42% of construction spending in 2026, while hyperscalers and cloud service providers are projected to grow fastest at a CAGR of 8.9% from 2027 to 2032.
- Electrical infrastructure led the infrastructure category with 39.8% of construction spending in 2026, while mechanical infrastructure is forecast to grow fastest at a CAGR of 9.1% from 2027 to 2032.
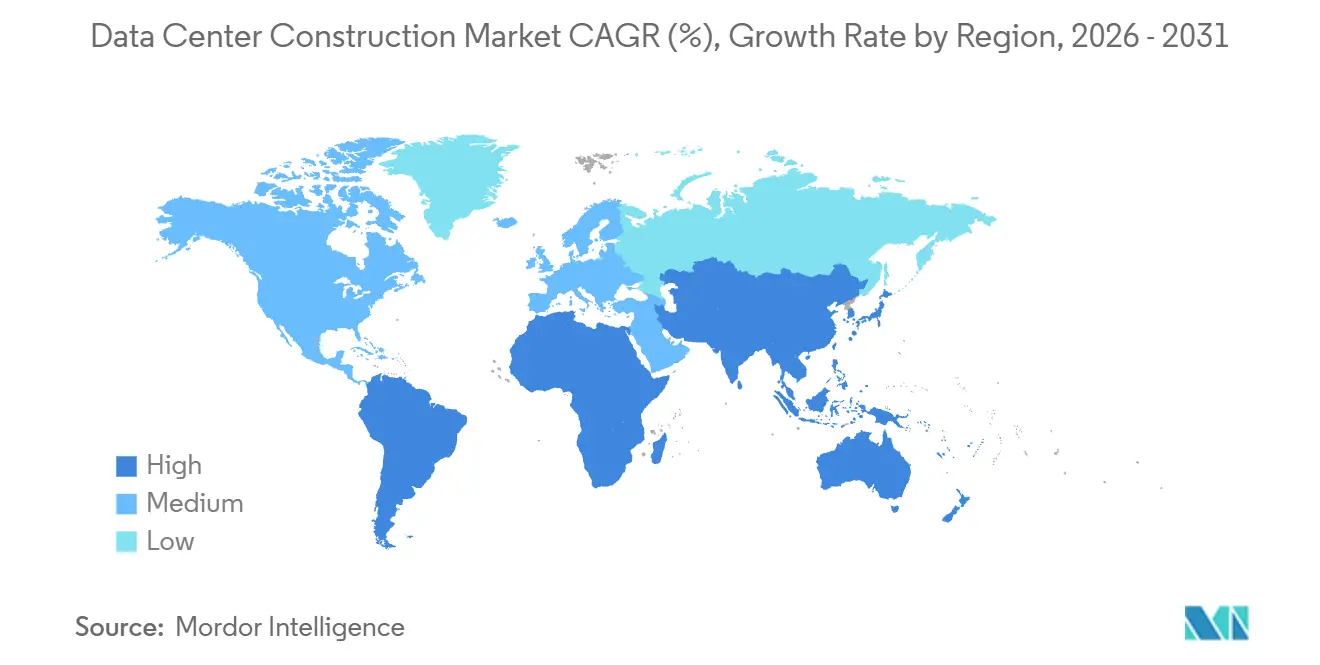
- Geographically, North America led with 39.99% of construction spending in 2026, while Asia-Pacific is projected to grow fastest at a CAGR of 9.45% from 2027 to 2032.
Note: Market numbers in this report are based on Mordor Intelligence's proprietary estimation framework, which combines nine months of actuals with Q4 projections for base year 2026.
600+
data center reports by Mordor Intelligence
covering servers, AI facilities, cooling and more - global, regional or country-level, right down to individual data center components
Market Trends and Insights
Drivers Impact Analysis of Data Center Construction Market*
| Driver | (~) % Impact on CAGR Forecast | Geographic Relevance | Impact Timeline |
|---|---|---|---|
| Growing Cloud Applications, AI and Big Data Workloads | +4% | India's cloud infrastructure regions | Short term (≤ 2 years) |
| Accelerating Adoption of Hyperscale Facilities | +3% | United States hyperscale construction sites | Medium term (2-4 years) |
| Rising Edge-Computing Build-Outs Near Population Hubs | +1.1% | United States and EU27 | Medium term (2-4 years) |
| Renewable-Energy Mandates Shaping Facility Design | +0.9% | Singapore data center sites | Medium term (2-4 years) |
| Exploration of On-Site Small Modular Reactors (SMRs) to Bypass Grid Constraints | +0.2% | Netherlands data center locations | Long term (≥ 4 years) |
| Emergence of “Powered-Land” Speculative Campuses Shortening Pre-Lease Timelines | +0.6% | United States powered-campus sites | Medium term (2-4 years) |
| Source: Mordor Intelligence | |||
Growing Cloud Applications, AI and Big Data Workloads
Capacity-constrained cloud demand gives growth in paid data services direct relevance for new facility investment. Microsoft reported that Azure and other cloud services revenue grew 43% year over year in fiscal 2026 Q4. Azure customer demand exceeded available capacity in that quarter. Microsoft also reported over 40,000 paid Fabric customers, up more than 60% year over year in fiscal 2026 Q4. For the operator, unserved Azure demand and a growing analytics customer base both translate into requirements for more facility capacity.
Accelerating Adoption of Hyperscale Facilities
Campus-scale commitments increase construction demand before their eventual computing capacity enters service. On February 11, 2026, Meta announced groundbreaking for its Lebanon, Indiana, data center, designed to deliver 1 GW once operational. The announced investment was more than USD 10 billion and covered data-center infrastructure and the surrounding community. The facility, Meta's second Indiana site, was intended to support both AI workloads and its core products. For contractors, a 1 GW design capacity at one site creates an opportunity to coordinate substantial site and facility work around a single capacity objective. A single site of this size brings civil, electrical, and mechanical packages together, making their sequencing a central construction task for whichever contractors Meta engages.
Rising Edge-Computing Build-Outs Near Population Hubs
Metropolitan AI deployments create construction opportunities that combine local service locations with specialized facility engineering. Edged opened a new data center in Aurora, Illinois, within the Chicago metro, on February 26, 2025, with the campus designed for high-density AI workloads.[1] The facility incorporated advanced waterless cooling and energy systems, giving its construction requirements a substantial technical component. The Edge Observatory for the Digital Decade estimated 451 in-country edge data centers deployed across the EU27 by the end of 2025. The Observatory defines in-country edge data centers as large-scale, regionally scalable facilities within 200 kilometers of users, delivering under 20 ms latency with 12 MW power capacity. Where demand lies beyond a single facility's 200-kilometer reach, additional local facilities can create construction work that expanding one central campus cannot supply.
Renewable-Energy Mandates Shaping Facility Design
Energy-linked capacity awards create construction demand by connecting permission to expand with the design of low-carbon supply. Singapore reported on September 10, 2026, that its second Data Centre Call for Application had provisionally awarded 200 MW of capacity.[2] More than half of that capacity would use Singapore-based low-carbon generation, including building-integrated or building-applied photovoltaics and fuels such as biomethane, ammonia, and hydrogen. Recipients must report electricity consumption and substantiate its low-carbon proportion as a condition of capacity support. For facility designers, the award links solar integration and energy measurement to a defined expansion opportunity. The commercial opening extends beyond installing generation equipment because the building and its measurement systems must support the commitments attached to capacity.
Restraints Impact Analysis of Data Center Construction Market*
| Restraint | (~) % Impact on CAGR Forecast | Geographic Relevance | Impact Timeline |
|---|---|---|---|
| Escalating Real-Estate, Installation and Maintenance Cost | -1.2% | United States and Canada | Short term (≤ 2 years) |
| Stricter Energy-Consumption and Carbon-Compliance Limits | -0.7% | Republic of Ireland | Medium term (2-4 years) |
| Shortage of Skilled Labor for Advanced Liquid Cooling | -0.4% | United States construction sites | Short term (≤ 2 years) |
| Utility “Take-or-Pay” Terms and Collateral Requirements Locking Up Capital and Deterring Mid-Tier Developers | -0.2% | AEP Ohio service territory | Medium term (2-4 years) |
| Source: Mordor Intelligence | |||
Escalating Real-Estate, Installation and Maintenance Cost
Higher site and delivery costs constrain how much capacity developers can build from a fixed capital commitment. Cushman & Wakefield reported that average construction costs per MW across the United States and Canada rose 21% between its fourth-quarter 2024 guide and its 2026 edition. Powered land in primary U.S. markets averaged USD 584,000 per MW in 2026 year to date, 51% above the prior year and 35% above its 5-year average. Together, the higher build cost and land price raise the capital exposed per unit of planned capacity, narrowing the room for construction overruns. Cushman & Wakefield also reported an average 10% year-over-year increase in Asia-Pacific data-center construction costs in 2025, extending pressure on capacity per dollar beyond North America.
Stricter Energy-Consumption and Carbon-Compliance Limits
Connection-linked energy obligations can make renewable supply a separate development dependency alongside the facility itself. Ireland's Commission for Regulation of Utilities set its policy in December 2025 for new connection applications covering new or additional capacity. Data centers with maximum import capacity of at least 1 MVA must meet at least 80% of annual demand with additional renewable electricity generated in the Republic of Ireland. The requirement includes a 6-year glide path from the demand site's energization. That transition allows time to comply, but the domestic additional-generation condition narrows the supply arrangements that can satisfy the obligation. For affected developers, securing a connection consequently carries an energy-sourcing commitment that extends beyond completing the building and increases project coordination requirements.
*Our forecasts treat driver/restraint impacts as directional, not additive. The impact forecasts reflect baseline growth, mix effects, and variable interactions.
Data Center Construction Market Segment Analysis
By Tier Type:
High-Density Delivery Gives Certification a Separate RoleTier 3 accounted for a 56.75% share of the data center construction market size in 2026, making it the largest segment by tier. Delska launched its 10 MW EU North Riga LV DC1 facility in Riga, Latvia, on April 15, 2026, for AI and high-performance computing workloads. The operating facility meets Tier III standards and is undergoing Tier III Facility certification. It supports rack densities of up to 250 kW, linking the tier proposition to concentrated computing requirements. Customers can deploy before Facility certification is completed, separating Delska's stated Tier III compliance at up to 250 kW per rack from certification of the operating facility.
Tier 4 is the fastest-growing segment by tier, with a projected CAGR of 7.96% from 2027 to 2032. Before the May 14, 2026 launch of KL1 in Petaling Jaya, Malaysia, NEXTDC reported that the facility had achieved Uptime Institute Tier IV Certification of Constructed Facility. On February 25, 2025, irix announced that its Kuching 1 DC @Santubong facility had received Uptime Institute Tier IV Certification of Constructed Facility, becoming Malaysia's first Tier IV-certified data center. SASA Data Centres was the partner responsible for design, construction, and transfer. SASA's responsibility through transfer makes the irix award a test of completed project delivery, extending beyond a partner's ability to produce a Tier IV design.


By Data Center Size:
Hyperscale Computing Raises Physical Delivery DemandsHyperscale represented a 59.03% data center construction market share in 2026 and is the largest and fastest-growing segment by facility size, with a projected CAGR of 8.4% from 2027 to 2032. In November 2025, AWS reported Project Rainier online with nearly 500,000 Trainium2 chips across multiple U.S. data centers. Anthropic used the cluster to train and run Claude. JLL projected that hyperscalers could construct 41 GW of owner-occupied data-center capacity between 2026 and 2030, doubling that segment to 70 GW. Because a cluster such as Rainier spans multiple facilities, hyperscale construction can require contractors to coordinate several large facility deliveries around a shared computing architecture.
The physical delivery requirement is visible in the labor committed to a separate hyperscale construction project. By June 25, 2026, Oracle reported nearly 20 million construction worker-hours and up to 9,000 workers onsite to date at its Abilene, Texas, data center. JLL projected that hyperscalers would allocate USD 1 trillion to data-center spending between 2024 and 2026. Accommodating that many workers at one site makes crew scheduling and site logistics a delivery constraint in its own right.
By Data Center Type:
Colocation Scale Meets Direct Cloud ExpansionColocation data centers were the largest segment by facility type, accounting for 54.42% of construction spending in 2026. Equinix Inc. reported USD 3.5 billion in global colocation service revenue in the first half of 2026, compared with USD 3.13 billion in the first half of 2025. In June 2026, DataBank special purpose vehicles obtained USD 650 million in incremental project financing for construction of a fourth 60 MW data center in Red Oak, Texas. Equinix's revenue shows the operating scale of colocation, but construction work reaches contractors through project-level capital such as DataBank's financing for an individual building.
Hyperscalers and cloud service providers are the fastest-growing segment by facility type, with a projected CAGR of 8.9% from 2027 to 2032. Microsoft added 1 GW of capacity in its fiscal 2026 fourth quarter. On April 28, 2026, Google broke ground on its AI hub in Visakhapatnam, Andhra Pradesh, with AdaniConneX and Nxtra by Airtel as partners. The hub includes data-center campuses and broader infrastructure, connecting new facility work with the cloud provider's wider AI deployment. Capacity additions show operating expansion, while the hub's groundbreaking identifies a specific route into new construction for contractors delivering campuses and their associated facility infrastructure.
By Infrastructure:
Electrical Delivery Leads While Cooling Shapes GrowthElectrical infrastructure was the largest segment, accounting for 39.8% of construction spending in 2026. Cushman & Wakefield's 2026 guide identified power infrastructure as the largest all-in greenfield development cost category in the United States and Canada, excluding chips and GPUs. The guide also linked contingencies to long material lead times, labor shortages, and regulatory uncertainty. For facility developers, substantial power-related spending makes electrical delivery an important part of the work that must be organized before computing loads can be served.
Mechanical infrastructure is the fastest-growing segment, with a projected CAGR of 9.1% from 2027 to 2032. Microsoft reported construction completion at its Fairwater facility in Mount Pleasant, Wisconsin, in June 2026, following equipment startup in April. The completed facility was operating with liquid-cooling infrastructure built directly into its purpose-built AI design to support higher rack density. Embedding that infrastructure in the facility places thermal architecture within the initial construction scope and connects it to computing density. Delivering cooling as an integrated part of the building gives mechanical contractors a construction role whose requirements are established alongside the facility's intended computing configuration.
Geography Analysis
North America Data Center Construction Market
North America accounted for a 39.99% share of the data center construction market size in 2026. JLL's Midyear 2026 report identified more than 66 GW of capacity under construction across the region, showing the scale of work already in physical delivery. Frontier markets accounted for 77% of that under-construction capacity, with West Texas, Ohio, Louisiana, Indiana, and the Carolinas among the named locations. Winning work in frontier locations such as West Texas and Ohio requires contractors to extend crew deployment and supply arrangements beyond established hubs.
Asia-Pacific Data Center Construction Market
Asia-Pacific is the fastest-growing geography, with a projected CAGR of 9.45% from 2027 to 2032. Cushman & Wakefield reported 4,764 MW under construction and 21,691 MW in planning across the region in the first half of 2026. Colocation vacancy fell from 10.9% in the second half of 2025 to 10.3% in the first half of 2026 despite substantial new supply. In March 2026, UOB Thailand and 5 partner banks provided long-term green financing to DayOne Data Centers for the first greenfield phase at Chonburi Tech Park in Amata City Chonburi. Capacity absorption and a financed local construction phase together give contractors regional demand context and a concrete development mechanism in Thailand, linking expansion to both service use and project funding.
South America's connectivity-led expansion includes Peru, where Cirion Technologies now offers LIM2 capacity at Macropolis, Lurín, after describing the 20 MW facility as nearing completion in June 2025. The facility was designed to connect Peruvian businesses with hyperscalers such as Amazon and Google. In Europe, Verne marked construction start on the first 70 MW of its Mäntsälä, Finland, campus on June 17, 2026, targeting hyperscalers, neoclouds, and enterprise AI and high-performance computing workloads. In the Middle East and Africa, the Saudi Data and Artificial Intelligence Authority laid the foundation stone for Riyadh's 480 MW Hexagon government data center in January 2026. The jump from a local cloud-connectivity facility to a much larger government campus changes the scale of construction responsibility a contractor must be able to assume.
Regulatory Framework and Outlook
Selected jurisdictions are compared from the perspective of developers building new data centers. Ohio's utility tariff sets service-related contract terms, while China's action plan and Brazil's tax regime affect facility location and project economics. The United Kingdom comparison covers England's building framework and its adopted transition for new non-domestic buildings. These instruments connect project commitments with energy performance, construction timing, and the conditions attached to policy incentives.
Regulatory Table of Data Center Construction Market
| Decision factor | United States | Brazil | United Kingdom | China |
|---|---|---|---|---|
| Primary authority | Public Utilities Commission of Ohio; Ohio Power Company administers the tariff | Federal Revenue Secretariat within the Ministry of Finance | Ministry of Housing, Communities & Local Government for England's building framework | National Development and Reform Commission and partner implementing agencies |
| Key instruments or direction | Schedule DCT for monthly maximum single-site demand or aggregated contract capacity above 25,000 kW in Ohio Power's territory | Law 15.504 created Redata in September 2026, effective on publication | Building Regulations 2010 and Approved Document L; adopted 2026 amendments for 2027 commencement under project-transition rules | 2024 data-center action plan with efficiency objectives through 2030 |
| Commercial effect | New-load minimum term of load-ramp period plus 8 years; customers may petition PUCO for adjustment if infrastructure is not ready by the estimated in-service date | Tax-incentive eligibility requires statutory energy, water-efficiency and R&D commitments and regulatory procedures | Adopted energy-efficiency and low-carbon heating requirements for new non-domestic buildings from 2027, subject to project transitions | Priority hub-cluster siting for new large and extra-large centers; project energy reviews |
| Current policy attractiveness | Low | Medium | Medium | Medium |
| Future direction of policy attractiveness | No change | Easing | Hardening | No change |
| Source: Mordor Intelligence | ||||
Ohio's long new-load commitments limit flexibility, while interim procedures that apply until otherwise ordered by its regulator establish a continuing contractual framework. Brazil's September 2026 tax incentive opens a conditional route to improved project economics, with eligibility procedures and compliance details governed by regulation. Under England's 2027 efficiency and low-carbon heating standards, transition protection may apply to non-higher-risk work with specified notices or full-plans applications before March 24, 2027, and work starting before March 24, 2028. China's hub-siting priorities and energy reviews shape location decisions within a continuing policy path toward its 2030 efficiency objectives.
Value Chain Stages
The value chain compares embedded design services, general construction, and mechanical and electrical fit-out in the order facilities are delivered. JLL reported that 57% of the data-center projects covered in its outlook experienced construction delays of at least 3 months in 2025. That delivery exposure makes coordination across stages commercially important because completing one package does not make the facility ready for the next. Design and management providers can capture fees by resolving handovers between construction stages.
Value Chain Analysis Table of Data Center Construction Market
| Primary activity | Key participants | Value capture | Bottleneck | Resilience response |
|---|---|---|---|---|
| Design and delivery planning | Design and construction management providers such as AECOM; EPCM providers such as Jacobs Solutions Inc. | Design and project management fees | Unresolved interfaces between engineering and procurement | Assign package specifications and procurement responsibilities before ordering |
| Site and building construction | General contractors such as DPR Construction and Collen Construction Ltd. | Civil and building construction contract revenue | Sequencing building work with specialist access | Phase handovers around agreed specialist installation dates |
| Mechanical and electrical fit-out | Mechanical and electrical contractors such as Kirby Group Engineering and EMCOR Group companies | Installation and integration contract revenue | Equipment lead times constrain installation sequencing | Reserve critical components against the installation sequence |
| Source: Mordor Intelligence | ||||
JLL reported average data-center equipment lead times of 33 weeks in 2026, 50% above pre-2020 levels, attributing the increase to rapid sector expansion. Its 2026 outlook also reported that developers and operators at scale held 6 to 12 months of strategic inventory for critical components. That response moves part of delivery resilience upstream, before the installation team reaches the site. Because developers and operators at scale hold that inventory, their procurement timing can govern when installation contractors receive components, perform fit-out work, and earn the associated contract revenue.
Competitive Landscape
Market Concentration
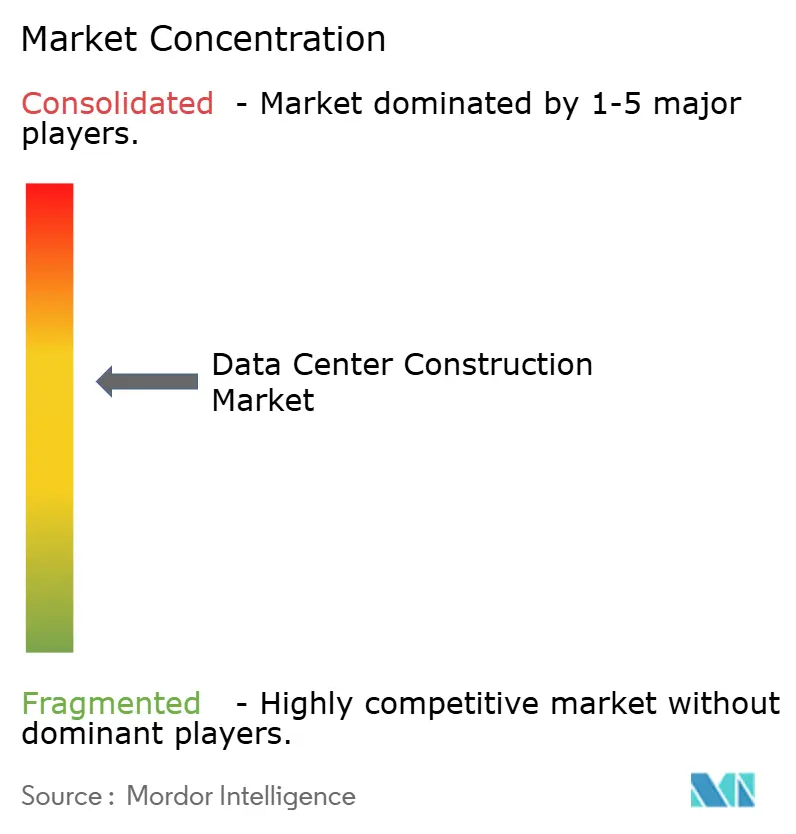
Competition combines engineering specialists and construction contractors, with leadership distributed across distinct project roles and commercial relationships rather than concentrated in a single delivery model. The five leading companies are AECOM, Turner Construction Co., DPR Construction, Jacobs Solutions Inc., and Skanska AB. Turner reported that data centers represented approximately 37% of its own company-wide project backlog in 2025. That backlog composition made data centers a substantial part of Turner's contracted future workload in 2025, complementing the field's distinct design and management roles.
Engineering-led competition centers on how much of the interface between design, procurement, and construction a provider is appointed to coordinate. In December 2025, Nostrum Data Centers, an affiliate of Nostrum Group, selected AECOM to lead design and construction management for its Badajoz facility in Spain. In January 2026, Hut 8 selected Jacobs Solutions Inc. to provide engineering, procurement, and construction management services for the River Bend data center in Louisiana.[3] These appointments place several connected project functions within a named provider's scope. Jacobs' procurement remit distinguishes its appointment from AECOM's design and construction management mandate, so buyers can choose how much supply-side coordination to hand to one provider.
Competitive positioning spans both engineering coordination and contracts to build facilities. On December 4, 2025, Skanska AB signed a contract with a repeat client to build a data center in the United States. The contract was worth USD 263 million. DPR Construction included El Segundo Data Center for customer Digital Realty Trust Inc. in its sample of projects awarded in the first half of 2025. These awards place construction responsibility with Skanska and DPR, so engineering breadth alone would not demonstrate an equivalent delivery scope for a challenger.
Data Center Construction Industry Leaders
-
AECOM
-
Turner Construction Co.
-
DPR Construction
-
Jacobs Solutions Inc.
-
Skanska AB
- *Disclaimer: Major Players sorted in no particular order
Data Center Construction Market Companies Covered in this Report
- AECOM
- Turner Construction Co.
- DPR Construction
- Jacobs Solutions Inc.
- Skanska AB
- Balfour Beatty plc
- Whiting-Turner Contracting Co.
- Hensel Phelps
- Fortis Construction Inc.
- Goodman Group
- PT Jaya Obayashi
- Hibiya Engineering Ltd.
- Fluor Corporation
- Keppel Data Centres Holding
- NTT Global Data Centers
- Equinix Inc.
- Digital Realty Trust Inc.
- QTS Realty Trust LLC
- China State Construction Engineering Corp.
- Larsen and Toubro Ltd.
- Bouygues Construction SA
- Vinci Energies
- Samsung C&T Corporation
- Collen Construction Ltd.
- Corgan
- Mortenson Construction
Key Opportunities for Market Participants
The comparison identifies prospective construction and embedded design opportunities associated with European deployment policy and Canada's electricity-allocation pipeline. The European Commission's 2026 proposed Cloud and AI Development Act aims to at least triple EU data-center capacity within 5 to 7 years and simplify permitting and deployment. BC Hydro received 15 applications requesting close to 800 MW in its 2026 AI and data-center allocation process. Intake is closed, advancing applicants have been notified, and applications remain under review, with further notifications expected after the government transition following an election-related extension.
Market Opportunities Table of Data Center Construction Market
| Opportunity | Why now | Buyer / lead segment | Recommended play | Main barrier | Likely beneficiaries |
|---|---|---|---|---|---|
| Permit-ready European facility design | Proposed capacity expansion places permitting and deployment in focus | EU data-center developers | Package site design and embedded construction planning for permit-stage decisions | Permitting complexity and access to land | Design and construction management providers |
| Resource-integrated greenfield engineering | The EU proposal identifies energy and water access as deployment priorities | Developers of resource-constrained EU campuses | Coordinate facility energy and water requirements before committing civil packages | Availability of energy and water at the site | Mechanical and electrical engineering contractors |
| Conditional delivery planning for Canadian applicants | Existing British Columbia applications are progressing through allocation review | AI and data-center applicants in British Columbia | Offer staged embedded design services tied to allocation milestones | Allocation timing depends on the ongoing application review | Local design firms and greenfield construction contractors |
| Source: Mordor Intelligence | |||||
The central opening is to reduce the gap between a prospective site's resource requirements and a construction package that can be delivered. Embedded design services can address this before the developer commits to the full building scope. In British Columbia, staging that work around allocation decisions would limit the amount of construction preparation exposed to an unresolved electricity request.
Recent Industry Developments in Data Center Construction Market
- Sep 2026: Brazil enacted Law 15.504, creating Redata for qualifying data-center installation projects with statutory commitments and eligibility granted by the Federal Revenue Secretariat under regulation.
- Sep 2026: Singapore provisionally awarded 200 MW of data center capacity under its second Data Centre Call for Application, with more than half to be powered by Singapore-based low-carbon generation.
- Jun 2026: Microsoft reported construction completion at its Fairwater facility in Mount Pleasant, Wisconsin, following equipment startup in April. The facility was operating with liquid cooling integrated into its purpose-built AI design.
Data Center Construction Market Report Scope and Research Methodology
Market Definition and Coverage
The data center construction market measures annual spending on greenfield construction of data center facilities worldwide. It covers project costs for civil works, electrical and mechanical fit-outs, and services embedded in delivering those facilities.
Scope exclusions: IT equipment procurement, retrofits and cosmetic upgrades of existing data centers, ongoing facility maintenance, and separately sold power-generation and utility-grid assets are excluded.
Segments Covered in This Report
- By Tier Type
- Tier 1 and 2
- Tier 3
- Tier 4
- By Data Center Size
- Small
- Medium
- Large
- Hyperscale
- By Data Center Type
- Colocation Data Center
- Hyperscalers/Cloud Service Provider (CSPs)
- Enterprise and Edge Data Center
- By Infrastructure
- Electrical Infrastructure
- Power Distribution Solution
- Power Backup Solutions
- Mechanical Infrastructure
- Cooling Systems
- Racks and Cabinets
- Servers and Storage
- Other Mechanical Infrastructure
- General Construction
- Services - Design and Consulting, Integration, Support and Maintenance
- Electrical Infrastructure
- By Geography
- North America
- United States
- Canada
- Mexico
- South America
- Brazil
- Argentina
- Rest of South America
- Europe
- Germany
- United Kingdom
- France
- Italy
- Spain
- Rest of Europe
- Asia-Pacific
- China
- Japan
- India
- South Korea
- Australia and New Zealand
- Rest of Asia-Pacific
- Middle East and Africa
- Middle East
- Gulf Cooperation Countries
- Turkey
- Israel
- Rest of Middle East
- Africa
- South Africa
- Egypt
- Nigeria
- Rest of Africa
- Middle East
- North America
Data Sources, Market Sizing, and Validation
Desk Research
The U.S. Census Bureau's construction value-in-place definitions help distinguish installed construction work from separately procured equipment, while its U.S. series provides a domestic spending signal. JLL's 2026 Global Data Center Outlook supplies global cost-per-megawatt and capacity-pipeline indicators, and Lawrence Berkeley National Laboratory's 2025 U.S. energy-use update informs demand and load-growth scenarios. Uptime Institute's 2026 Global Data Center Survey offers operator evidence on cost pressures, power availability, supply constraints, and facility trends, as examples of relevant public sources.
Public company filings, investor materials, project announcements, planning records, and reputable trade reporting provide further checks on project timing, capacity, contract scope, and disclosed capital plans. These named sources are not exhaustive, and further sources inform collection, validation, and clarification.
Primary Interviews and Surveys
Structured interviews and surveys would cover data center developers and operators, general contractors, electrical and mechanical contractors, engineering consultants, and project-service providers across APAC, EMEA, and the Americas. Questions would test the secondary evidence on greenfield project timing, construction package values, cost per megawatt, category shares, and regional delivery constraints. When public evidence is sparse, analyst follow-up would clarify definitions and timing, then triangulate the response against project records, company disclosures, and independent market indicators.
Distribution of primary research fieldwork respondents
| Company type | Respondent position | Region |
|---|---|---|
| Top tier: 30% | CXOs: 20% | APAC: 38% |
| Mid tier: 45% | Functional/Unit leaders: 35% | EMEA: 27% |
| Smaller Players: 25% | Managers: 45% | Americas: 35% |
Market-Sizing & Forecasting
The top-down model estimates worldwide annual greenfield facility-construction spending, then checks the total against selective project-level roll-ups. Core indicators include data center capacity under construction and entering service, construction cost per megawatt, announced project timing, and regional power and permitting conditions. Together they indicate the amount and timing of work likely to be performed. Project evidence and disclosed spending support shares by tier, facility size and type, infrastructure package, and geography, with each project counted once and embedded services assigned to the package that delivers them.
Scenario analysis carries the capacity pipeline and cost-per-megawatt assumptions through the forecast, with high, central, and constrained build schedules reflecting delays, connection limits, and equipment availability. Selective bottom-up checks multiply sampled in-scope capacity by sourced construction costs and compare supplier or contractor disclosures with the top-down totals. Unmatched project costs are left out rather than filled with an assumed package value. Primary respondents would be asked to test the direction and timing of these variable-level assumptions, while conflicting or missing inputs would be revisited against independent project and cost evidence before adjustment.
Data Validation & Update Cycle
Analysts triangulate project pipelines, construction cost indicators, company disclosures, and regional capacity data, then investigate anomalies such as abrupt changes in cost per megawatt, project timing, or segment shares. A second review checks source dates, market boundaries, arithmetic, duplicate projects, and whether each regional and segment estimate reconciles with the global total. Analysts seek clarification when evidence conflicts or a material input changes. The model is refreshed annually, updated between cycles after material project, cost, power, or policy events, and given a fresh source and calculation review before delivery.
Mordor Intelligence's Data Center Construction Market Size Measured Against Other Published Estimates
Published estimates can differ in the transactions and products they count and the inputs used to model demand. The data center construction market measures annual spending on greenfield construction of data center facilities worldwide.
Key Gap Drivers include the study's defined coverage and market-specific modeling choices. Core indicators include data center capacity under construction and entering service, construction cost per megawatt, announced project timing, and regional power and permitting conditions.
Benchmark comparison
| Source | Market Size | Gaps in Research Methodology |
|---|---|---|
| Mordor Intelligence | USD 322.9 B (2027) | |
| Global Market Research Firm A | USD 288.34 B (2025) | At its 2025 base, this estimate is 10.7% below this report's 2027 value of USD 322.9 B, 2 years later. The source reports a 2025 base, two years before this report's 2027 measurement year. |
| Global Market Research Publisher B | USD 144 B (2025) | At its 2025 base, this estimate is 55.4% below this report's 2027 value of USD 322.9 B, 2 years later. Its base year is 2025, two years before this report's 2027 spending measure. |
Mordor Intelligence's analysts triangulate project pipelines, construction cost indicators, company disclosures, and regional capacity data, then investigate anomalies such as abrupt changes in cost per megawatt, project timing, or segment shares.
Key Questions Answered in the Report
What is the data center construction market size and growth outlook?
The market is projected at USD 322.9 billion in 2027 and USD 460.2 billion by 2032, with a CAGR of 7.34% from 2027 to 2032.
What drives demand for new data-center facilities?
Cloud and analytics workloads support new facility demand. Microsoft reported 43% year-over-year growth in Azure and other cloud services revenue in fiscal 2026 Q4.
Which facility type leads data-center construction spending?
Colocation data centers led with 54.42% of construction spending in 2026. Hyperscalers and cloud service providers are forecast to grow fastest at a CAGR of 8.9% from 2027 to 2032.
Which companies compete in data-center construction?
Major participants include AECOM, Turner Construction Co., DPR Construction, Jacobs Solutions Inc., and Skanska AB.
What constrains the outlook for new data-center construction?
Higher site and construction costs constrain development. Average construction costs per MW across the United States and Canada rose 21% between Cushman & Wakefield's fourth-quarter 2024 guide and its 2026 edition.
Which regions lead and grow fastest in data-center construction?
North America held 39.99% of construction spending in 2026, while Asia-Pacific is forecast to grow fastest at a CAGR of 9.45% from 2027 to 2032.
More reports on data centers
- Data Center Server Market Servers across the global market, covering tier, facility size and facility type.
- Artificial Intelligence (AI) Data Center Market AI facilities across all regions, split by facility type, component and tier.
- Data Center Cooling Market Cooling across all regions, split by cooling technology, cooling component and facility type.
- North America Hyperscale Data Center Market North America hyperscale sites, split by facility type, component and tier.
- India Artificial Intelligence (AI) Optimised Data Center Market AI facilities demand across India, covering facility type, component and tier.
- Hyperscale Data Center Market Hyperscale sites worldwide, split by component and tier.
- Singapore Artificial Intelligence (AI) Data Center Market AI facilities in Singapore, split by facility type, component and tier.
- India Data Center Cooling Market India's cooling, split by facility type, tier and cooling technology.