PET Bottles Market Size and Share
Market Overview
| Study Period | 2020 - 2031 |
|---|---|
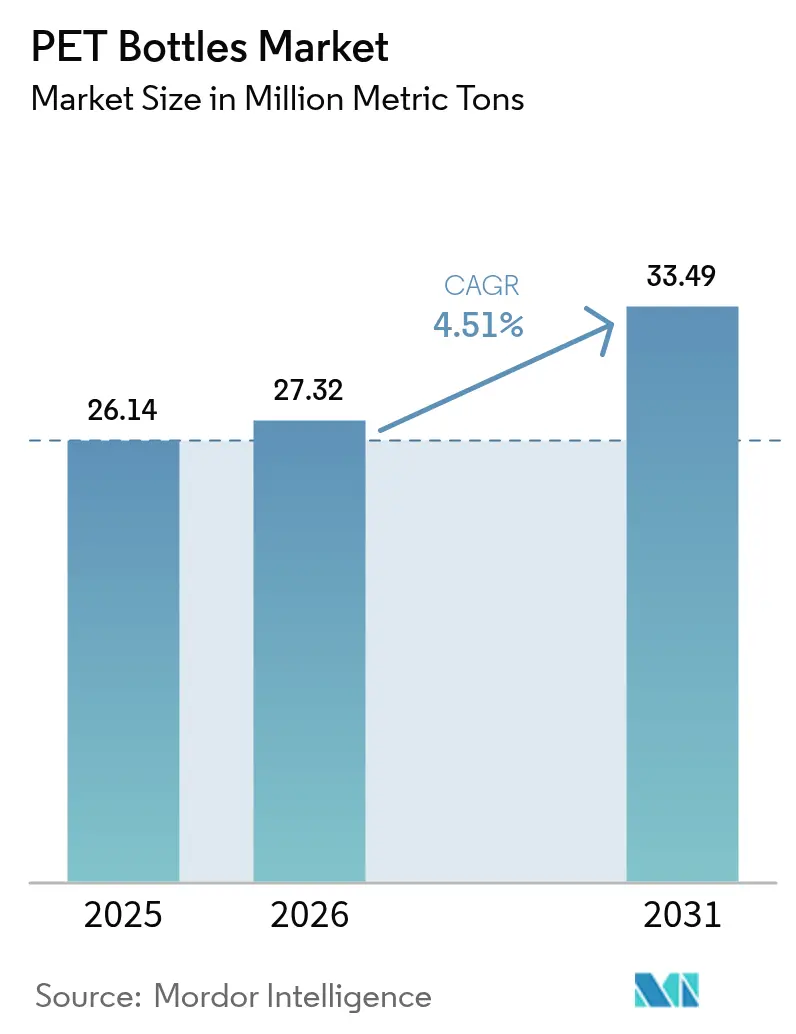
| Market Volume (2026) | 27.32 Million metric tons |
| Market Volume (2031) | 33.49 Million metric tons |
| Growth Rate (2026 - 2031) | 4.51% CAGR |
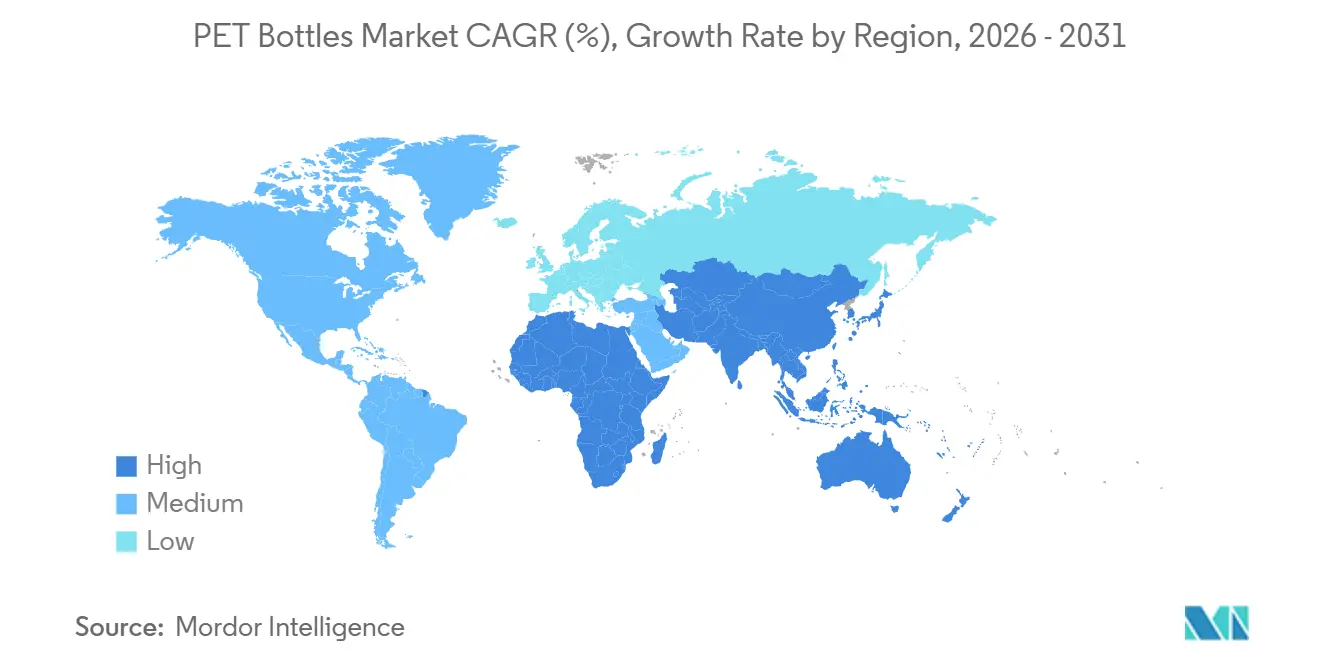
| Fastest Growing Market | Africa |
| Largest Market | Asia Pacific |
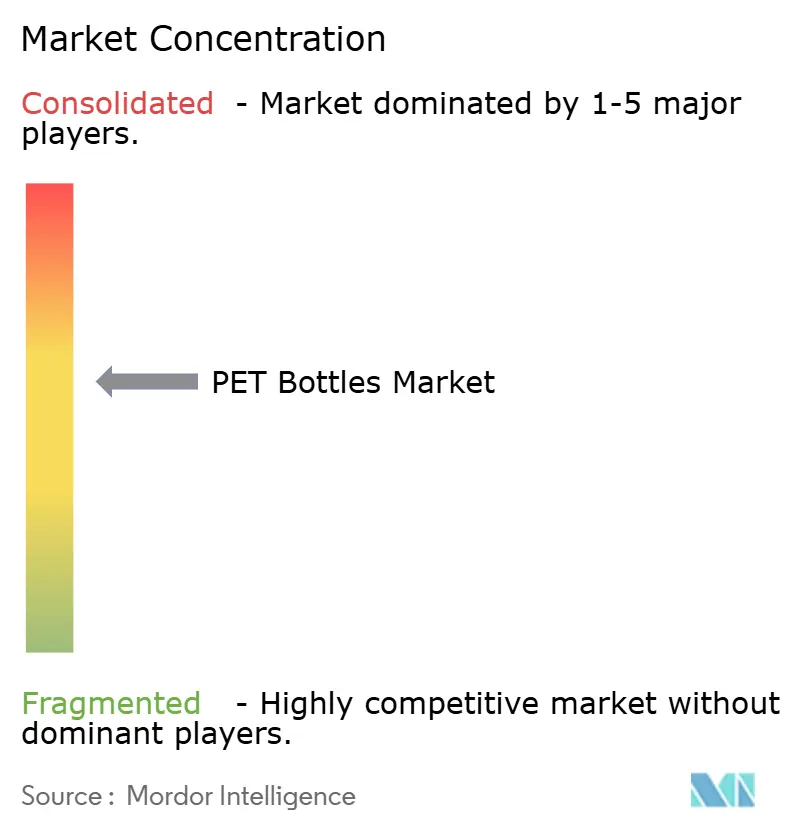
| Market Concentration | Medium |
Major Players
*Disclaimer: Major Players sorted in no particular order Image © Mordor Intelligence. Reuse requires attribution under CC BY 4.0. |
|
PET Bottles Market Analysis by Mordor Intelligence
The pet bottles market size reached 26.14 million metric tons in 2025, is expected to increase to 27.32 million metric tons in 2026 and reach 33.49 million metric tons by 2031, growing at a CAGR of 4.51% from 2026 to 2031. Demand progression reflects three structural forces: first, brand‐led lightweighting that lowers cost per fill while cutting greenhouse-gas emissions, second, region-wide mandates that make recycled content commercially indispensable, and third, digital watermarking that lifts food-grade rPET yield and secures compliant supply. Beverage lines remain the backbone of the pet bottles market, yet pharmaceuticals and personal care deliver outsized growth because shatter resistance, clarity, and FDA compliance help PET displace glass. Competitive tension from aluminum and glass is gathering pace in premium water and energy drinks, still PET keeps its cost advantage in high-volume packaged water and carbonated soft drinks. Geographically, Asia-Pacific supplies scale and price competitiveness, North America and Europe anchor regulatory innovation, and Africa emerges as the fastest-growing demand center as urbanization broadens cold-chain access.
Key Report Takeaways
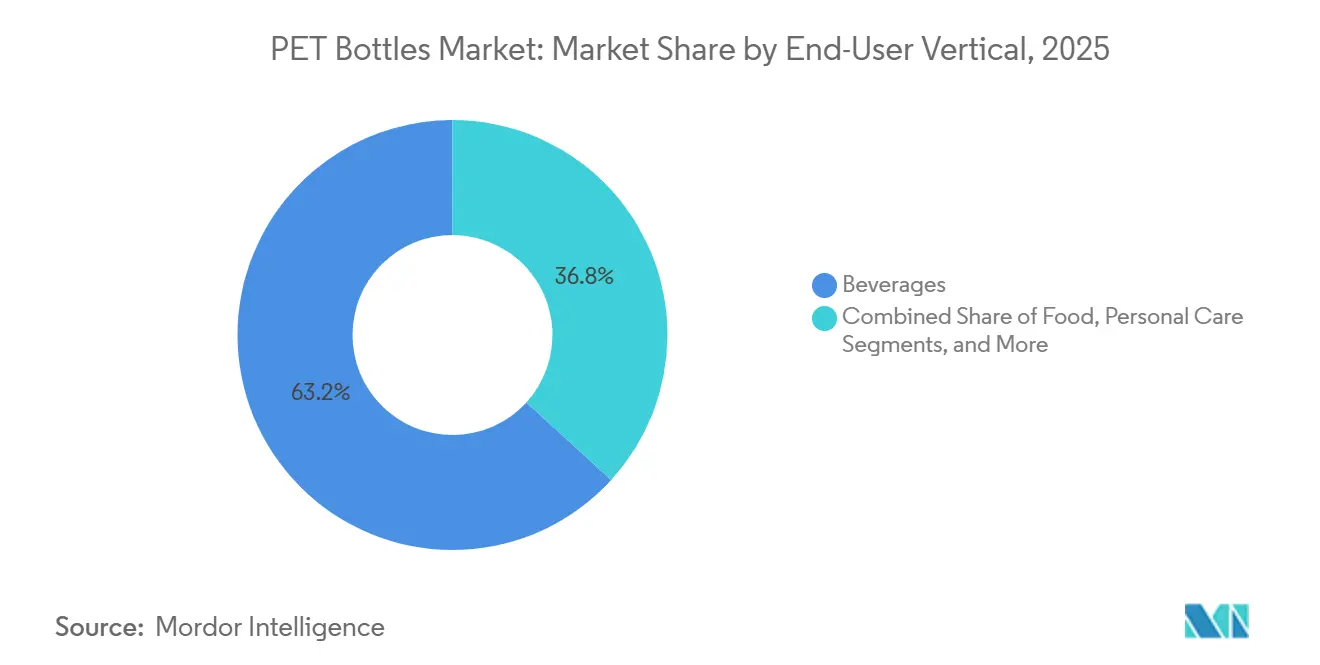
- By end-user vertical, beverages controlled 63.23% of the pet bottles market share in 2025, while pharmaceuticals registered the quickest expansion with a 5.34% CAGR to 2031.
- By technology, stretch blow molding captured 78.12% of the 2025 pet bottles market size, whereas thermoforming is projected to post a 4.71% CAGR between 2026 and 2031.
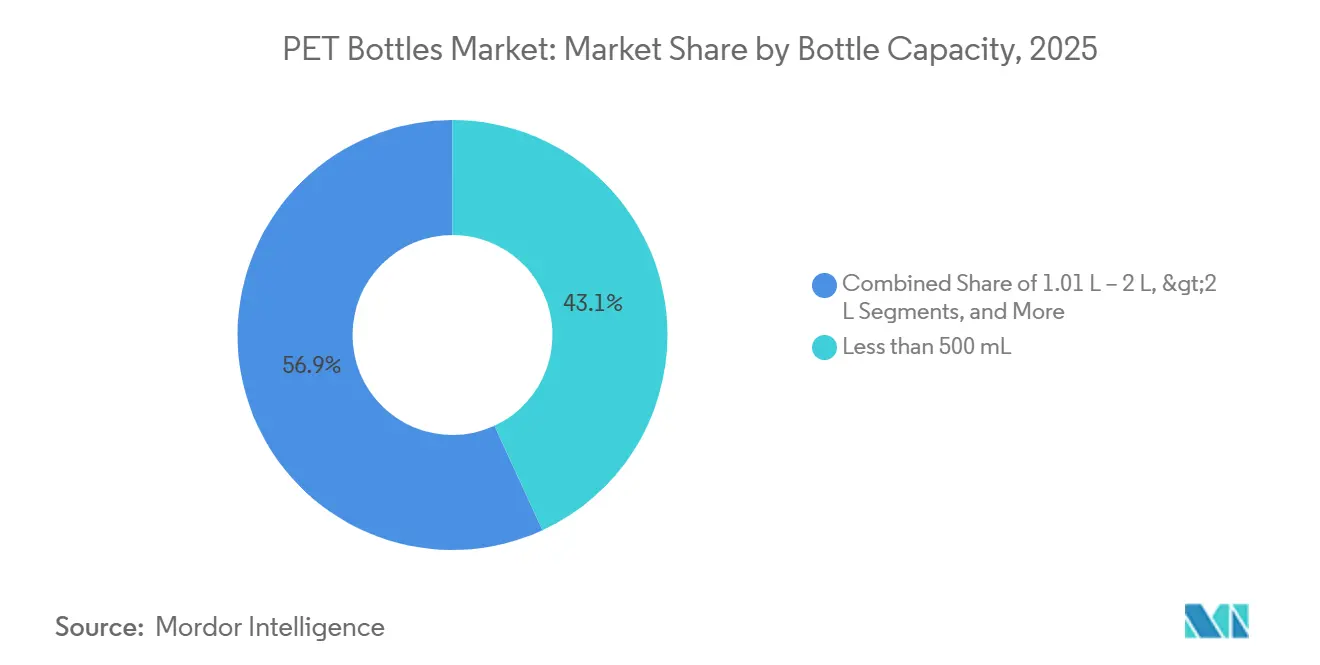
- By bottle capacity, formats below 500 mL dominated with 43.12% volume in 2025, but containers above 2 liters are forecast to rise at a 4.83% CAGR through 2031.
- By resin type, virgin PET held 72.34% of 2025 demand, yet recycled PET is on course for a 4.41% CAGR, narrowing the differential in regions with deposit return schemes.
- By geography, Asia-Pacific led with 39.21% share in 2025, while Africa is set for the fastest trajectory, advancing at a 5.12% CAGR through 2031.
Note: Market size and forecast figures in this report are generated using Mordor Intelligence’s proprietary estimation framework, updated with the latest available data and insights as of 2026.
Global PET Bottles Market Trends and Insights
Drivers Impact Analysis*
| Driver | ( ~ ) % Impact on CAGR Forecast | Geographic Relevance | Impact Timeline |
|---|---|---|---|
| Increasing Adoption of Lightweight Packaging | +1.2% | Global, strongest in North America and Europe | Medium term (2-4 years) |
| Surging Bottled Water Consumption Worldwide | +1.5% | Asia-Pacific core, spillover to Middle East and Africa | Short term (≤ 2 years) |
| Policy-Led Push for Closed-Loop Recycling Infrastructure | +0.9% | Europe and North America, expanding into Asia-Pacific | Long term (≥ 4 years) |
| HolyGrail 2.0 Digital Watermarking Boosting Food-Grade Sorting Yield | +0.4% | Europe, pilots in North America | Medium term (2-4 years) |
| Deployment of AI-Driven Hot-Fill Barrier Additives for rPET Premium Drinks | +0.3% | North America and Europe | Medium term (2-4 years) |
| On-Site Bottle-to-Bottle Micro-Recycling Units at Beverage Filling Plants | +0.2% | Global, early adoption in Europe and Asia-Pacific | Long term (≥ 4 years) |
| Source: Mordor Intelligence | |||
Increasing Adoption of Lightweight Packaging
Design revision has become a permanent lever because every gram eliminated reduces resin input, freight emissions, and extended producer responsibility fees. New preform geometries distribute stress uniformly, letting bottles withstand top-load forces even after a 15% material cut. Equipment suppliers offer blow-assist algorithms that map wall thickness in real time, preventing panel collapse during hot-fill. Lightweight solutions now incorporate up to 25% rPET without hazing, easing compliance with recycled-content quotas. As retailers introduce eco-modulated fees tied directly to weight, converters see immediate payback, making lightweighting a core pillar of investment road maps. The pet bottles market therefore embeds sustainability and cost savings in a single initiative, accelerating adoption across beverages, personal care, and household cleaners.[1]KHS GmbH, "Factor 101 Preform Achieves 5.89 Grams for 591 mL Bottle," khs.com
Surging Bottled Water Consumption Worldwide
Packaged hydration continues to outpace soft drinks as consumers associate bottled water with wellness, convenience, and flavor neutrality. India, China, and Indonesia are logging double-digit unit growth because urban households distrust tap quality and seek portable formats during lengthy commutes. The United States added 16.4 billion gallons in 2024, keeping single-serve PET at roughly 70% of category volume.[2]Beverage Marketing Corporation, "U.S. Bottled Water Market Grows 2.9% in 2024," beveragemarketing.com Middle East tourism and an arid climate produce year-round demand spikes that reinforce capacity expansion plans. Africa’s rising urbanization rate is expected to exceed 60% by 2030, amplifying packaged water penetration where safe municipal supply lags infrastructure investment. Although aluminum alternatives win share in boutique sparkling segments, PET remains the vessel of choice for bulk, low-margin water because it balances clarity, safety, and logistical economy.
Policy-Led Push for Closed-Loop Recycling Infrastructure
European Regulation 2025/40 compels 30% recycled content by 2030 and doubles the target a decade later, forcing converters to lock in rPET supply under multi-year contracts.[3]European Commission, "Regulation (EU) 2025/40 on Packaging and Packaging Waste," eur-lex.europa.eu Germany’s 98% collection rate through its deposit system offers a blueprint, prompting France, Spain, and Poland to expedite similar rollouts. California’s SB 54 transfers recycling costs onto brand owners, turning waste-management spend into a competitive variable. Chemical recyclers such as Eastman and Loop Industries are scaling depolymerization reactors that accept colored and multilayer feedstock, injecting virgin-equivalent resin into the pet bottles market and reducing pressure on mechanical recycling yields. Collectively, these measures translate policy risk into capital opportunity, favoring suppliers with vertically integrated recycling assets.
HolyGrail 2.0 Digital Watermarking Boosting Food-Grade Sorting Yield
Digital codes embedded on each bottle surface enable optical sorters to identify brand, color, and previous content at 90% accuracy, up from 70% using conventional near-infrared technology. European trials show 15-20% uplift in food-grade rPET yield, equivalent to thousands of metric tons of incremental supply at existing collection volumes. The program also unlocks chain-of-custody verification, letting retailers audit recycled-content claims and deterring greenwashing. Converters implementing the system report faster bale acceptance during procurement because contamination risk declines. While capital expenditure for new sorters is significant, grant funding through the European Innovation Fund and rising landfill fees tilt the balance in favor of rollout, solidifying sorting accuracy as a new competitive benchmark in the pet bottles market.
Restraints Impact Analysis*
| Restraint | ( ~ ) % Impact on CAGR Forecast | Geographic Relevance | Impact Timeline |
|---|---|---|---|
| Escalating Environmental Scrutiny of Single-Use Plastics | −0.8% | Global, highest in Europe and North America | Short term (≤ 2 years) |
| Growing Preference for Aluminum and Glass Substitutes | −0.5% | North America and Europe, premium segments | Medium term (2-4 years) |
| Shortage of FDA-Compliant Low-IV rPET for Pharmaceutical Bottles | −0.3% | North America and Europe | Medium term (2-4 years) |
| Freight Restrictions on Returnable Bale Flows Reducing rPET Supply | −0.2% | Asia-Pacific and South America | Long term (≥ 4 years) |
| Source: Mordor Intelligence | |||
Escalating Environmental Scrutiny of Single-Use Plastics
Non-governmental organizations intensify campaigns that link marine debris to single-use containers, motivating retailers to test refill stations and concentrate formats. Canada’s 2024 ban on certain items excluded PET, yet the exemption is contingent on proven high recycling performance. European grocers add on-shelf eco-scores that favor reusable or high-PCR packages, nudging laggard brands into penalty zones. California’s framework assigns escalating fees for non-compliance, transferring margin pressure to converters without robust rPET pipelines. Public perception therefore shapes procurement, shelf space, and even licensing, making sustainability credentials a core sales prerequisite within the pet bottles market.
Gowing Preference for Aluminum and Glass Substitutes
Aluminum canned water brands leverage a high-recycling narrative and edgy aesthetics to attract Gen-Z consumers, achieving 20-30% price premiums. Craft soda start-ups employ glass for its retro cues, while premium juices adopt glass to signal purity. PET’s superior light-weighting and shatter resistance sustain leadership in large-volume water and carbonates, yet incremental SKU losses in profitable niches erode mix. Converters counter by launching tethered caps, recycled-content declarations, and refill pilot projects. Still, substitution in image-sensitive categories slows top-line expansion for the pet bottles market in mature regions.
*Our forecasts treat driver/restraint impacts as directional, not additive. The impact forecasts reflect baseline growth, mix effects, and variable interactions.
Segment Analysis
By End-User Vertical: Pharmaceuticals Accelerate While Beverages Retain Scale
Beverages supplied 63.23% of 2025 demand, affirming their anchor status for the pet bottles market. Continuous investment in ultra-high-speed filling, coupled with aggressive lightweighting and tethered-closure compliance, fortifies PET’s cost and performance edge in packaged water and carbonated soft drinks. Transparency and design freedom support brand equity, and lower transport emissions reinforce retailer acceptance. In regions where e-commerce beverages expand, PET’s high stacking efficiency further solidifies its logistical advantage. Despite rising aluminum interest in sparkling water, mass-market beverages preserve volume stability, sustaining baseline plant utilization across converter networks.
Pharmaceuticals, although smaller in absolute tonnage, clock the fastest growth at a 5.34% CAGR to 2031. Injectable biologics, cough syrups, and nutraceutical beverages transition from glass to PET for shatter safety and lower shipping weight. Gerresheimer’s FDA-compliant low-IV rPET vials demonstrate that recycled material can meet stringent extractables limits, unlocking premium margin segments. Supply remains constrained by limited pharmaceutical-grade rPET feedstock, pushing price spreads over virgin PET into double digits. However, chemical recycling projects promise increased availability of compliant resin during the forecast window, allowing the pet bottles market to deepen penetration within health care.


By Technology: Thermoforming Captures Wide-Mouth Growth, Stretch Blow Molding Remains Dominant
Stretch blow molding held 78.12% share of the 2025 pet bottles market size because injection-molded preforms enable high cavity counts and 40 000-plus bottle per hour outputs, critical for water and soda lines. Lightweighting advances focus on preform redesign that maintains top-load strength while curbing gram weight, integrating up to 25% rPET without performance loss. OEMs bundle blow, label, and fill into single monoblocs that reduce changeover downtime and factory footprint.
Thermoforming advances at 4.71% CAGR thanks to personal care and food brands pursuing wide-mouth jars with tactile embossing and thick walls for premium shelf appeal. The process shapes flat panels that accommodate large adhesive labels or in-mold decoration, enhancing brand differentiation. Although cycle times lag stretch blow molding, new servo-driven indexers narrow the gap, making thermoforming commercially viable for mid-volume cosmetics and nut-butter runs. Injection molding remains indispensable for preform supply, while extrusion blow molding serves detergents and automotive fluids where barrier needs are modest and cost sensitivity is paramount. The coexistence of technologies mirrors the diverse specification landscape of the pet bottles market.
By Bottle Capacity: Bulk Formats Lift Emerging-Market Volume
Containers below 500 mL accounted for 43.12% of 2025 shipments, fueled by grab-and-go lifestyles, vending expansion, and portion control. Retailers pressure suppliers to meet tethered-cap laws without sacrificing drinking comfort, prompting neck redesigns that shave additional grams. Environmental scrutiny complicates future trajectory, yet lightweighting, rPET integration, and deposit systems blunt criticism, preserving this segment’s huge baseline volume.
Bottles above 2 liters are projected to register a 4.83% CAGR because family-sized water and cooking-oil packs optimize cost per liter for budget-conscious households in India, China, Nigeria, and Kenya. E-commerce fulfillment favors fewer, larger units that reduce pick frequency and packaging waste. Handle grips, anti-glug finishes, and reinforced base cups improve ergonomics for home storage. Between 501 mL and 1 liter, sports drinks and flavored water benefit from resealable caps and contoured panels that enhance grip during athletic use. The 1.01-2 liter cohort remains the mainstay for soda multipacks, posting modest gains tied to population growth. Overall, shifting household economics and retail channel evolution sustain balanced demand across every size tier of the pet bottles market.
By Resin Type: Recycled PET Narrows the Gap on Virgin Grades
Virgin PET maintained 72.34% share in 2025, anchored by optical clarity and predictable mechanical properties that beverage fillers demand. Feedstock linkage to paraxylene prices exposes converters to oil volatility, yet long-term supply contracts blunt cost swings. Manufacturers continue investing in melt filtration and solid-state polycondensation lines to push intrinsic viscosity consistency, safeguarding carbonation retention for sodas.
Recycled PET, advancing at a 4.41% CAGR, gains tailwinds from regulation and voluntary pledges committing flagship SKUs to 100% PCR. Deposit systems in Germany, the Netherlands, and Scandinavian countries achieve bale purity that delivers clear flakes suitable for bottle-grade rPET. Digital watermarking further boosts yield, while chemical depolymerization unlocks contaminated waste streams into near-virgin output. Regional disparities persist: Asia-Pacific struggles with collection logistics and export tariffs on waste bales, constricting supply and elevating spot rPET premiums. Over the forecast horizon, scaled chemical recycling is expected to mitigate price gaps, letting the pet bottles market approach feedstock parity across major regions.
Geography Analysis
Asia-Pacific accounted for 39.21% of global volume in 2025, driven by China’s export-oriented converters and India’s middle-class consumption surge. Chinese plants serve multinational beverage contracts at globally competitive cost, and domestic demand accelerates as urban lifestyles favor ready-to-drink formats. India’s packaged water boom rides on safety concerns and expanding convenience-store networks, while government plastic-waste rules begin to mirror European recycled-content thresholds, stimulating local rPET investment. Japan’s rigorous Food Sanitation Act supports premium PET for pharma and functional drinks, and South Korea posts collection rates above 85% due to deposit incentives. Freight restrictions on waste bales pose supply risks, yet rising chemical recycling capacity in China and Japan aims to relieve feedstock pressure and stabilize the pet bottles market across the region.
Africa is forecast to be the fastest-growing territory at a 5.12% CAGR from 2026 to 2031. Kenya’s new PET plant, powered partly by solar, anchors East African expansion, serving a corridor from Nairobi to Dar es Salaam. South Africa’s PETCO framework raised collection to 65% in 2024, enabling domestic rPET supply that insulates producers from foreign exchange swings. Nigeria, Ghana, and Côte d’Ivoire attract beverage multinationals establishing greenfield filling lines to meet rising urban consumption. Inconsistent electricity grids and limited cold-chain infrastructure remain hurdles, yet modular plant designs and backup generators mitigate downtime. The Middle East sustains year-round bottled water demand, with Saudi Arabia's Vision 2030 channeling investment into local manufacturing to displace imports. Turkey functions as a bridge hub, exporting preforms to both Europe and the Gulf Cooperation Council, benefiting from favorable trade agreements and petrochemical proximity.
North America and Europe navigate regulatory transitions that redefine value chains. Germany's 98% collection sets the benchmark, and France's upcoming deposit scheme is modeled on identical architecture. California's SB 54 imposes graduated recycled-content floors, compelling converters to co-invest in wash lines or secure long-term rPET contracts. Canada's single-use plastics ban exempts PET, yet policymakers signal willingness to revisit criteria if recovery rates stall. South America shows divergent momentum: Brazil's integrated petrochemical sector supplies virgin PET competitively, while Argentina's macroeconomic volatility dampens capital spending. Mexico emerges as a nearshoring hub, expanding maquiladora preform capacity to serve U.S. beverage brands seeking tariff relief and shorter lead times. Collectively, these regional dynamics ensure the pet bottles market remains geographically diversified, balancing mature regulatory frameworks with high-growth emerging economies.

Competitive Landscape
The pet bottles market exhibits moderate fragmentation, with the top five converters holding roughly 45% of global volume, leaving ample room for regional and niche specialists. Amcor, ALPLA, and Gerresheimer leverage vertical integration into recycling, securing long-term rPET supply and guaranteeing compliance for multinational beverage and pharmaceutical clients. Amcor's EUR 50 million (USD 56.5 million) expansion in France adds 25,000 metric tons of annual rPET capacity, reinforcing its position as a preferred supplier to Danone and Nestlé Waters. ALPLA's on-site bottle-to-bottle units, installed at Coca-Cola Europacific Partners' German and Polish plants, cut bale transport emissions by 30% and compress supply chains, demonstrating how operational innovation translates into contract renewals. Gerresheimer focuses on regulated pharmaceutical niches where FDA 21 CFR 177.1630 compliance creates high barriers to entry, enabling stable margins despite smaller volumes.
Mid-tier players such as Greiner, Resilux, and Retal carve defensible positions through geographic proximity and rapid design customization. Greiner's 100% rPET shampoo bottle for Unilever incorporates digital watermarking, aligning with retailer sustainability scorecards. Resilux commissioned a 15,000-metric-ton line in Nairobi, powered partly by solar, capturing Africa's 5.12% CAGR and hedging against grid instability. Retal expanded Saudi preform capacity by 800 million units, exploiting Vision 2030 local-content incentives and proximity to Gulf Cooperation Council markets. These converters prioritize agility over scale, responding to short-run specialty beverage orders that global giants find economically unattractive.
Chemical recycling disruptors, including Eastman and Loop Industries, are scaling depolymerization reactors that convert contaminated and colored PET waste into virgin-equivalent resin, bypassing mechanical recycling's quality ceiling. Plastipak's USD 120 million joint venture with Loop Industries targets 18,000 metric tons of annual output by 2027, offering converters a second feedstock channel insulated from bale market volatility. Graham Packaging's AI-driven hot-fill barrier additives enable 15% rPET in juice applications previously restricted to virgin grades, winning a USD 75 million PepsiCo contract for Gatorade and Tropicana. As extended producer responsibility fees escalate, suppliers with proprietary recycling or specialty-material capabilities are poised to widen market share, while commodity converters face margin compression and potential consolidation.
PET Bottles Industry Leaders
-
Amcor plc
-
ALPLA Werke Alwin Lehner GmbH & Co KG
-
Gerresheimer AG
-
PACT Group Holdings Ltd.
-
Retal Industries Ltd.
- *Disclaimer: Major Players sorted in no particular order

Recent Industry Developments
- January 2026: Amcor committed EUR 50 million (USD 56.5 million) to expand its Beaune, France recycling facility, targeting 25,000 metric tons of new rPET output by late 2027.
- December 2025: ALPLA and Coca-Cola Europacific Partners began installing on-site bottle-to-bottle recycling modules at three German and Polish plants, cutting bale transport emissions by 30%.
- November 2025: Berry Global acquired a 60% stake in a Mexican PET preform supplier for USD 85 million, adding 1.2 billion annual preform capacity to serve nearshoring beverage demand.
- October 2025: Gerresheimer introduced a low-IV rPET bottle range compliant with FDA 21 CFR 177.1630 for biologics and liquid drugs.


Global PET Bottles Market Report Scope
Polyethylene terephthalate (PET) is used in plastic bottle production. Its popularity stems from its durability, cost-effectiveness, and high recyclability, making it practical and environmentally responsible. PET bottles are characterized by their transparency, lightweight nature, and flexibility. They effectively preserve the quality of their contents, maintaining taste and odor. After use, PET bottles can be easily recycled through dedicated collection systems. The beverage industry widely adopts PET because it can withstand various temperatures and pressures, ensuring product safety and quality. The material's lightweight nature reduces transportation costs and energy consumption, enhancing its environmental benefits. PET's recyclability contributes to a circular economy model, promoting material reuse, waste reduction, and resource conservation.
The PET Bottles Market Report is Segmented by End-user Vertical (Beverages, Food, Personal Care, Household Care, Pharmaceuticals, Other End-user Verticals), Technology (Stretch Blow Molding, Injection Molding, Extrusion Blow Molding, Thermoforming), Bottle Capacity (Less than 500 mL, 501 mL to 1 L, 1.01 L to 2 L, More than 2 L), Resin Type (Virgin PET, Recycled PET), and Geography (North America, South America, Europe, Asia-Pacific, Middle East, Africa). The Market Forecasts are Provided in Terms of Volume (Million Metric Tons).
| Beverages | Packaged Water |
| Carbonated Soft Drinks | |
| Fruit Juice | |
| Energy Drinks | |
| Other Beverages | |
| Food | |
| Personal Care | |
| Household Care | |
| Pharmaceuticals | |
| Other End-user Verticals |
| Stretch Blow Molding |
| Injection Molding |
| Extrusion Blow Molding |
| Thermoforming |
| Less than 500 mL |
| 501 mL - 1 L |
| 1.01 L - 2 L |
| More than 2 L |
| Virgin PET |
| Recycled PET (rPET) |
| North America | United States |
| Canada | |
| Mexico | |
| South America | Brazil |
| Argentina | |
| Rest of South America | |
| Europe | United Kingdom |
| Germany | |
| France | |
| Spain | |
| Italy | |
| Rest of Europe | |
| Asia-Pacific | China |
| India | |
| Japan | |
| Australia | |
| South Korea | |
| Rest of Asia-Pacific | |
| Middle East | Saudi Arabia |
| United Arab Emirates | |
| Turkey | |
| Rest of Middle East | |
| Africa | South Africa |
| Kenya | |
| Rest of Africa |
| By End-user Vertical | Beverages | Packaged Water |
| Carbonated Soft Drinks | ||
| Fruit Juice | ||
| Energy Drinks | ||
| Other Beverages | ||
| Food | ||
| Personal Care | ||
| Household Care | ||
| Pharmaceuticals | ||
| Other End-user Verticals | ||
| By Technology | Stretch Blow Molding | |
| Injection Molding | ||
| Extrusion Blow Molding | ||
| Thermoforming | ||
| By Bottle Capacity | Less than 500 mL | |
| 501 mL - 1 L | ||
| 1.01 L - 2 L | ||
| More than 2 L | ||
| By Resin Type | Virgin PET | |
| Recycled PET (rPET) | ||
| By Geography | North America | United States |
| Canada | ||
| Mexico | ||
| South America | Brazil | |
| Argentina | ||
| Rest of South America | ||
| Europe | United Kingdom | |
| Germany | ||
| France | ||
| Spain | ||
| Italy | ||
| Rest of Europe | ||
| Asia-Pacific | China | |
| India | ||
| Japan | ||
| Australia | ||
| South Korea | ||
| Rest of Asia-Pacific | ||
| Middle East | Saudi Arabia | |
| United Arab Emirates | ||
| Turkey | ||
| Rest of Middle East | ||
| Africa | South Africa | |
| Kenya | ||
| Rest of Africa | ||


Key Questions Answered in the Report
What is the projected size and growth rate for PET bottles through 2031?
Global volume is expected to reach 33.49 million metric tons by 2031, expanding at a 4.51% CAGR from 2026, driven by beverage demand, lightweighting, and recycled-content mandates.
Which end-user vertical is growing fastest?
Pharmaceuticals are advancing at a 5.34% CAGR through 2031 as biologics and liquid formulations shift from glass to PET for shatter resistance and lower shipping weight.
How are recycled-content regulations affecting the PET bottles industry?
European Regulation 2025/40 mandates 30% recycled content by 2030 and 65% by 2040, compelling converters to secure long-term rPET contracts and invest in chemical recycling to meet compliance.
What role does lightweighting play in cost reduction?
Lightweighting cuts resin consumption by up to 15%, lowers freight emissions, and reduces extended producer responsibility fees, delivering immediate payback for converters and brand owners.
Which region offers the highest growth potential?
Africa is forecast to register a 5.12% CAGR from 2026 to 2031, fueled by urbanization, rising middle-class consumption, and infrastructure investments in Kenya, South Africa, and Nigeria.
How is digital watermarking improving recycling yields?
HolyGrail 2.0 achieves 90% detection accuracy for SKU-level sorting, lifting food-grade rPET yields by 15-20% and enabling chain-of-custody verification for recycled-content claims.
Page last updated on:


