Market Overview
| Study Period | 2020 - 2031 |
|---|---|
| Market Size (2026) | USD 122.5 Billion |
| Market Size (2031) | USD 151.20 Billion |
| Growth Rate (2026 - 2031) | 4.30% CAGR |
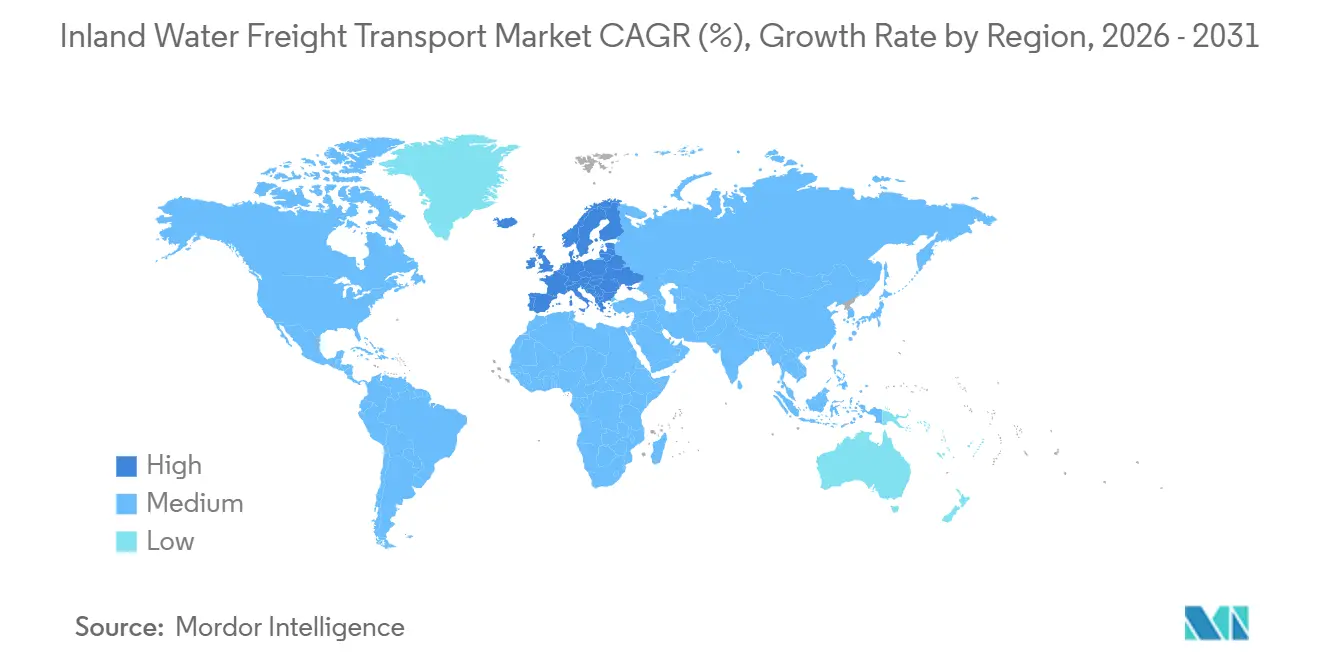
| Fastest Growing Market | Asia-Pacific |
| Largest Market | Europe |
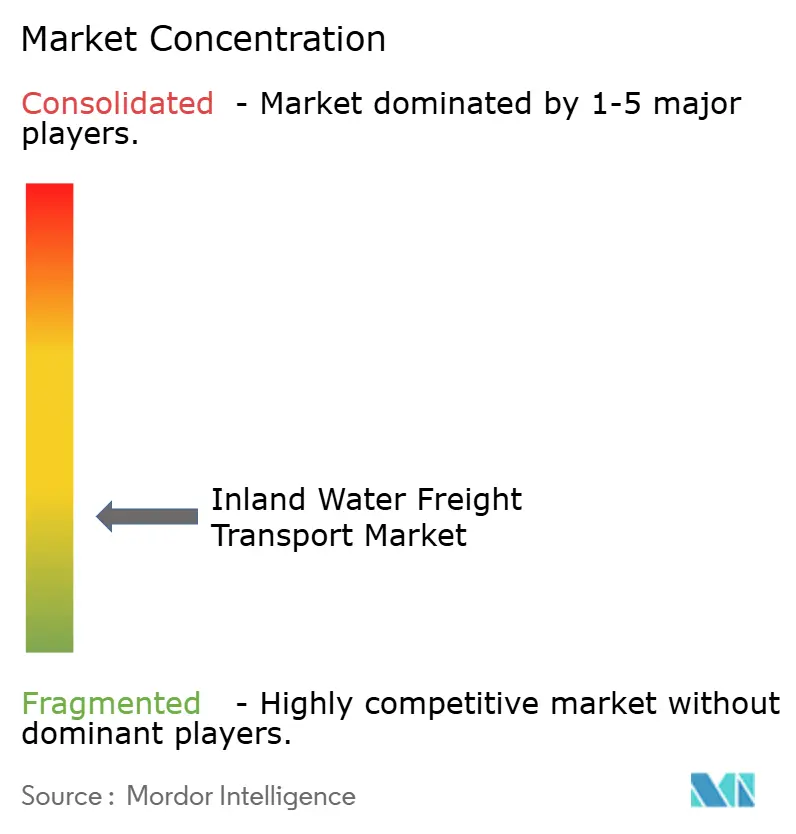
| Market Concentration | Low |
Major Players *Disclaimer: Major Players sorted in no particular order Image © Mordor Intelligence. Reuse requires attribution under CC BY 4.0. | |
Inland Water Freight Transport Market Analysis by Mordor Intelligence
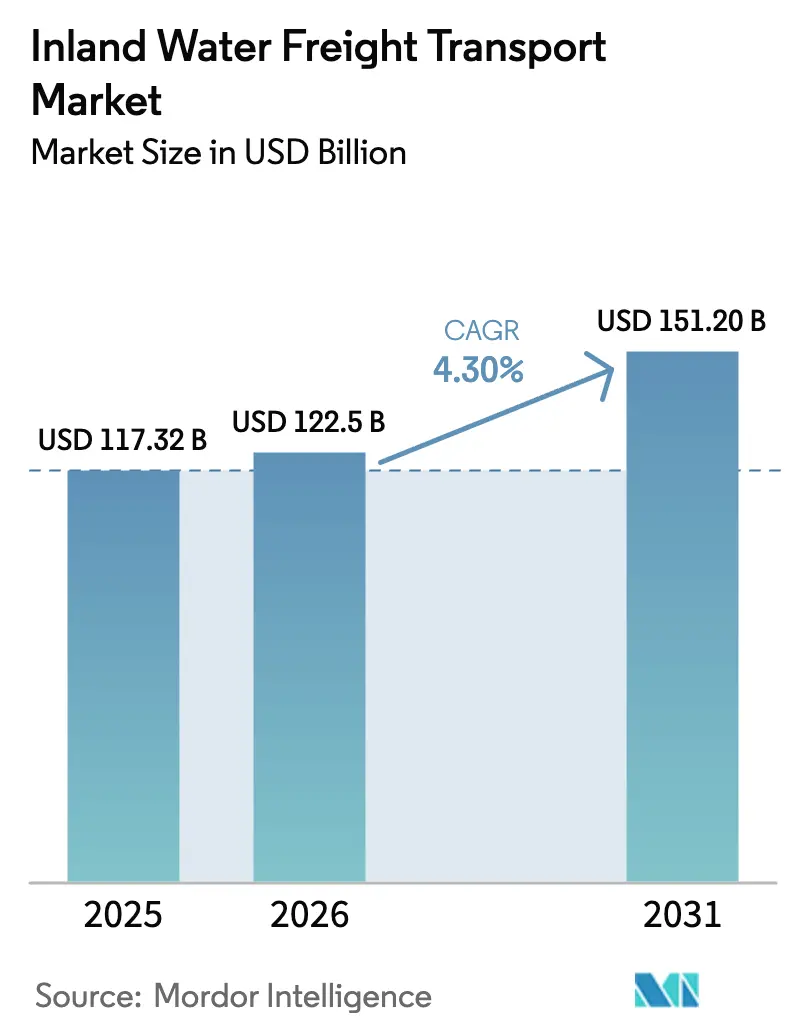
The inland water freight transport market size is expected to increase from USD 117.32 billion in 2025 to USD 122.50 billion in 2026 and reach USD 151.2 billion by 2031, growing at a CAGR of 4.3% over 2026-2031. Demand accelerates as shippers decarbonize supply chains, turning to barges that emit 40-60% less CO₂ per ton-kilometer than trucks, and as port-deepening projects funnel larger oceangoing vessels into hub terminals that rely on inland feeder services. Autonomous navigation pilots, hydrogen propulsion corridors, and blockchain cargo-tracking mandates collectively reshape service economics, allowing operators to cut crew costs, lower fuel spend, and monetize verified emissions data. Renewable diesel, sustainable aviation fuel feedstocks, and battery-critical minerals already dominate new volume growth, while container-on-barge services gain traction as urban planners restrict heavy-duty vehicles in city centers. Competitive dynamics now hinge on digital maturity and decarbonization readiness rather than fleet scale alone, tilting the advantage toward early adopters of AI-driven route optimization and zero-emission propulsion.
Key Report Takeaways
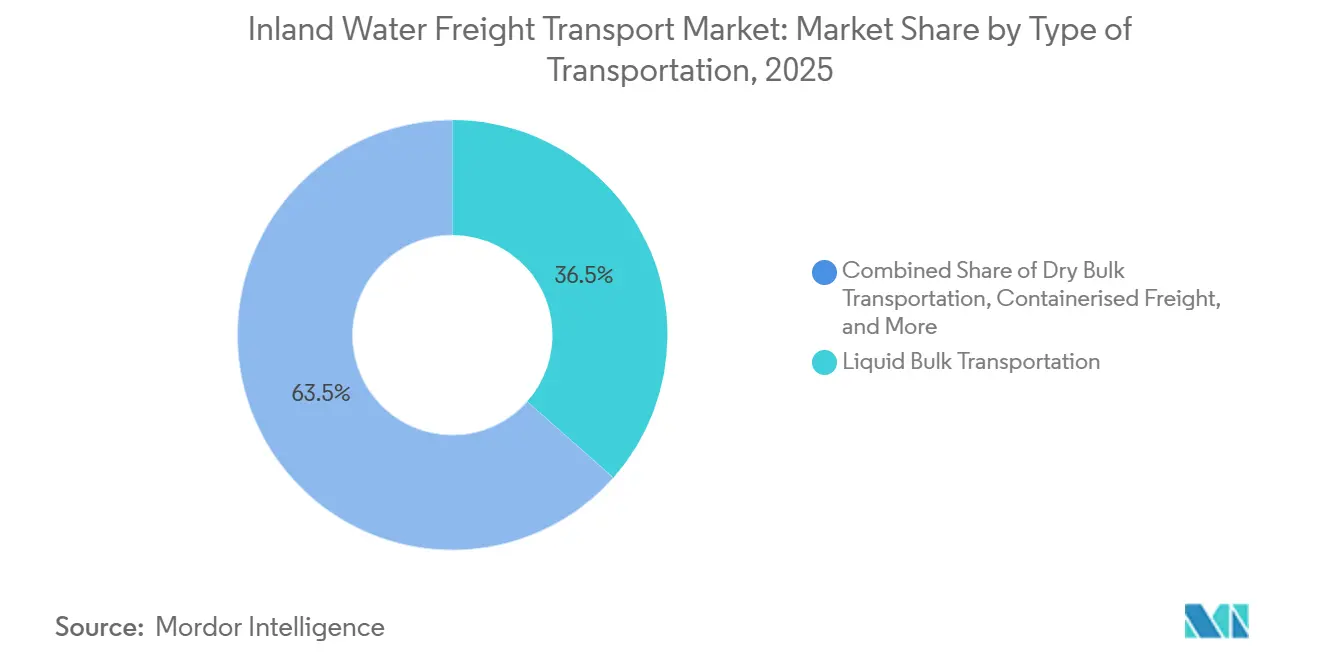
- By transportation type, liquid bulk held 36.54% of the inland water freight transport market share in 2025, while dry bulk is projected to expand at a 4.58% CAGR to 2031.
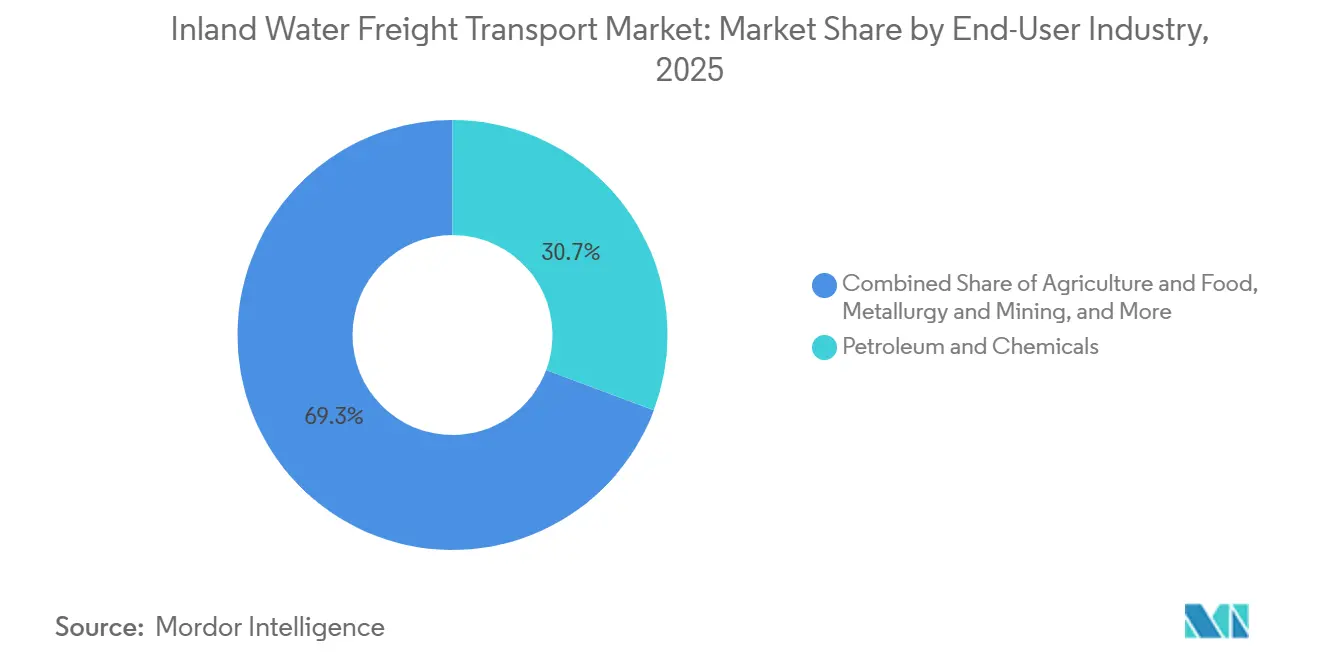
- By end-user industry, petroleum and chemicals commanded 30.70% of the inland water freight transport market size in 2025, whereas consumer goods and retail are forecast to grow at a 4.15% CAGR through 2031.
- By geography, Europe led with 44.32% share in 2025, and Asia-Pacific is poised to register the fastest 4.93% CAGR during 2026-2031.
Note: Market size and forecast figures in this report are generated using Mordor Intelligence’s proprietary estimation framework, updated with the latest available data and insights as of 2026.
Global Inland Water Freight Transport Market Trends and Insights
Drivers Impact Analysis*
| Driver | (~) % Impact on CAGR Forecast | Geographic Relevance | Impact Timeline |
|---|---|---|---|
| Expansion of renewable-fuel & bio-feedstock trade flows | +0.9% | North America & Europe, expanding to South America | Medium term (2-4 years) |
| Surge in critical-minerals logistics for EV supply chains | +1.1% | Asia-Pacific core, spill-over to South America and Africa | Long term (≥ 4 years) |
| Post-Panamax port deepening, unlocking barge corridors | +0.7% | North America & Europe, selective Asia-Pacific ports | Medium term (2-4 years) |
| Hydrogen-powered corridor pilots & green inland-port funding | +0.6% | Europe leadership, North America following | Long term (≥ 4 years) |
| Blockchain-based cargo-traceability compliance mandates | +0.4% | Global, led by EU regulatory frameworks | Short term (≤ 2 years) |
| Autonomous modular push-barge convoys for shallow waterways | +0.5% | North America & Europe, pilot expansion to Asia-Pacific | Long term (≥ 4 years) |
| Source: Mordor Intelligence | |||
Expansion of Renewable-Fuel and Bio-Feedstock Trade Flows
Barge movements of vegetable oils, animal fats, and agricultural residues climbed 127% from 2024 to 2025 along the United States Gulf Coast corridors under renewable fuel standard mandates that reward low-carbon logistics[1]U.S. Energy Information Administration, “U.S. renewable diesel production capacity increased by 60% in 2023,” eia.gov . Marathon Petroleum channels feedstock to its 184-million-gallon North Dakota renewable diesel complex by Missouri River barge, locking in decades-long volume. Europe mirrors this pattern as rapeseed and used-cooking oil volumes rise along the Rhine-Main-Danube, supported by IMO 2030 carbon-intensity targets. The opportunity widens to algae oil and lignocellulosic biomass, although storage and handling infrastructure for these next-generation materials remains sparse outside pilot hubs. Operators that standardize tank-cleaning protocols and temperature-controlled holds gain first-mover pricing power.
Surge in Critical-Mineral Logistics for EV Supply Chains
China’s Yangtze River carried 2.3 million tons of battery-grade lithium, cobalt, nickel, and graphite in 2025, up from 890,000 tons in 2023, reflecting gigafactory clustering near deep navigable channels. Indonesia’s nickel-ore export ban forces domestic smelting, with river barges moving ore from Sulawesi mines to coastal plants; similar policy shifts spur barge demand in Chile and Argentina. Automakers now require auditable low-carbon transport, allowing operators that integrate blockchain custody records to charge premium rates. Long-haul truck lanes see a parallel decline as waterway legs remove up to 25% of logistics cost for dense metals.
Post-Panamax Port Deepening Unlocking Barge Corridors
Norfolk Harbor’s 15-m draft upgrade and USD 75 million James River channel widening enable four-barge tows to reach Richmond and cut container repositioning outlays 28%. Hamburg’s Elbe deepening unlocks 600 additional barge sailings yearly, prompting Hapag-Lloyd to switch 12% of feeder volumes from truck drayage[2]Virginia Port Authority, “Major Projects – Norfolk Harbor,” portofvirginia.com. As liner alliances concentrate vessel calls into mega-hubs, hinterland distances lengthen, making barge shuttles a cost- and emissions-efficient alternative.
Hydrogen-Powered Corridor Pilots and Green Inland-Port Funding
The H2 Barge 2 completed 500 revenue voyages on the Rotterdam-Duisburg axis in 2025 with 99.2% uptime and 40% lower operating cost than diesel peers once subsidies are factored. The European Commission’s EUR 1.5 billion (USD 1.73 billion) green-port envelope finances electrolyzers, storage, and bunkering at 23 terminals, accelerating vessel retrofits. United States Clean Ports grants extend 60% capital coverage for hydrogen-ready upgrades, positioning Mississippi River nodes for conversions from 2027.
Restraints Impact Analysis*
| Restraint | (~) % Impact on CAGR Forecast | Geographic Relevance | Impact Timeline |
|---|---|---|---|
| Invasive aquatic-weed proliferation is driving dredging costs | -0.6% | Asia-Pacific, South America, Africa, with tropical waterways | Medium term (2-4 years) |
| Stricter PFAS & microplastic discharge regulations | -0.4% | Europe & North America, expanding globally | Long term (≥ 4 years) |
| Cybersecurity risks to digital lock and bridge systems | -0.5% | Global, acute in digitally advanced networks | Short term (≤ 2 years) |
| Weather-related collision losses are spiking insurance premiums | -0.7% | Global, with regional severity variations | Medium term (2-4 years) |
| Source: Mordor Intelligence | |||
Invasive Aquatic-Weed Proliferation Driving Dredging Costs
Water-hyacinth infestations forced India’s National Waterway-1 to spend INR 450 crores (USD 54 million) on annual removal, or 23% of its operating budget. Mekong Delta channels recorded 40% coverage growth from 2023-2025 despite USD 18 million spent on control, compelling barges to derate cargo 15-20% to maintain safe under-keel clearance. Climatic warming accelerates the spread, and biological controls take 3-5 years to work, keeping cost pressure elevated.
Stricter PFAS & Micro-Plastic Discharge Regulations
EU proposals require reformulation of coatings and foams, adding EUR 12,000-35,000 (USD 13,800- 40,300) per vessel in retrofit outlays. The United States EPA sets 4-ppt drinking-water limits, compelling inland ports to install advanced filtration costing up to USD 8 million each. California’s 2025 ballast-water rule mandates sub-50-micron particle capture, imposing USD 400,000-1.2 million technology costs per unit[3]European Chemicals Agency, “PFAS Restriction Proposal,” echa.europa.eu.
*Our updated forecasts treat driver/restraint impacts as directional, not additive. The revised impact forecasts reflect baseline growth, mix effects, and variable interactions.
Segment Analysis
By Type of Transportation: Bulk Specialization Persists
Liquid bulk movements secured the largest 36.54% inland water freight transport market share in 2025, anchored by petroleum and chemical trades that concentrate around refinery clusters. Yet a pivot toward renewable feedstocks and on-site chemical production near renewable-energy hubs tempers long-term volume, prompting fleets to retrofit stainless tanks and heated pipelines. Dry bulk, by contrast, is forecast to outpace all segments at a 4.58% CAGR, powered by infrastructure megaproject demand for sand, gravel, and cement, and by critical-mineral flows to gigafactories situated along rivers for low-cost inbound logistics.
Autonomous navigation fits dry bulk especially well because standardized cargo profiles simplify algorithmic load planning and push-convoy configuration, letting operators cut crew costs by up to 70%. Containerized freight accelerates as congestion-free inland ports link to micro-fulfillment centers that orchestrate same-day urban delivery, a model now capturing 3-5% of metropolitan e-commerce replenishment volumes. Roll-on/roll-off remains niche but gains momentum for electric-vehicle shipments, taking advantage of waterway safety advantages for high-capacity battery transport.
Note: Segment shares of all individual segments available upon report purchase


By End-User Industry: Energy Transition Reshapes Demand
Petroleum and chemicals retained a dominant 30.70% share of the inland water freight transport market size in 2025, yet its mix evolves toward renewable diesel, SAF, and bio-chemicals that rely on low-carbon barge moves to meet Scope 3 targets. Consumer goods and retail emerge as the fastest-growing segment with a 4.15% CAGR because container-on-barge services bypass congested highways and satisfy city policies that cap truck entries.
Agriculture uses barges for grain and fertilizer as precision-farming pushes specialized blends to remote farms; metallurgy and mining sprint ahead on lithium and nickel tonnage expansion for batteries. Construction offers steady baseline volumes for aggregates and steel, while the energy segment shifts cargo mix from coal toward biomass pellets and green hydrogen components. Operators that document emissions under ISO 14083 win premium contracts from sustainability-minded manufacturers.
Note: Segment shares of all individual segments available upon report purchase
Geography Analysis
Europe commanded 44.32% of global value in 2025, supported by the Rhine-Main-Danube’s dense 8,000-kilometer network and an EU green-port budget that funnels EUR 1.5 billion (USD 1.73 billion) into hydrogen infrastructure. The Netherlands’ Zuid-Holland alone handled 172 million t, with barge penetration surpassing 50% of hinterland moves. Germany’s HyInland corridor now links Duisburg, Cologne, and Mainz with 40 converted hydrogen push boats, illustrating regional first-mover scale.
Asia-Pacific posts the fastest 4.93% CAGR through 2031 as China’s Yangtze River Economic Belt channels USD 180 billion into locks, intermodal yards, and digital dispatch centers[4]National Development and Reform Commission of China, “Yangtze River Economic Belt Development Plan,” ndrc.gov.cn. Vietnam’s USD 2.8 billion Mekong-Delta ports add three inland terminals, while India’s National Waterway-1 uses a Sagarmala budget of USD 12 billion to lift container volumes 40% year on year. Indonesia builds nickel-ore river routes to feed coastal smelters, expanding Southeast Asian traffic share.
North America benefits from a USD 8 billion lock-and-dam overhaul on the Mississippi, and Clean Ports hydrogen grants prime terminals for barge conversions from 2027. South America upgrades the Paraguay-Paraná to move surging soybean and lithium exports, with Argentina and Brazil allocating USD 3.2 billion to dredging and bank stabilization. Africa and the Middle East remain nascent but see early projects in Egypt’s Nile and Nigeria’s Niger corridors via Chinese financing.

Competitive Landscape
The inland water freight transport market is less fragmented: regional specialists maintain entrenched positions, but digitalization and decarbonization amplify consolidation pressure. Kirby Corporation’s hybrid M/V Green Diamond demonstrates incumbent pivot, cutting towboat emissions 80% while retaining operating flexibility across petroleum and chemical routes. CMA CGM and Maersk extend vertical integration, each ordering electric or hydrogen barges and incorporating blockchain into end-to-end service guarantees.
Technology adoption draws a stark divide. Autonomous convoy pilots by Yara and Kongsberg show 85% cost reductions and 60% lower collision rates, compressing freight rates for laggards still reliant on crewed operations. Smaller players unable to finance PFAS-compliant coatings, cyber-security fortification, or hydrogen retrofits become acquisition targets.
Platform-based freight forwarders try to aggregate spot capacity, yet asset owners sometimes withhold space, fearing commoditization. Insurers increasingly reward fleets with AI-driven risk mitigation, steering cargo toward operators with real-time hull-stress monitoring and predictive maintenance analytics.
Inland Water Freight Transport Industry Leaders
American Commercial Barge Line
Ingram Barge
Kirby Inland Marine
CMA CGM Group
Rhenus Group
- *Disclaimer: Major Players sorted in no particular order

Recent Industry Developments
- December 2025: A.P. Moller Maersk formalized collaborative planning agreements with European shippers to optimize inland freight flows, particularly leveraging barge transport as a cost-effective and sustainable alternative within integrated supply chains.
- November 2025: A.P. Moller Maersk entered into strategic agreements with key customers to implement resilient inland logistics solutions, focusing on flexible routing options, including inland waterways, to mitigate disruptions caused by congestion and climate-related challenges.
- August 2025: A.P. Moller Maersk enhanced its inland logistics network in Europe through strategic partnerships across barge, rail, and trucking providers, enabling improved multimodal connectivity and more efficient cargo movement between seaports and inland destinations.
- May 2025: Maersk and Hapag-Lloyd formed Gemini Cooperation, combining 290 vessels to achieve 90% schedule reliability across seven trade lanes.


Global Inland Water Freight Transport Market Report Scope
By Type of Transportation
| Liquid Bulk Transportation | |
| Dry Bulk Transportation | |
| Containerised Freight | Dry |
| Reefer | |
| Roll-On / Roll-Off Cargo |
By End-User Industry
| Agriculture & Food |
| Metallurgy & Mining |
| Petroleum & Chemicals |
| Construction |
| Energy (Biomass & Coal) |
| Consumer Goods & Retail |
| Others |
By Geography
| North America | United States |
| Canada | |
| Mexico | |
| South America | Brazil |
| Argentina | |
| Rest of South America | |
| Europe | Germany |
| Netherlands | |
| Belgium | |
| France | |
| Russia | |
| Rest of Europe | |
| Asia-Pacific | China |
| India | |
| Japan | |
| Australia | |
| Rest of Asia-Pacific | |
| Middle East & Africa | Saudi Arabia |
| United Arab Emirates | |
| Rest of Middle East And Africa |
| By Type of Transportation | Liquid Bulk Transportation | |
| Dry Bulk Transportation | ||
| Containerised Freight | Dry | |
| Reefer | ||
| Roll-On / Roll-Off Cargo | ||
| By End-User Industry | Agriculture & Food | |
| Metallurgy & Mining | ||
| Petroleum & Chemicals | ||
| Construction | ||
| Energy (Biomass & Coal) | ||
| Consumer Goods & Retail | ||
| Others | ||
| By Geography | North America | United States |
| Canada | ||
| Mexico | ||
| South America | Brazil | |
| Argentina | ||
| Rest of South America | ||
| Europe | Germany | |
| Netherlands | ||
| Belgium | ||
| France | ||
| Russia | ||
| Rest of Europe | ||
| Asia-Pacific | China | |
| India | ||
| Japan | ||
| Australia | ||
| Rest of Asia-Pacific | ||
| Middle East & Africa | Saudi Arabia | |
| United Arab Emirates | ||
| Rest of Middle East And Africa | ||


Key Questions Answered in the Report
How large is the inland water freight transport market in 2026?
It is valued at USD 122.50 billion and is on track to reach USD 151.2 billion by 2031 at a 4.3% CAGR.
Which transportation type is growing fastest?
Dry bulk leads with a 4.58% CAGR, reflecting surging construction-material and critical-mineral flows.
Why are Asia-Pacific volumes expanding more quickly than other regions?
China, Vietnam, and India are investing heavily in river-port upgrades and multimodal links, accelerating regional CAGR to 4.93%.
What technologies are reshaping barge operations?
Autonomous navigation, hydrogen propulsion, and blockchain cargo tracing cut operating costs, emissions, and paperwork.
How are environmental rules affecting fleet investments?
Stricter PFAS, microplastic, and carbon-intensity standards require costly retrofits, pushing operators toward zero-emission and compliant designs.
What infrastructure risks could limit market growth?
Ageing locks and dams, especially on the Mississippi and Rhine, pose capacity bottlenecks that require significant capital upgrades.
Page last updated on:


