Argentina Agriculture Market Analysis by Mordor Intelligence
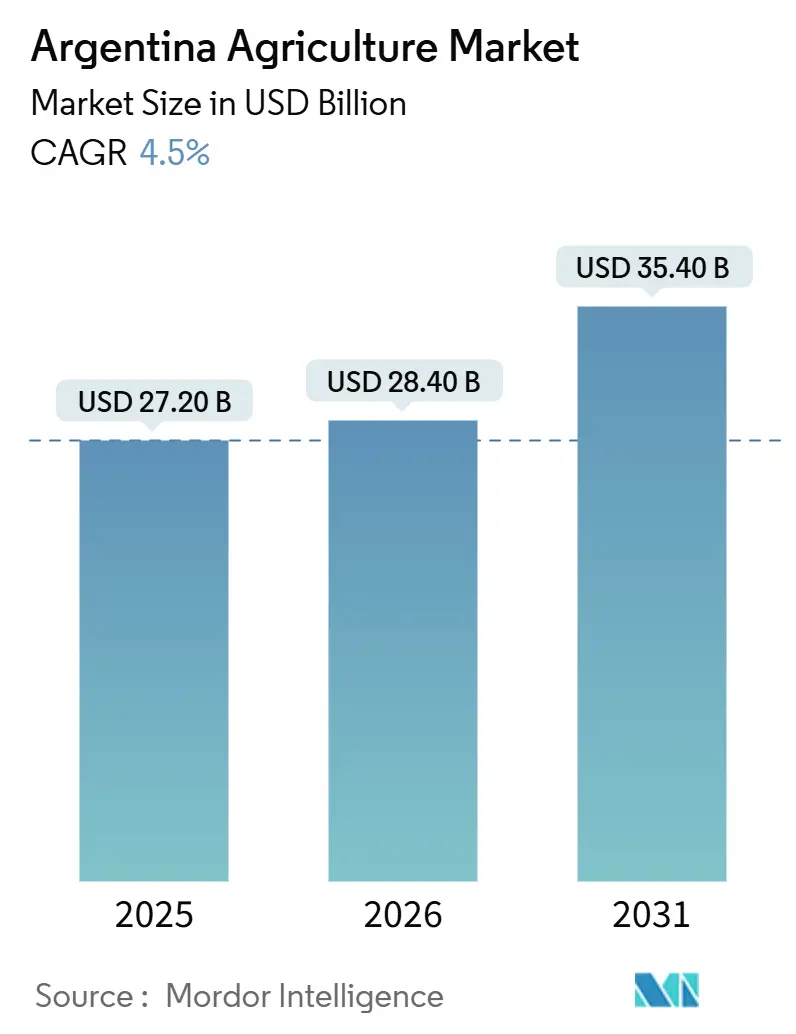
The Argentina Agriculture Market size is anticipated to grow from USD 27.2 billion in 2025 to USD 28.4 billion in 2026 and is forecast to reach USD 35.4 billion by 2031 at a 4.5% CAGR over 2026-2031. Grain yields are rebounding after the 2022-2023 La Niña drought, yet the pace remains measured because peso inflation continues to raise fertilizer and fuel costs while disease pressures, such as corn stunt, limit yield upside. Export-tax reductions and a managed float of the peso modestly bolster farm-gate margins, though the federal budget’s reliance on levy revenue tempers the scope of further cuts. Multilateral funding, including the World Bank’s Climate-Smart Agri-Food Systems Project, unlocks precision-agriculture tools that lift input efficiency, but slow provincial co-financing delays keep near-term benefits below potential. Competitive dynamics remain moderate, as five global merchants account for a decent share of Argentina agriculture market revenue, while a vibrant cooperative sector and local biotech firms provide countervailing power.
Key Report Takeaways
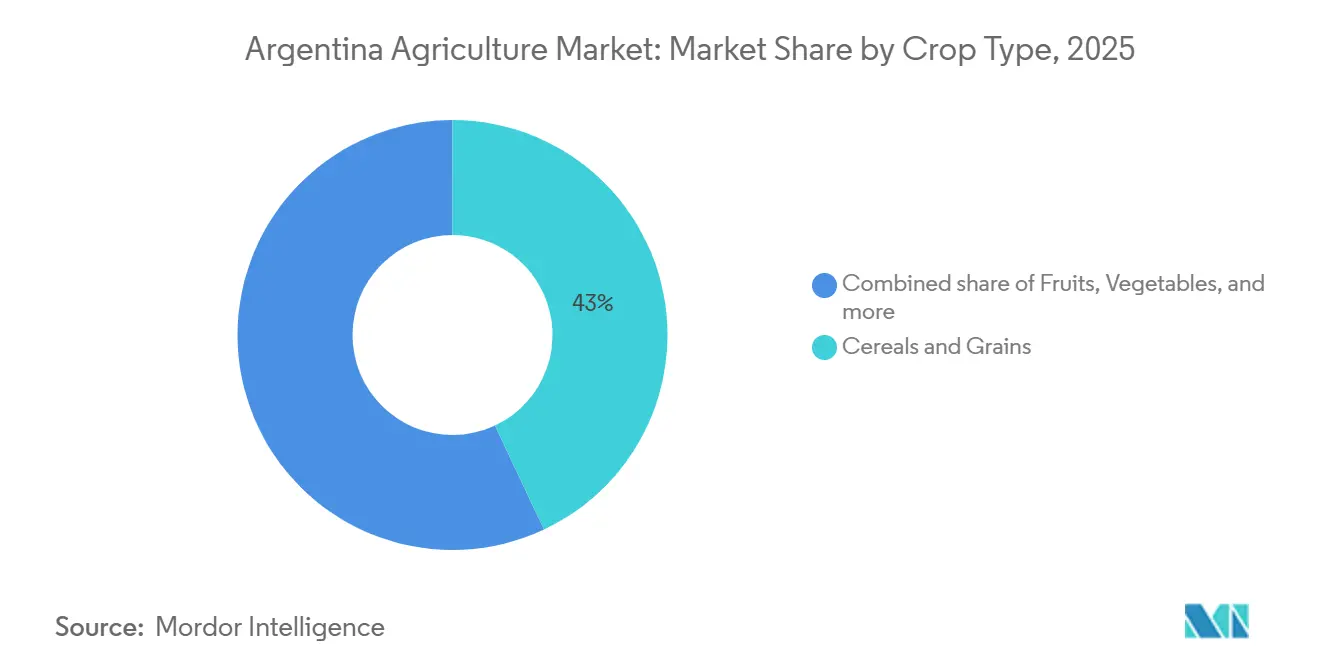
- By crop type, cereals and grains led with 43% of the Argentina agriculture market share in 2025, while fruits are projected to expand at a 4.8% CAGR through 2031.
Note: Market size and forecast figures in this report are generated using Mordor Intelligence’s proprietary estimation framework, updated with the latest available data and insights as of January 2026.
Argentina Agriculture Market Trends and Insights
Drivers Impact Analysis
| Driver | (~) % Impact on CAGR Forecast | Geographic Relevance | Impact Timeline |
|---|---|---|---|
| Expanding global demand for soybean and corn exports | +0.8% | Global, with peak output from China, the European Union, and Southeast Asia | Medium term (2–4 years) |
| Precision-Ag tax incentives and concessional equipment loans | +0.6% | National, strongest in Buenos Aires, Santa Fe, Córdoba, and Entre Ríos | Short term (≤2 years) |
| Multilateral funding for climate-smart agriculture projects | +0.4% | Pampas and Northwest provinces | Medium term (2–4 years) |
| Regenerative grazing accelerating double-cropping rotations | +0.3% | Pampas core, with spillover to Mesopotamia | Long term (≥4 years) |
| Blockchain-based traceability premiums from EU importers | +0.2% | Export-oriented Pampas and Mesopotamia corridors | Short term (≤2 years) |
| PPP-led irrigation corridors in arid northwest provinces | +0.3% | Salta and Jujuy | Medium term (2–4 years) |
| Source: Mordor Intelligence | |||
Expanding Global Demand for Soybean and Corn Exports
China missed its 2025 target to reduce soybean meal in animal feed below 13%, but its livestock industry remains reliant on it. This sustains Argentina's position as the leading exporter, with a 35% to 42% share of global soybean meal shipments[1]Source: USDA Foreign Agricultural Service, “Argentina – Grain and Feed Annual,” usda.gov . Beijing's policy of emphasizing domestic corn self-sufficiency has significantly limited total import volumes. As a result, Argentine traders have shifted their exports toward stable growth markets such as Vietnam, Egypt, and Algeria to offset the variability in Chinese demand. This shift utilizes Argentina's leading crushing capacity, with the completion of the Bunge-Viterra merger in July 2025, consolidating assets to enhance the production of high-value soybean oil and meal for global markets. This growth offers a significant alternative market, mitigating the effects of China's emphasis on domestic crushing. Meanwhile, the pending European Union-Mercosur beef quota adds indirect pull for Argentine feed grains to finish cattle that meet sustainability criteria.
Precision-Ag Tax Incentives and Concessional Equipment Loans
Argentina's 2024–2027 reforms reduced import tariffs on high-tech machinery from 35% to 12.6% and export taxes on grains, lowering costs for GNSS-guided planters and yield-monitoring combines in the Pampas and Mesopotamia regions[2]Source: Ministry of Agriculture, Livestock and Fisheries of Argentina, “Fiscal Decree 2024-2027: Precision Agriculture Incentives,” Argentina.gob.ar. Under the USD 400 million World Bank Climate-Intelligent and Inclusive Agri-Food Systems Project, Banco de la Nación Argentina offers credit for modern machinery to help producers adopt climate-resilient technologies. By 2025, the initiative aims to benefit over 365,000 individuals, supporting recovery and sustainability. National Institute of Agricultural Technology trials show GNSS guidance cuts soybean seed overlap by 6-8%, saving USD 12-16 per hectare, while variable-rate nitrogen boosts corn yields by up to 0.6 metric tons per hectare in Buenos Aires and Santa Fe[3]Source: National Institute of Agricultural Technology, “Precision Agriculture Program Results 2025,” Inta.gob.ar. Rosario Board of Trade models suggest these tools can close the 2.7 metric ton per hectare corn yield gap by as much as 22% across 8.2 million hectares of underperforming land. Yet farmers with fewer than 200 hectares remain largely excluded because a basic precision package still costs at least USD 45,000 even after incentives, entrenching the productivity divide and hastening consolidation toward larger operators.
Multilateral Funding for Climate-Smart Agriculture Projects
The World Bank's USD 300 million Climate-Smart Agri-Food Systems Project supports the use of satellite-guided planters, soil moisture probes, and renewable energy pumps across approximately 120,000 hectares in the key provinces of Buenos Aires, Córdoba, and Santa Fe. In June 2023, the Inter-American Development Bank (IDB) approved a USD 350 million loan to support Argentina's climate action initiatives. The funding aims to advance policies to reduce agricultural emissions and to promote technologies such as precision fertilizer application to enhance efficiency. Procurement for the Climate-Smart Agri-Food Systems Project experienced delays, with approximately 38% of the early-phase budget utilized by mid-2025, as provinces encountered challenges in finalizing local strategies and meeting co-financing requirements. The National Agricultural Technology Institute (Instituto Nacional de Tecnología Agropecuaria) installed 450 weather stations to feed yield-prediction models that optimize planting windows. Mandatory allocation of 30% of funds to farms of less than 200 hectares aims to curb the widening productivity gap between corporate estates and smallholders.
Regenerative Grazing Accelerating Double-Cropping Rotations
Rotational grazing shifts cattle across paddocks to stimulate root growth and free land for winter wheat before summer soy, raising annual crop intensity from 1.4 to 2.1 rotations per hectare. In 2023, Adecoagro combined cattle and crops across 240,000 hectares and cut nitrogen use by 22%, saving USD 45 per hectare while boosting subsequent soy yields by 12-15%. The 2022-2023 drought exposed the moisture risks of continuous soy, prompting broader interest in cover crops that fix nitrogen and break pest cycles. The Argentine No-Till Farmers Association trained 8,500 growers in 2025 on regenerative methods that enhance soil carbon and resilience. Although there are no tax credits for carbon storage, vertically integrated players internalize multiyear payoffs and lead adoption.
Restraints Impact Analysis
| Restraint | (~) % Impact on CAGR Forecast | Geographic Relevance | Impact Timeline |
|---|---|---|---|
| Severe weather volatility and drought-driven crop losses | -0.7% | Pampas and Mesopotamia | Short term (≤ 2 years) |
| Input-cost inflation and peso currency instability | -0.5% | National, acute in Northwest and Cuyo smallholdings | Short term (≤ 2 years) |
| Corn-stunt disease and pest-resistance hotspots | -0.3% | Córdoba, Santa Fe, and northern Buenos Aires | Medium term (2–4 years) |
| Concentrated agro-input supplier power squeezing smallholders | -0.2% | Nationwide, the highest in the Northwest and Patagonia | Long term (≥ 4 years) |
| Source: Mordor Intelligence | |||
Severe Weather Volatility and Drought-Driven Crop Losses
The 2022-2023 La Niña episode halved soybean output to 21 million metric tons and cut corn to 34 million metric tons, causing USD 20 billion in economic damage. Although the 2024/25 rains increased soybean production to 48.5 million metric tons, long-term climate models from the National Meteorological Service indicate that the region remains susceptible to recurring La Niña-induced dryness, which is anticipated to return before 2027. Exceptionally low Parana River levels during 2021–2022 compelled ships to reduce their loads by up to 25%. This resulted in a 300% increase in logistics costs and a substantial export price penalty, diminishing Argentina's competitiveness relative to Brazil and the United States. Although hail insurance is widely used, Multi-Peril Crop Insurance covers less than 5% of Argentina's planted hectares. This leaves growers predominantly self-insured against systemic risks such as drought, making them highly susceptible to balance-sheet shocks. Emergency loans of ARS 50 billion (USD 55 million) in 2023 covered only a fraction of replanting needs and hastened small-farm exits.
Input-Cost Inflation and Peso Currency Instability
In 2025, annual consumer inflation declined to a multi-year low of 31.5%. However, agricultural profit margins were pressured by a combination of low global commodity prices and dollar-linked input costs, which offset the benefits of export tax reductions. Argentine urea prices reached USD 596 per metric ton in February 2026, representing a 25% premium over Brazilian rates. Despite this, consumption has remained steady due to the removal of tariffs. However, experts warn that current application levels are insufficient to restore the soil's nutrient balance. In February 2026, diesel prices in Rosario increased to ARS 1,812 per liter (USD 1.30), further straining producers' margins. This rise coincided with a yield reduction of 0.2 to 0.3 metric tons per hectare caused by extreme heat and dryness in the core agricultural region. The removal of fuel subsidies in 2024 exposes Argentine producers to global energy shocks, creating a cost-price squeeze for smallholders who lack the advanced hedging tools available to larger entities. Amid financial challenges, many growers in Northwest Argentina delayed input purchases during the 2025/26 cycle to manage currency fluctuations and high dollar-linked costs.
Segment Analysis
By Crop Type: Cereals and Grains Anchor Export Revenue
Cereals and Grains accounted for 43% of the Argentina agriculture market share in 2025, led by corn and wheat. Wheat output climbed significantly as Buenos Aires and La Pampa enjoyed timely spring rains that lifted yields to a seven-year high. Corn stabilized despite disease hotspots because later sowing windows avoided peak vector pressure. Fruits are the fastest-growing segment, with a 4.8% CAGR, driven by Tucuman lemons capturing the majority of the global fresh-lemon trade and Entre Ríos blueberries filling off-season Asian gaps.
Oilseeds and Pulses recovered, yet stagnant biodiesel mandates cap crushing margins even as soybean meal demand stays firm in Southeast Asia. Vegetables meet domestic demand around urban belts but face competition from Brazilian truckloads that undercut prices for tomatoes and potatoes. Cash crops such as cotton and sugarcane face substitute pressure from synthetics and an ethanol-blend ceiling that limits sugar profitability. Turf and Ornamentals, while niche, has recorded decent annual growth and caters to urban landscaping but lacks export scale due to stringent phytosanitary hurdles.
Note: Segment shares of all individual segments available upon report purchase
Get Detailed Market Forecasts at the Most Granular Levels
Download PDF
Geography Analysis
The Pampas region remains the leading contributor to Argentina's agricultural market size. However, its growth has slowed, as prime land values surpassing the USD 12,000-per-hectare limit further limit horizontal expansion and redirect efforts toward yield optimization. The Northwest provinces of Salta, Jujuy, and Tucuman enjoy the fastest CAGR through 2031 as drip irrigation opens 60,000 hectares to beans and subtropical fruits. Mesopotamia, covering Entre Ríos and Corrientes, has recorded a descent growth as it diversifies beyond forestry into rice-cattle rotations and citrus plots aimed at Asia.
Cuyo, made up of Mendoza, San Juan, and San Luis, advances because table grapes and stone fruits offset soft bulk wine prices, though water allocations remain contested among farmers, miners, and cities. Patagonia’s pear and apple orchards manage limited growth as aging trees and stronger New Zealand offers weigh on returns. The region requires USD 180 million in replanting to pivot to premium fresh varieties, a sum growers struggle to source without concessional credit.
Regional strategies increasingly emphasize climate resilience. Pampas estates edge into regenerative grazing and double-cropping to raise land use, while Mesopotamia leverages integrated floodplains for rice and cattle. Northwest investors bank on drip lines and exportable subtropical fruit that carry higher margins than bulk grain. Even slow-growing Patagonia seeks niche premiums by supplying GlobalGAP-certified apples to discerning European retailers.
Competitive Landscape
Cargill Argentina S.A. (Cargill S.A.) and Bunge Argentina S.A. (Bunge Global SA) anchor the merchant tier by expanding crushing plants that integrate biodiesel streams, capturing value beyond raw bean exports and allowing steadier margins even when flat prices curb trading spreads. Together with COFCO International Argentina S.A. (COFCO International), Adecoagro S.A., and Los Grobo Agropecuaria S.A. (Grupo Los Grobo S.A.), the top five hold a significant share of sector revenue.
Adecoagro S.A. blends crops, dairy, and sugar across 240,000 hectares, using regenerative grazing to cut fertilizer spending by 22% and to lift EBITDA to USD 142 million in Q3 2024. Bioceres Crop Solutions Corp. monetizes HB4 drought-tolerant traits that deliver 20-43% yield gains in dry plots, with Brazil’s 2024 approval unlocking a 40 million-hectare regional market. Asociación de Cooperativas Argentinas aggregates smallholder grain and input purchases, securing 8-12% discounts that loosen the grip of multinational input firms.
Growth strategies pivot on traceability premiums and technology adoption. Cargill Argentina’s USD 85 million plant upgrade boosts soybean processing by 1,200 metric tons per day, while COFCO International Argentina S.A. (COFCO International) adds 150,000 metric tons of silo space at Timbúes to cut truck wait times during harvest peaks. Los Grobo’s contract-farming network spreads risk for smallholders, and Syngenta Argentina’s longer-acting insecticide aims to slow corn-leafhopper cycles. As blockchain and climate-smart tools are concentrated among farms of 1,000 hectares or more, the sector is likely to consolidate further unless co-ops scale digital services for smaller members.
Recent Industry Developments
- December 2025: The Indian Council of Agricultural Research and Argentina’s National Institute of Agricultural Technology signed the ICAR-INTA Work Plan 2025-2027, launching joint programs in sustainable agronomy, digital agriculture, crop biotechnology, and wide-ranging germplasm exchange for soybean, maize, sunflower, citrus, and other priority crops.
- December 2025: Banco Santander Argentina and Grupo Financiero Galicia enlarged their joint ag-finance platform Nera, forecasting USD 1.5 billion in farm credit lines by 2026 as recent export-tariff cuts spur growers to invest in upgraded seed, fertilizer, and crop-protection technology.
- March 2025: African Agricultural Technology Foundation (AATF) and Argentine biotech firm Bioheuris signed a multi-year memorandum of understanding to co-develop genome-edited soybean and wheat lines for smallholder farmers across sub-Saharan Africa, pairing Bioheuris’s Clustered Regularly Interspaced Short Palindromic Repeats (CRISPR)-based herbicide-tolerance traits with African Agricultural Technology Foundation (AATF’s) regional regulatory and seed-distribution networks.
Research Methodology Framework and Report Scope
Market Definitions and Key Coverage
Our study defines Argentina's agriculture market as the annual farm-gate value generated from crop cultivation and livestock husbandry, expressed in constant 2024 US dollars. Coverage spans cereals, oilseeds, pulses, fruits, vegetables, forage crops, turf, ornamentals, cattle, poultry, swine, dairy, sheep, and related live animal outputs.
Scope Exclusions: Produce that undergoes industrial processing or packaging after harvest, such as flour, ethanol, canned corn, or beef patties, is not counted.
Segmentation Overview
- By Crop Type
- Cereals and Grains
- Production Analysis (Volume)
- Overview
- Area Harvested and Yield
- Consumption Analysis (Value and Volume)
- Trade Analysis (Value and Volume)
- Import Market Analysis
- Overview
- Key Supplying Markets
- Export Market Analysis
- Overview
- Key Destinations Markets
- Import Market Analysis
- Wholesale Price Trend Analysis and Forecast
- Seasonality Analysis
- Production Analysis (Volume)
- Oilseeds and Pulses
- Production Analysis (Volume)
- Overview
- Area Harvested and Yield
- Consumption Analysis (Value and Volume)
- Trade Analysis (Value and Volume)
- Import Market Analysis
- Overview
- Key Supplying Markets
- Export Market Analysis
- Overview
- Key Destinations Markets
- Import Market Analysis
- Wholesale Price Trend Analysis and Forecast
- Seasonality Analysis
- Production Analysis (Volume)
- Fruits
- Production Analysis (Volume)
- Overview
- Area Harvested and Yield
- Consumption Analysis (Value and Volume)
- Trade Analysis (Value and Volume)
- Import Market Analysis
- Overview
- Key Supplying Markets
- Export Market Analysis
- Overview
- Key Destinations Markets
- Import Market Analysis
- Wholesale Price Trend Analysis and Forecast
- Seasonality Analysis
- Production Analysis (Volume)
- Vegetables
- Production Analysis (Volume)
- Overview
- Area Harvested and Yield
- Consumption Analysis (Value and Volume)
- Trade Analysis (Value and Volume)
- Import Market Analysis
- Overview
- Key Supplying Markets
- Export Market Analysis
- Overview
- Key Destinations Markets
- Import Market Analysis
- Wholesale Price Trend Analysis and Forecast
- Seasonality Analysis
- Production Analysis (Volume)
- Cash Crops
- Production Analysis (Volume)
- Overview
- Area Harvested and Yield
- Consumption Analysis (Value and Volume)
- Trade Analysis (Value and Volume)
- Import Market Analysis
- Overview
- Key Supplying Markets
- Export Market Analysis
- Overview
- Key Destinations Markets
- Import Market Analysis
- Wholesale Price Trend Analysis and Forecast
- Seasonality Analysis
- Production Analysis (Volume)
- Turf and Ornamentals
- Production Analysis (Volume)
- Overview
- Area Harvested and Yield
- Consumption Analysis (Value and Volume)
- Trade Analysis (Value and Volume)
- Import Market Analysis
- Overview
- Key Supplying Markets
- Export Market Analysis
- Overview
- Key Destinations Markets
- Import Market Analysis
- Wholesale Price Trend Analysis and Forecast
- Seasonality Analysis
- Production Analysis (Volume)
- Cereals and Grains
Detailed Research Methodology and Data Validation
Primary Research
Our analysts interview provincial agronomists, cooperative board members across the Pampas, and senior grain traders in Rosario's export corridor. Short web surveys of mid-size growers in Córdoba, Santa Fe, and Chaco validate yield shifts, input cost inflation, and acreage intentions that secondary data alone cannot reveal.
Desk Research
We begin by extracting production, trade, and price series from INDEC's agriculture directorate, FAOSTAT, USDA FAS PSD, Rosario Grains Exchange bulletins, and the National Meteorological Service rainfall archive. Company 10-Ks, tariff gazettes, Central Bank FX tables, and patent filings on bio-inputs deepen our supply and cost picture, while D&B Hoovers offers revenue splits for key agribusiness entities. These examples illustrate, not exhaust, the broad secondary source set the Mordor team reviews before modeling.
Market-Sizing & Forecasting
Mordor's model starts with a top-down rebuild of national output. Harvested area by crop multiplied by average yield provides tonnage that, when paired with farm-gate prices, yields the base pool. Livestock headcounts multiplied by carcass or milk output expand the estimate. Select bottom-up checks, such as elevator throughput and sampled average selling price multiplied by volume from ten cooperatives, refine totals. Key variables include rainfall anomalies, export duty schedules, soybean-corn rotation economics, fertilizer affordability, peso depreciation, and mechanization uptake. A five-factor regression projects volume, ARIMA smooths price series, and scenario layers test shocks such as policy reversals or severe drought.
Data Validation & Update Cycle
Outputs pass three filters: reconciliation with FAOSTAT and WTO receipts, variance thresholds within Mordor's Factiva-supported benchmark panel, and peer review by senior domain leads. The model is refreshed each quarter for material events and fully updated every twelve months before publication.
Why Mordor's Argentina Agriculture Baseline Commands Reliability
Published estimates often diverge because firms slice the sector differently, time-stamp data at varied FX rates, or leave key assumptions untested.
Gaps surface quickly: some publishers bundle agro-processing and input sales, others stop at four major crops, and a few convert peso values at parallel market rates. According to Mordor Intelligence, the 2025 farm-gate market equals USD 26.20 billion, built on transparent scope choices and an updated peso path, whereas other figures widen or narrow the net and overlook recent drought recoveries.
Benchmark comparison
| Market Size | Anonymized source | Primary gap driver |
|---|---|---|
| USD 26.20 B (2025) | Mordor Intelligence | N/A |
| USD 35.60 B (2023) | Global Consultancy A | Includes processing and agribusiness services; mixes producer and wholesale prices |
| USD 26.00 B (2024) | Regional Consultancy B | Omits livestock; retains drought-era yields without revision |
| USD 25.00 B growth (2025-29) | Trade Journal C | Reports cumulative growth, not baseline; scope and FX path unclear |
The comparison shows that once scope, exchange rate, and event updates are aligned, Mordor's balanced middle path offers a dependable benchmark that decision-makers can trace back to clear variables and repeatable steps.
Need A Different Region or Segment?
Customize Now
Key Questions Answered in the Report
How large is the Argentina agriculture market in 2026?
It is valued at USD 28.4 billion in 2026 and is set to reach USD 35.4 billion by 2031.
What is the projected CAGR for Argentine farm produce between 2026 and 2031?
The market is forecast to expand at 4.5% each year over the period.
Which crop type holds the largest share of revenue?
Cereals and Grains command 43% of value, driven by corn and wheat exports.
Which crop type is growing the fastest?
Fruits lead growth at a 4.8% CAGR through 2031, helped by lemons and blueberries.
How concentrated is the competitive environment?
The top five merchants account for a significant share of Argentina Agriculture market revenue, indicating moderate concentration.


