
Wind Turbine Blade Imaging Inspection Systems Market Size and Share
Market Overview
| Study Period | 2020 - 2031 |
|---|---|
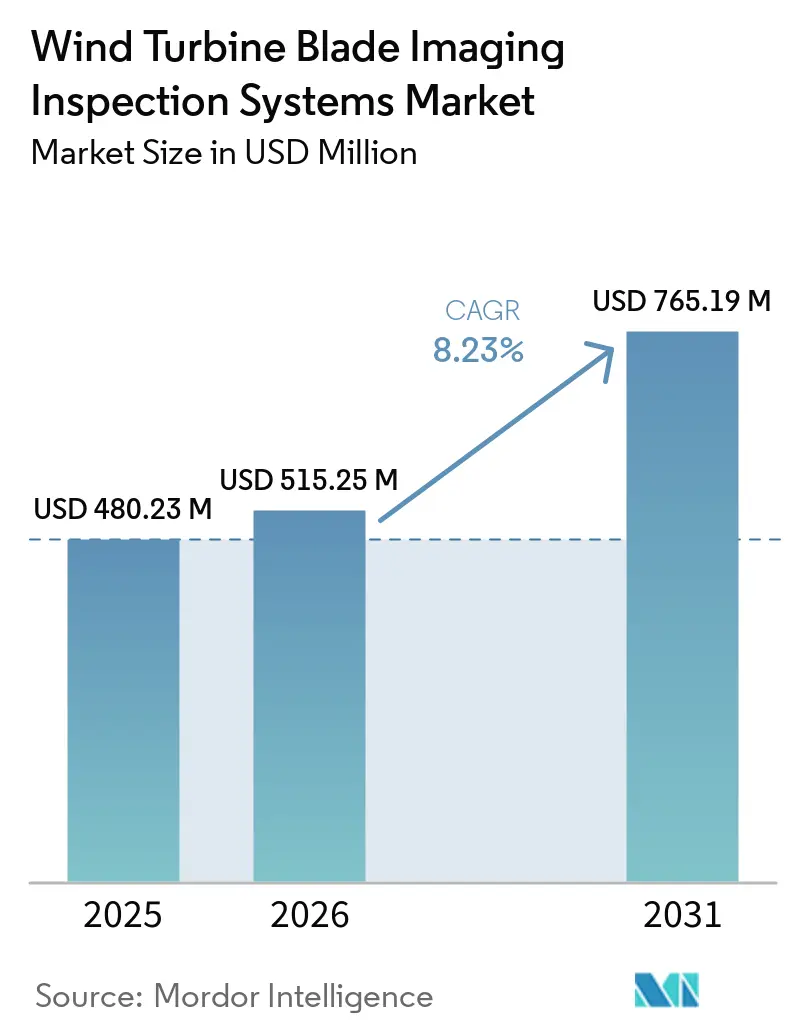
| Market Size (2026) | USD 515.25 Million |
| Market Size (2031) | USD 765.19 Million |
| Growth Rate (2026 - 2031) | 8.23 % |
| Fastest Growing Market | Asia-Pacific |
| Largest Market | Europe |
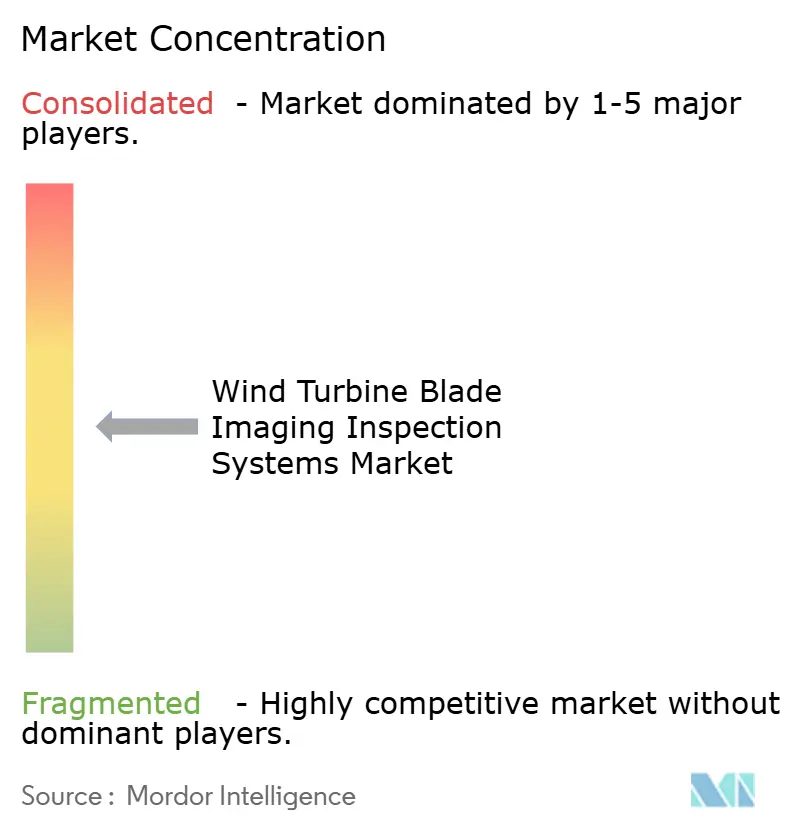
| Market Concentration | Medium |
Major Players *Disclaimer: Major Players sorted in no particular order Image © Mordor Intelligence. Reuse requires attribution under CC BY 4.0. | |
Wind Turbine Blade Imaging Inspection Systems Market Analysis by Mordor Intelligence
The wind turbine blade imaging inspection systems market size was USD 515.25 million in 2026 and is forecast to reach USD 765.19 million by 2031 at a CAGR of 8.23% over 2026-2031. The installed wind fleet expanded to more than 1,245 GW by mid-2025, which increased the inspection base. Older turbines need more frequent blade checks as erosion, delamination, bonding-line defects, and root-zone damage become more likely. Operators are extending usable asset life, which makes condition data relevant to maintenance and investment decisions. Offshore projects require more specialized inspections because access, weather, and platform movement complicate field work. Providers are responding with automated flights, internal crawlers, multi-sensor payloads, and analytics that convert repeatable image records into maintenance actions.
Key Report Takeaways
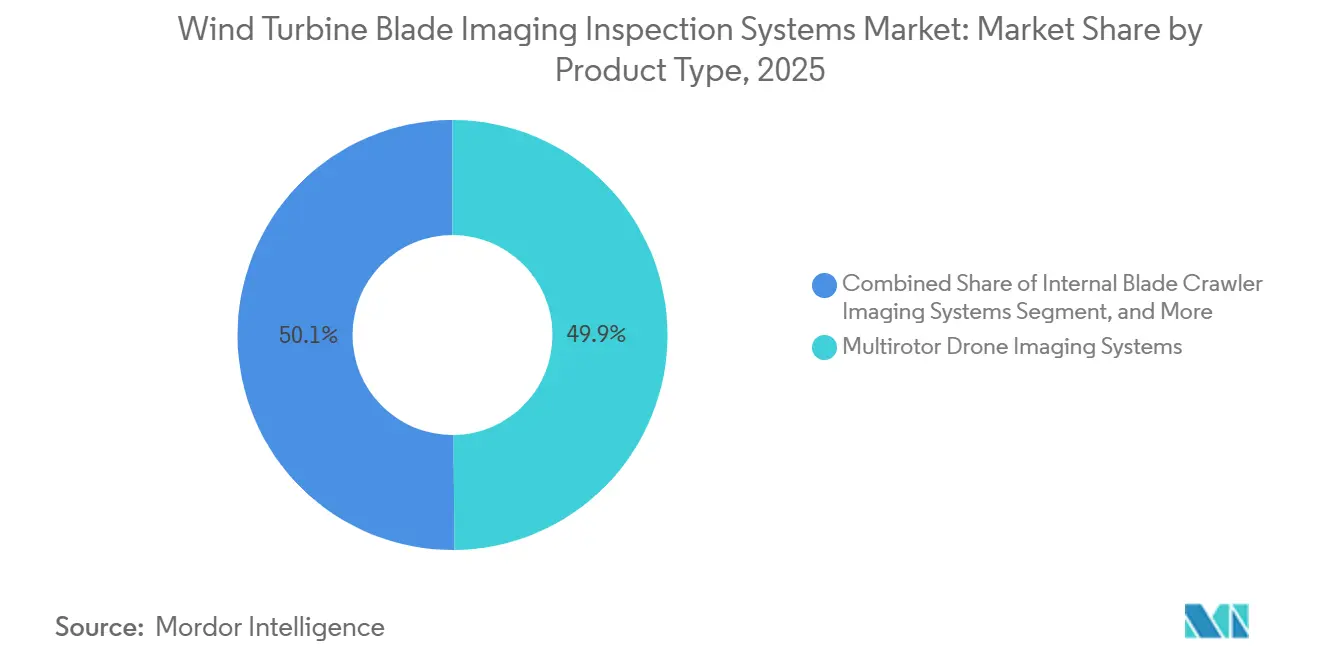
- By product type, Multirotor Drone Imaging Systems held 49.85% of the wind turbine blade imaging inspection systems market share in 2025, while Internal Blade Crawler Imaging Systems are projected to expand at a 9.67% CAGR through 2031.
- By sensor technology, RGB and High-Resolution Optical Sensors accounted for 41.30% of the wind turbine blade imaging inspection systems market share in 2025, while LiDAR Sensors are expected to expand at a 9.72% CAGR through 2031.
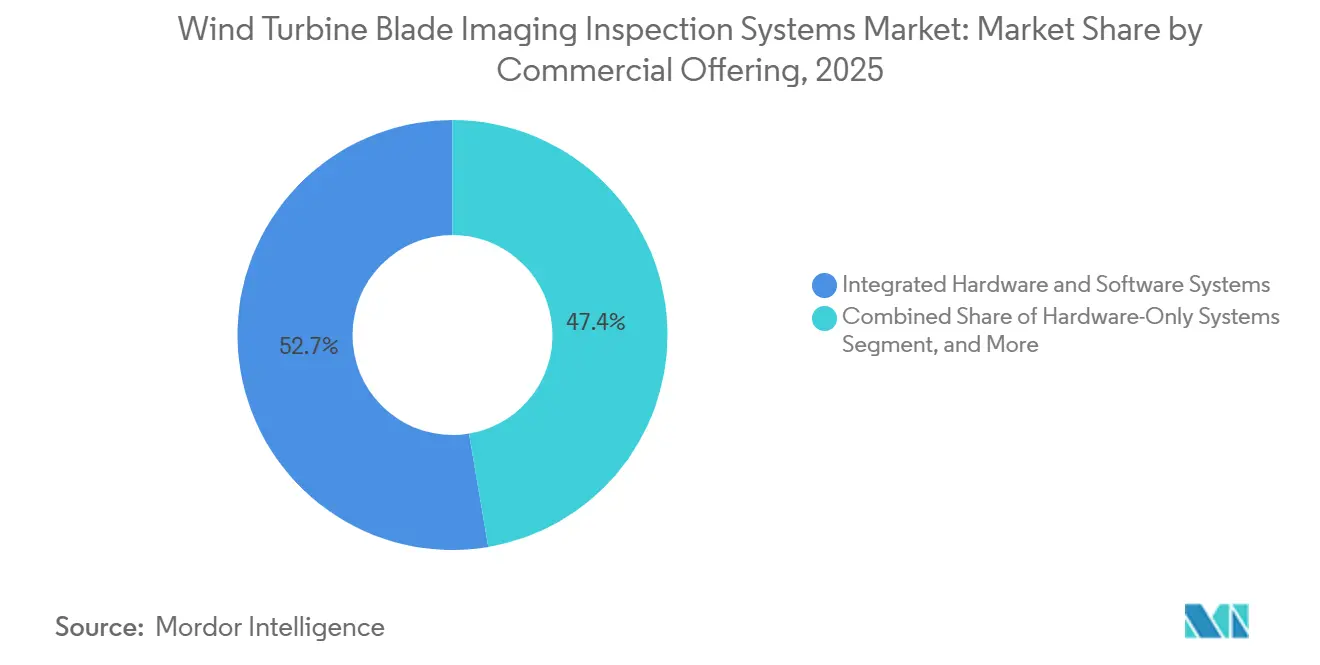
- By commercial offering, Integrated Hardware and Software Systems held 52.65% share in 2025, while Inspection Software and Analytics Platforms are projected to advance at a 9.83% CAGR through 2031.
- By end-user, Wind Farm Owners, Operators, Utilities, and Independent Power Producers represented 46.90% of demand in 2025, while Independent Service Providers are forecast to expand at a 9.64% CAGR through 2031.
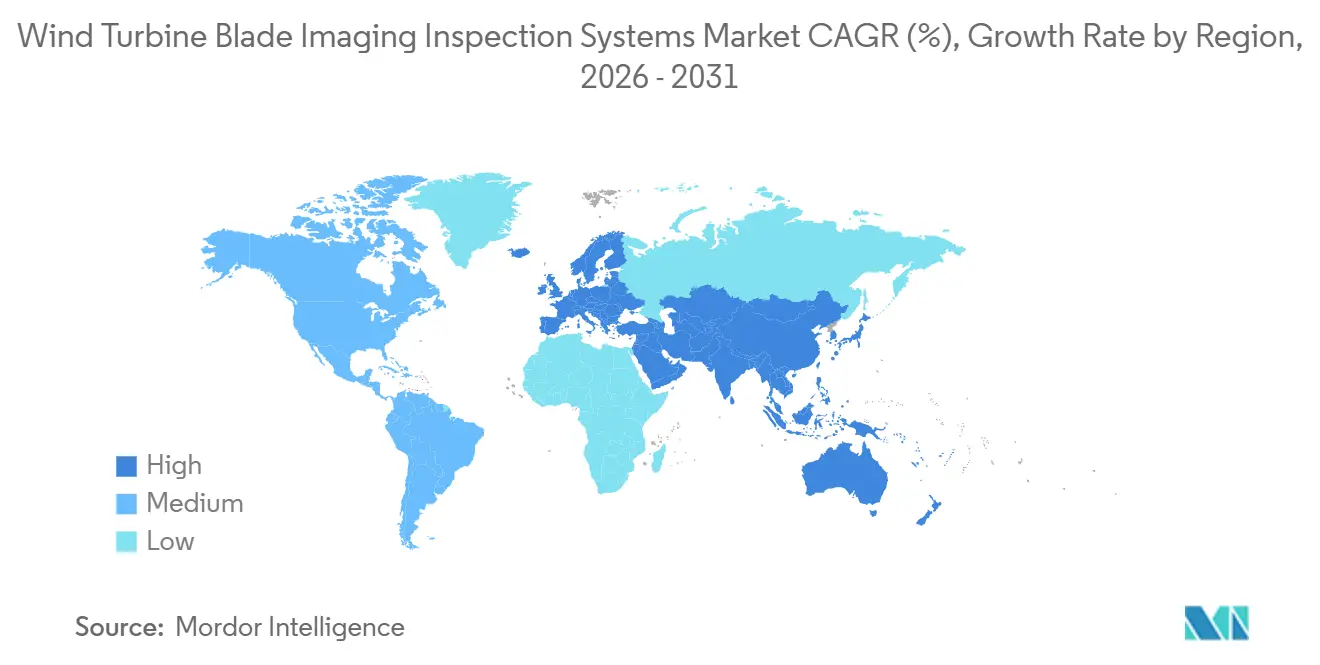
- By geography, Europe held 36.45% share in 2025, while Asia-Pacific is projected to expand at a 9.81% CAGR through 2031.
Note: Market size and forecast figures in this report are generated using Mordor Intelligence’s proprietary estimation framework, updated with the latest available data and insights as of January 2026.
Global Wind Turbine Blade Imaging Inspection Systems Market Trends and Insights
Drivers Impact Analysis*
| Driver | (~) % Impact on CAGR Forecast | Geographic Relevance | Impact Timeline |
|---|---|---|---|
| Expansion of Aging Wind Turbine Fleets | +2.4% | Global, with the highest concentration in Western Europe and North America | Medium Term (2-4 Years) |
| Rising Offshore Inspection Complexity | +1.8% | North Sea, including the UK, Germany, Denmark, and the Netherlands, and Asia-Pacific offshore markets | Long Term (≥ 4 Years) |
| Adoption of AI-Assisted Defect Recognition | +1.4% | Global, with early adoption in Europe and North America | Short Term (≤ 2 Years) |
| Demand for Reduced Turbine Downtime | +1.0% | Global, with the greatest intensity in offshore-focused markets | Short Term (≤ 2 Years) |
| Shift Toward Repeatable Digital Blade Records | +0.7% | Europe, North America, and China | Medium Term (2-4 Years) |
| Increasing Need for Internal Blade Imaging | +0.5% | Global, with growing use in Germany, the UK, and Asia-Pacific offshore projects | Medium Term (2-4 Years) |
| Source: Mordor Intelligence | |||
Expansion of Aging Wind Turbine Fleets
Global installed wind capacity exceeded 1,245 GW by mid-2025 and expanded at a 13.5% annual rate.[1]World Wind Energy Association, “WWEA Half-Year Report 2025: Global Wind Power Growth,” WWEA, wwindea.org. Many onshore turbines installed from 2005 to 2015 have reached an age when blade degradation, including leading-edge erosion and subsurface delamination, requires closer attention. Leading-edge erosion can reduce aerodynamic efficiency after 5-8 years and damage can accelerate after 10 years. Wind farms in Germany, Denmark, and the U.S. Midwest had average ages above 12 years. The wind turbine blade imaging inspection systems market benefits because operators use survey and crawler data to support life-extension decisions. This practice places inspection records alongside remaining-useful-life assessments, financial planning, and maintenance planning rather than treating them only as compliance documentation.
Rising Offshore Inspection Complexity
Offshore inspection costs per turbine were 2.5-3.5 times higher than comparable onshore services in the wind turbine blade imaging inspection systems market in 2026. Maritime access, equipment stabilization, vessel logistics, platform motion, and limited weather windows increase the work required at sea. Rope-access work can take 6-10 hours or several days for a floating turbine.[2]X. Lin et al., “CEA-DETR: A Multi-Scale Feature Fusion-Based Method for Wind Turbine Blade Surface Defect Detection,” Sensors, mdpi.com. North Sea offshore capacity exceeded 32 GW in 2025, sustaining demand for higher-value inspection work. Floating platforms require UAV flight systems that account for hull motion. This need favors providers that can combine hull-motion compensation, flight control, imaging, and offshore operating experience in the wind turbine blade imaging inspection systems market.
Adoption of AI-Assisted Defect Recognition
AI-assisted recognition moves analyst effort from reviewing every image toward reviewing exceptions. RCS-YOLOv8 recorded 90.3% mAP and 87.5% recall across 7 blade-defect classes in 2026. CEA-DETR reached 89.4% mAP@50 while reducing computational cost by 20.1%, supporting onboard drone use. A hybrid CNN-GRU approach achieved 95.67% accuracy in defect severity grading.[3]R. Pratt et al., “Hybrid CNN-GRU Framework for Wind Turbine Blade Defect Classification and Data-Driven Severity Assessment for Predictive Maintenance,” Discover Applied Sciences, link.springer.com. Larger labeled inspection archives can improve model training, severity assessment, and model reliability, creating a lasting advantage for established providers. The wind turbine blade imaging inspection systems market therefore places greater value on labeled data and reliable defect classification.
Demand for Reduced Turbine Downtime
Inspection downtime creates lost generation revenue and adds mobilization costs. RES Digital Solutions launched Smart Pilot for inspection within a single turbine stop. RES stated that the software significantly reduced inspection time compared with conventional methods and operated on standard DJI hardware. Quali Drone and RWE completed an autonomous offshore inspection with operating turbines and rotating blades. Research indicated that drone inspection could reduce per-turbine inspection time from several hours to less than an hour while detecting a high proportion of defects. Faster work supports more frequent inspections and makes automated methods more relevant across the wind turbine blade imaging inspection systems market.
Restraints Impact Analysis*
| Restraint | (~) % Impact on CAGR Forecast | Geographic Relevance | Impact Timeline |
|---|---|---|---|
| Beyond Visual Line of Sight Approval Constraints | -1.6% | North America, the EU, and the UK | Medium Term (2-4 Years) |
| Image Quality Degradation in Harsh Weather | -1.0% | Offshore markets, typhoon-exposed Asia-Pacific, and high-altitude South American corridors | Short Term (≤ 2 Years) |
| Shortage of Qualified Blade-Data Analysts | -0.7% | Global, particularly fast-expanding South American and Asia-Pacific markets | Long Term (≥ 4 Years) |
| Fragmented Defect Taxonomies and Data Standards | -0.5% | Global, particularly cross-border contracts | Long Term (≥ 4 Years) |
| Source: Mordor Intelligence | |||
Beyond Visual Line of Sight Approval Constraints
Routine beyond visual line of sight operations are important for remote and offshore inspection programs. The FAA published its proposed Part 108 rule on August 7, 2025, under Executive Order 14307. The proposed approach uses performance-based requirements, but the rule remained under White House review as of September 2026. Operators therefore continued to depend on case-by-case waivers in the United States. The UK Civil Aviation Authority introduced an atypical air environment policy for drone infrastructure inspections. These policies are developing, but they do not yet provide a predictable operating basis for large fleet programs in the wind turbine blade imaging inspection systems market.
Image Quality Degradation in Harsh Weather
High winds, precipitation, and sea spray can limit optical and infrared imaging performance. China’s T/CES 315-2024 standard set 8 m/s as the maximum ambient wind speed for UAV blade inspection. The standard excludes operations in rain or snow, creating operational limits for the wind turbine blade imaging inspection systems market. Weathered blade coatings can also change thermal emissivity and weaken delamination signals. Dual-spectrum fusion methods are under development to improve defect diagnosis. Until all-weather systems are used widely, weather windows will limit inspection throughput in the wind turbine blade imaging inspection systems market.
*Our forecasts treat driver/restraint impacts as directional, not additive. The impact forecasts reflect baseline growth, mix effects, and variable interactions.
Segment Analysis
By Product Type: Multirotor Systems Lead While Crawlers Gain Attention
Internal Blade Crawler Imaging Systems are projected to expand at a 9.67% CAGR from 2026 to 2031. Their role reflects the need to assess structural conditions that are not visible from the blade exterior. Crawler platforms can use high-resolution cameras, 3D LiDAR, and internal lighting to record shear-web cracks, bondline failures, and root damage. Aerones introduced Crawler Gen 3 in December 2025 with coverage of up to 90% of the blade interior, a 360° 5K camera, and a 61MP root-zone lens. The InInspekt project launched an autonomous multi-sensor crawler prototype in February 2026 for internal defect detection.
Multirotor Drone Imaging Systems held 49.85% share in 2025. Their position in the wind turbine blade imaging inspection systems market reflects their use as the first inspection method across different hub heights and blade designs. They provide broad external coverage in the wind turbine blade imaging inspection systems market without the time and access requirements of rope work. Fixed-Wing and VTOL systems serve longer survey missions at large offshore farms where range per charge matters, while tethered, ground-based, climbing, and contact systems serve continuity testing and other tasks that need close physical sensor contact. Cornis received certification to operate Voliro T in May 2025, using optical, LiDAR, and electrical continuity sensors during one deployment.



By Sensor Technology: Optical Sensors Retain the Broadest Installed Role
LiDAR Sensors are projected to advance at a 9.72% CAGR from 2026 to 2031. Their growth is connected to the need for accurate 3D geometry in fatigue simulations. IEC 61400-23 Ed.4 published in May 2026 required digital twin-based fatigue simulation validation for offshore blade type certification. The requirement applies to certification submissions after Q3 2026. LiDAR-equipped platforms can supply geometry inputs more accurately than photogrammetric reconstruction.
RGB and High-Resolution Optical Sensors accounted for 41.30% share in 2025. Optical imaging aligns closely with visual inspection practices used by operations and maintenance teams. It also provides a lower hardware-cost baseline than several alternative sensing methods. Thermal and Infrared Sensors identify subsurface delamination through heat-signature differences that optical cameras cannot detect, while ultrasonic, phased-array, and shearography tools serve assignments requiring integrity validation for insurers or lenders. Electrical continuity and conductivity sensors support lightning protection system assessments in the wind turbine blade imaging inspection systems market under IEC 61400-24 requirements.
By Commercial Offering: Integrated Workflows Lead, Analytics Platforms Expand Fastest
Integrated Hardware and Software Systems held 52.65% of the commercial offering segment in 2025. Operators often prefer a single provider that can manage inspection, data transfer, and analysis. SkySpecs connects inspection information with SCADA, condition monitoring, and financial analytics through its Horizon platform. The approach can make a vendor relationship more persistent across inspection cycles. It also gives asset owners in the wind turbine blade imaging inspection systems market a clearer path from field images to maintenance planning.
Inspection Software and Analytics Platforms are expected to expand at a 9.83% CAGR through 2031. The wind turbine blade imaging inspection systems market is shifting toward analytics subscriptions as operators place more weight on structured inspection records. Standard DJI airframes can now support specialized applications, as shown by Smart Pilot. This puts pressure on providers whose offer is limited to hardware rather than workflow software, data management, and diagnostic outputs. Hardware-only systems remain relevant for operators with pilots and analytical teams in-house, while inspection-as-a-service models allow independent providers to absorb equipment costs and charge per blade assessed.
By End-User: Asset Owners Hold the Largest Demand Base
Wind Farm Owners, Operators, Utilities, and Independent Power Producers accounted for 46.90% of end-user demand in 2025. These organizations are responsible for blade integrity over an asset’s operating life. Project financing terms can require documented condition assessments. Their inspection procurement is therefore connected to maintenance schedules and financing obligations. This customer group remains central to recurring demand in the wind turbine blade imaging inspection systems market and its inspection-service base.
Independent Service Providers are forecast to expand at a 9.64% CAGR through 2031. Multi-sensor work creates room for specialists that can manage portfolios for several owners. Nearthlab and ONYX Insight partnered to offer autonomous drone inspection with predictive maintenance analytics in North America. Manufacturers use inspection tools during production quality checks and commissioning acceptance, while engineering, procurement, and construction companies buy inspections at project milestones. Insurers, certification organizations, and research institutions also use these systems for claims, validation, and model-training datasets.
Geography Analysis
Europe held 36.45% share in 2025. The region’s concentrated North Sea offshore fleet supported the wind turbine blade imaging inspection systems market with higher service costs than comparable onshore sites across the UK, Germany, Denmark, the Netherlands, and Belgium. The RePowerEU program targets 510 GW of renewable energy by 2030, supporting inspection needs from new assets and older fleets nearing their 20-year design-life threshold. IEC 61400-5:2020/AMD1:2025 and IEC 61400-23 Ed.4 strengthened the focus on blade testing and digital twin validation.
Asia-Pacific is projected to expand at a 9.81% CAGR from 2026 to 2031. China’s scale in onshore and offshore wind underpins demand, and its March 2025 life-extension guidance required condition-based preventive maintenance for qualifying wind farms. The guidance applied to the country’s large installed base commissioned before 2018. China also published T/SXKJFW 571-2026 in June 2026 for UAV-based resistance detection on wind turbine blades. Japan and South Korea are developing offshore programs as floating wind procurement advances, while price-sensitive ASEAN markets favor scalable software-led services.
North America combines an aging U.S. onshore fleet, including Midwest farms above 12 years on average, with new East Coast offshore projects that require regular condition checks. South America, led by Brazil and Argentina, has demand linked to renewable energy targets and high-capacity-factor corridors. Efficient, low-logistics inspection methods are relevant where access is difficult and wind corridors have high capacity factors. The Middle East and Africa remains earlier in development, with projects in Saudi Arabia, the United Arab Emirates (UAE), Turkey, and South Africa. UV exposure, salt spray, and extreme temperature swings can increase coating assessment needs and favor sensor payloads calibrated for these environments.

Competitive Landscape
The wind turbine blade imaging inspection systems market is moderately consolidated among specialist technology providers. Proprietary blade-image archives can become more valuable as they produce training data across repeated inspections. SkySpecs reported an inspection base above 270,000 turbines across 125 global customers when it raised USD 20 million in March 2025. Providers seek to integrate analytics with widely available hardware, establish long-term asset-owner agreements, and add sensor types for a combined inspection workflow. These approaches support recurring data collection and help retain customer relationships, while strategic activity also focuses on systems that can assess blade interiors.
Aerones released Crawler Gen 3 in December 2025, adding 3D LiDAR and adaptive LED lighting to its internal inspection equipment. InInspekt introduced its autonomous crawler project in February 2026, combining LiDAR, IMU, visual, and thermographic sensors. RES Digital Solutions introduced Smart Pilot in June 2026, using standard DJI hardware for automated data capture. These moves show that the wind turbine blade imaging inspection systems market includes internal diagnostics, hardware integration, data capture, and software-focused approaches.
AI developers can enter through analytics software without owning aircraft, while drone manufacturers can provide the airframe for specialist workflows and defect models. Onboard classification can shorten the interval between data collection and assessment, and crawler systems can challenge exterior-drone specialists because they examine internal damage. The new IEC certification requirements also create a reason for LiDAR-capable platforms to be adopted or upgraded. A market concentration score of 5 reflects a moderately concentrated specialist tier, but no combined top-player share was provided and regional hardware and analytics firms still compete in distinct niches.
Wind Turbine Blade Imaging Inspection Systems Industry Leaders
SkySpecs Inc.
Clobotics Corporation
Cyberhawk Innovations Limited
Sulzer & Schmid Laboratories AG
Nearthlab Co., Ltd.
- *Disclaimer: Major Players sorted in no particular order

Recent Industry Developments
- June 2026: Smart Pilot was launched by RES Digital Solutions for automated wind blade inspection in a single turbine stop. The platform ran on standard DJI hardware and reduced inspection time by 25% versus conventional methods.
- May 2026: IEC 61400-23 Ed.4 was published on May 14, 2026. The standard made digital twin-based fatigue simulation validation compulsory for offshore blade type certification submissions after Q3 2026.
- February 2026: The InInspekt consortium launched an autonomous in-blade crawler. It integrated LiDAR, IMU, visual and thermographic sensors, and AI-driven data fusion for internal defect detection.
- January 2026: Quali Drone, RWE, and partners completed autonomous offshore blade inspections with turbines operating and blades rotating. The demonstration removed planned downtime from the inspection cycle.


Global Wind Turbine Blade Imaging Inspection Systems Market Report Scope
The Wind Turbine Blade Imaging Inspection Systems Market refers to the industry focused on imaging-based inspection technologies and systems used to assess the condition, structural integrity, and performance of wind turbine blades throughout their lifecycle.
The Wind Turbine Blade Imaging Inspection Systems Market Report is Segmented by Product Type (Multirotor Drone Imaging Systems, Fixed-Wing and VTOL Imaging Systems, Tethered and Ground-Based Imaging Systems, Internal Blade Crawler Imaging Systems, External Robotic Climbing and Contact-Imaging Systems, and Other Product Types), Sensor Technology (RGB and High-Resolution Optical Sensors, Thermal and Infrared Sensors, LiDAR Sensors, Ultrasonic and Phased-Array Sensors, Electrical Continuity and Conductivity Sensors, and Shearography and Other Non-Destructive Testing Sensors), Commercial Offering (Integrated Hardware and Software Systems, Hardware-Only Systems, Inspection Software and Analytics Platforms, and Other Commercial Offerings), End-User (Wind Farm Owners, Operators, Utilities, and Independent Power Producers, Independent Service Providers, Wind Turbine Manufacturers, Engineering, Procurement, and Construction Companies, and Other End Users), and Geography (North America, South America, Europe, Asia-Pacific, and Middle East and Africa). The Market Forecasts are Provided in Terms of Value (USD).
| Multirotor Drone Imaging Systems |
| Fixed-Wing and VTOL Imaging Systems |
| Tethered and Ground-Based Imaging Systems |
| Internal Blade Crawler Imaging Systems |
| External Robotic Climbing and Contact-Imaging Systems |
| Other Product Types |
| RGB and High-Resolution Optical Sensors |
| Thermal and Infrared Sensors |
| LiDAR Sensors |
| Ultrasonic and Phased-Array Sensors |
| Electrical Continuity and Conductivity Sensors |
| Shearography and Other Non-Destructive Testing Sensors |
| Integrated Hardware and Software Systems |
| Hardware-Only Systems |
| Inspection Software and Analytics Platforms |
| Other Commercial Offerings |
| Wind Farm Owners, Operators, Utilities, and Independent Power Producers |
| Independent Service Providers |
| Wind Turbine Manufacturers |
| Engineering, Procurement, and Construction Companies |
| Other End-Users |
| North America | United States | |
| Canada | ||
| Mexico | ||
| South America | Brazil | |
| Argentina | ||
| Rest of South America | ||
| Europe | Germany | |
| United Kingdom | ||
| France | ||
| Italy | ||
| Spain | ||
| Rest of Europe | ||
| Asia-Pacific | China | |
| Japan | ||
| India | ||
| South Korea | ||
| ASEAN | ||
| Rest of Asia-Pacific | ||
| Middle East and Africa | Middle East | Saudi Arabia |
| United Arab Emirates | ||
| Turkey | ||
| Rest of the Middle East | ||
| Africa | South Africa | |
| Nigeria | ||
| Rest of Africa | ||
| By Product Type | Multirotor Drone Imaging Systems | ||
| Fixed-Wing and VTOL Imaging Systems | |||
| Tethered and Ground-Based Imaging Systems | |||
| Internal Blade Crawler Imaging Systems | |||
| External Robotic Climbing and Contact-Imaging Systems | |||
| Other Product Types | |||
| By Sensor Technology | RGB and High-Resolution Optical Sensors | ||
| Thermal and Infrared Sensors | |||
| LiDAR Sensors | |||
| Ultrasonic and Phased-Array Sensors | |||
| Electrical Continuity and Conductivity Sensors | |||
| Shearography and Other Non-Destructive Testing Sensors | |||
| By Commercial Offering | Integrated Hardware and Software Systems | ||
| Hardware-Only Systems | |||
| Inspection Software and Analytics Platforms | |||
| Other Commercial Offerings | |||
| By End-User | Wind Farm Owners, Operators, Utilities, and Independent Power Producers | ||
| Independent Service Providers | |||
| Wind Turbine Manufacturers | |||
| Engineering, Procurement, and Construction Companies | |||
| Other End-Users | |||
| By Geography | North America | United States | |
| Canada | |||
| Mexico | |||
| South America | Brazil | ||
| Argentina | |||
| Rest of South America | |||
| Europe | Germany | ||
| United Kingdom | |||
| France | |||
| Italy | |||
| Spain | |||
| Rest of Europe | |||
| Asia-Pacific | China | ||
| Japan | |||
| India | |||
| South Korea | |||
| ASEAN | |||
| Rest of Asia-Pacific | |||
| Middle East and Africa | Middle East | Saudi Arabia | |
| United Arab Emirates | |||
| Turkey | |||
| Rest of the Middle East | |||
| Africa | South Africa | ||
| Nigeria | |||
| Rest of Africa | |||


Key Questions Answered in the Report
What was the 2026 value of wind turbine blade imaging inspection systems?
The Wind Turbine Blade Imaging Inspection Systems Market size was USD 515.25 Million in 2026 and is forecast to reach USD 765.19 Million by 2031 at an 8.23% CAGR. The forecast reflects demand for external drone surveys, internal crawler diagnostics, LiDAR-based geometry capture, and software-supported review of blade records.
What is driving demand for wind turbine blade imaging inspection systems?
Aging fleets, offshore inspection requirements, AI-enabled defect recognition, and the need to reduce turbine downtime support demand. Life-extension programs also require condition records that can support maintenance choices and remaining-useful-life evaluations.
Which product type led blade imaging inspection systems in 2025?
Multirotor Drone Imaging Systems led with a 49.85% share in 2025 because they support broad, flexible external inspections. They can inspect diverse hub heights and blade geometries without the access burden associated with rope-based approaches.
Which sensor technology is expected to expand the fastest through 2031?
LiDAR Sensors are projected to expand at a 9.72% CAGR, supported by demand for accurate 3D geometry and digital twin validation. The technology is particularly relevant where offshore certification work requires detailed spatial inputs for fatigue simulations.
Which region has the largest demand for blade imaging inspection systems?
Europe held a 36.45% share in 2025, supported by concentrated North Sea offshore capacity and established inspection requirements. The region also has aging fleets that need recurring external and internal condition assessment.
What limits wider use of drone-based blade inspections?
Beyond Visual Line of Sight approvals and weather-related image quality limitations can constrain inspection programs and field throughput. High winds, rain, snow, sea spray, and uneven thermal signatures can limit when reliable image capture is possible.
Page last updated on:





