
Urban Design Market Size and Share
Market Overview
| Study Period | 2020 - 2031 |
|---|---|
| Market Size (2026) | USD 79.01 Billion |
| Market Size (2031) | USD 114.80 Billion |
| Growth Rate (2026 - 2031) | 7.80 % |
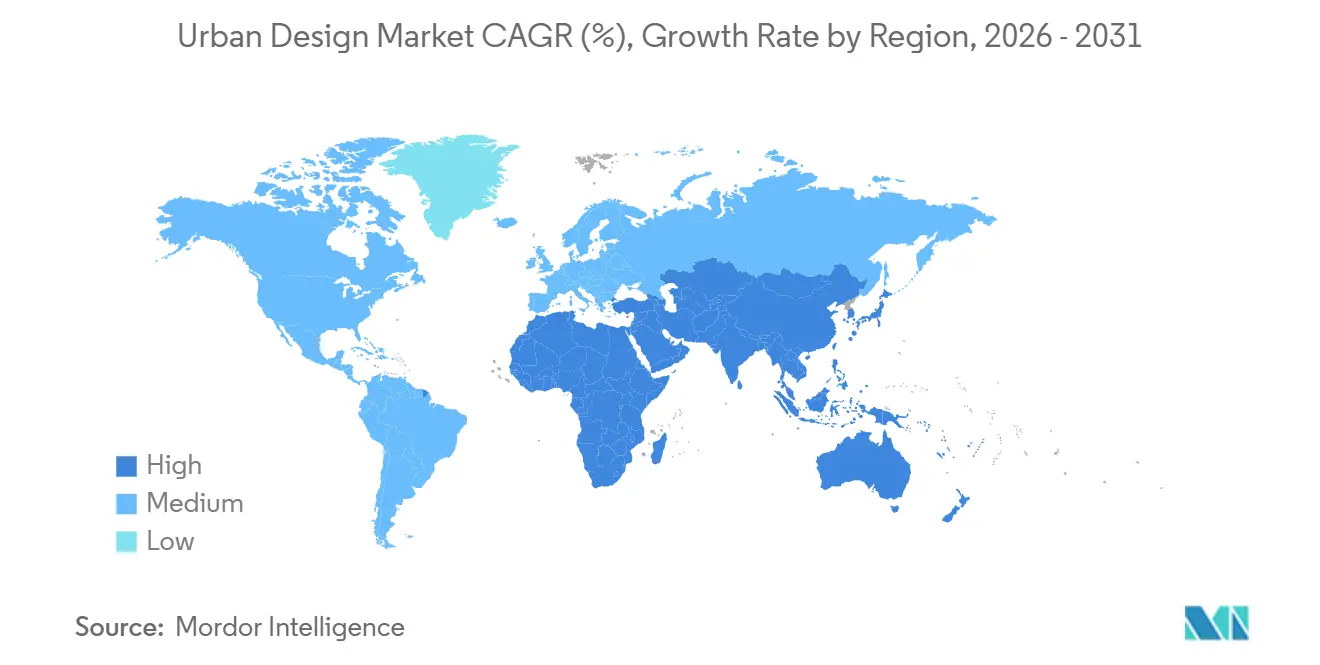
| Fastest Growing Market | Middle East and Africa |
| Largest Market | Asia-Pacific |
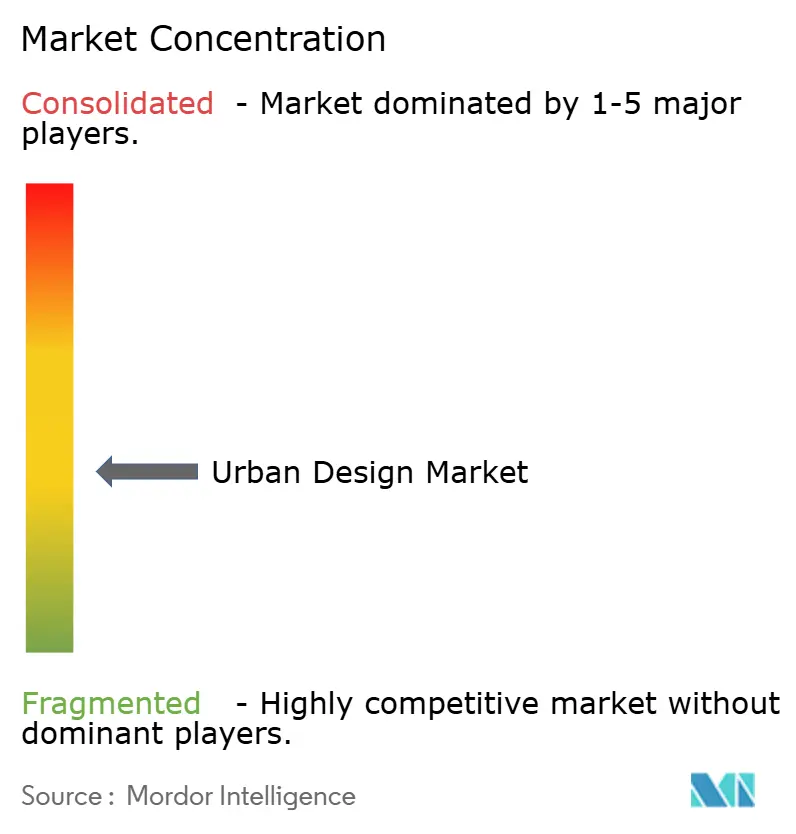
| Market Concentration | Medium |
Major Players *Disclaimer: Major Players sorted in no particular order Image © Mordor Intelligence. Reuse requires attribution under CC BY 4.0. | |
Urban Design Market Analysis by Mordor Intelligence
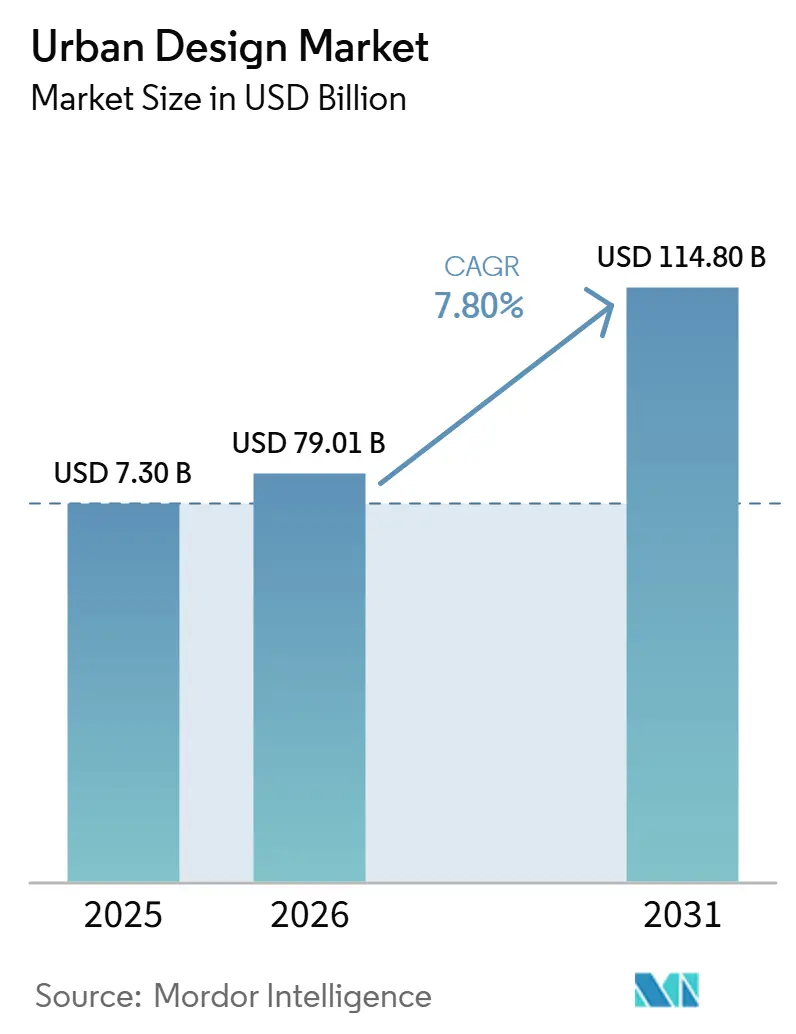
The Urban Design Market size is expected to grow from USD 74.5 billion in 2025 to USD 79.01 billion in 2026 and is forecast to reach USD 114.80 billion by 2031 at 7.80% CAGR over 2026-2031. The urban design market is supported by the need to plan growing cities, renew older districts, and link development with transport and public services. The United Nations reported that cities housed 45% of the global population of 8.2 billion in 2025, and most population growth through 2050 is expected in urban areas[1] United Nations Department of Economic and Social Affairs, “World Urbanization Prospects: The 2025 Revision,” United Nations, un.org. This increases demand for master planning, land-use advice, and public realm design in mature and emerging economies. Work is shifting from new city construction to the regeneration of existing neighborhoods, which requires coordination across planning, mobility, public space, climate adaptation, and community needs. Firms with broad technical teams, strong local partnerships, and practical regulatory knowledge are positioned to compete for these assignments.
Key Report Takeaways
- By type, master planning and land-use planning held 31.6% of the urban design market share in 2025, while zoning, development control, and implementation advisory is forecast to grow at an 8.4% CAGR through 2031.
- By sector, mixed-use and township developments held 38.2% of the urban design market size in 2025, while Transportation and Infrastructure is forecast to grow at an 8.1% CAGR through 2031.
- By investor type, public clients accounted for 61.5% of revenue in 2025, while private investor clients are forecast to grow at a 7.8% CAGR through 2031.
- By geography, Asia-Pacific held 37.8% of revenue in 2025, while the Middle East and Africa is forecast to grow at an 8.9% CAGR through 2031.
Note: Market size and forecast figures in this report are generated using Mordor Intelligence’s proprietary estimation framework, updated with the latest available data and insights as of January 2026.
Global Urban Design Market Trends and Insights
Drivers Impact Analysis*
| Drivers | (~) % Impact on CAGR Forecast | Geographic Relevance | Impact Timeline |
|---|---|---|---|
| Urban Population Growth | +2.1% | Global, with peak intensity in South and Southeast Asia and Sub-Saharan Africa | Long term (≥ 4 years) |
| Secondary City Development | +2.0% | Asia-Pacific, especially ASEAN, Indonesia, Vietnam, and other emerging urban centers | Long term (≥ 4 years) |
| Urban Regeneration and Redevelopment | +1.9% | China, Europe, North America, and India | Medium term (2-4 years) |
| Infrastructure and Transit Investment | +1.7% | Asia-Pacific, Middle East and Africa, and North America | Medium term (2-4 years) |
| Climate-Resilient Urban Development | +1.3% | Global, with policy concentration in OECD economies, Brazil, and India | Long term (≥ 4 years) |
| Demand for Mixed-Use and Walkable Communities | +1.2% | North America, Europe, Gulf Cooperation Council countries, and East Asia | Short term (≤ 2 years) |
| Source: Mordor Intelligence | |||
Urban Population Growth
Urban population growth is expanding the need for planning, public-space design, land-use management, and infrastructure coordination. Cities housed 45% of the global population of 8.2 billion in 2025, and most population growth through 2050 is expected to occur in urban areas. This growth puts greater pressure on housing, mobility, public services, and climate adaptation systems. Municipal governments need long-term plans that guide development while protecting access to public facilities and essential infrastructure. The Urban Design Market benefits because planning requirements usually begin before construction, extending demand across the development cycle. Firms with experience in land-use policy, implementation planning, and public consultation can compete for broader assignments.
Secondary City Development
Secondary cities are becoming an important source of planning and design work as population and economic activity spread beyond major capitals. The UN Development Programme expects secondary cities to account for nearly 40% of Asia-Pacific GDP growth by 2030. The report also projects that more than 200 new cities could emerge in ASEAN by 2030. These locations often need support in establishing zoning systems, infrastructure priorities, and public realm standards. Their authorities may have ambitious development objectives but limited procurement and delivery capacity. This creates opportunities for firms that combine local regulatory knowledge, stakeholder engagement, and practical master-planning capability.
Urban Regeneration and Redevelopment
Urban regeneration is increasing as cities seek to improve existing districts rather than rely only on greenfield expansion. China formally published the Urban Renewal 15th Five-Year Plan in 2026, creating a national framework for urban renewal through 2030. The plan supports public-private partnership structures and REIT-based financing approaches for renewal programs. Redevelopment assignments can require more detailed coordination because they involve existing buildings, residents, infrastructure, and commercial activity. They also require careful phasing to maintain access and reduce disruption during construction. The Urban Design Market benefits from this complexity because advisory work can span from early land-use studies to implementation oversight.
Infrastructure and Transit Investment
Infrastructure investment creates demand for urban design when transport systems need connected stations, streets, public spaces, and development plans. Low- and middle-income economies in Asia-Pacific are expected to require USD 2.6 trillion each year for transport infrastructure between 2025 and 2035. The same outlook estimates that urban rapid-transit availability will rise from 8.5 km to 10.6 km per million urban residents by 2035. This limited increase indicates that many cities will continue to face a gap between urban growth and mobility capacity. The United Nations Decade of Sustainable Transport for 2026 to 2035 supports more integrated approaches to housing, public transport, and sustainable cities. Design firms can capture larger mandates when they connect transport planning with station-area development, walking routes, and zoning controls.
Restraints Impact Analysis*
| Restraints | (~) % Impact on CAGR Forecast | Geographic Relevance | Impact Timeline |
|---|---|---|---|
| Lengthy Approval and Zoning Processes | -1.0% | North America, South Korea, and emerging Asia-Pacific markets | Short term (≤ 2 years) |
| High Land, Infrastructure, and Financing Costs | -0.8% | North America, Europe, and core Asia-Pacific cities | Medium term (2-4 years) |
| Community Opposition and Stakeholder Conflicts | -0.5% | Global, with high intensity in the United States, United Kingdom, and European Union | Medium term (2-4 years) |
| Shortage of Qualified Urban Planning Professionals | -0.6% | Global, with acute need in Asia-Pacific and the Middle East and Africa | Long term (≥ 4 years) |
| Source: Mordor Intelligence | |||
Lengthy Approval and Zoning Processes
Long approval processes reduce revenue visibility in the urban design market by delaying later design phases and construction work. A 2026 Wisconsin Policy Forum study of 6 U.S. cities found that projects requiring zoning changes took a median of 510 days to reach construction, compared with 86 days for projects requiring staff-level review. The difference can make it harder for clients and consultants to forecast design schedules. Delays also arise outside the United States when rigid rules or stalled financing interrupt approved redevelopment work. Clients may limit the scope given to outside advisers until the regulatory path is clearer. Urban design market firms, therefore, need strong approval strategies, realistic schedules, and clear communication with public agencies.
High Land, Infrastructure, and Financing Costs
High land values, construction costs, and financing costs can make urban projects less feasible, especially where public realm and infrastructure needs are extensive. These costs may lead clients to defer or reduce mixed-use projects even when long-term demand is present. They can also direct capital toward larger, denser schemes because those projects are better able to absorb fixed costs. This can reduce the number of smaller commissions that support boutique planning and landscape practices. Community opposition can further extend project schedules when residents disagree over density, public benefits, traffic, or neighborhood change. The urban design industry also faces a shortage of professionals who understand design, planning law, environmental requirements, and public engagement, which limits delivery capacity.
*Our forecasts treat driver/restraint impacts as directional, not additive. The impact forecasts reflect baseline growth, mix effects, and variable interactions.
Segment Analysis
By Type: Zoning and Advisory Services Gaining Ground Against Traditional Master Planning
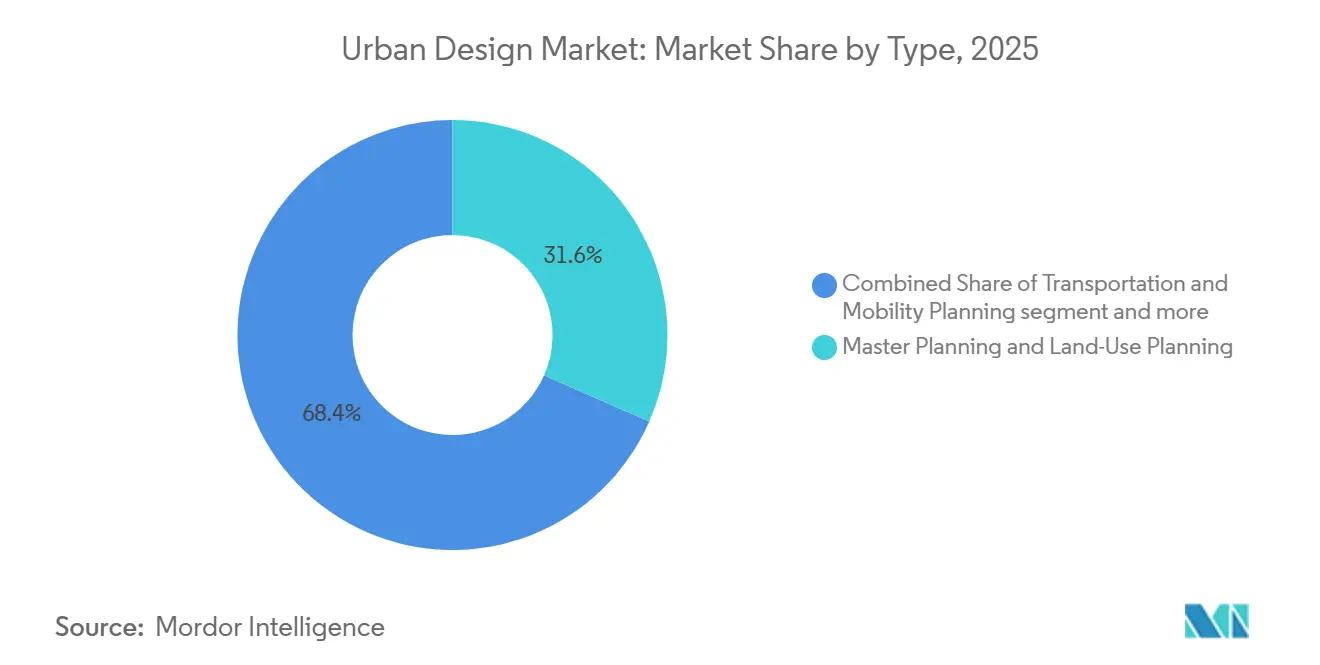
Master Planning and Land-Use Planning held 31.6% of revenue in 2025, making it the largest service category in the urban design market. The category remains central because metropolitan areas, new districts, and redevelopment programs need long-term land-use frameworks. Singapore’s 2025 Master Plan is now in implementation, underscoring the ongoing role of public planning frameworks in directing development. The Royal Commission for Riyadh City published design and architectural guidelines in June 2026 for a major commercial zone[2]Royal Commission for Riyadh City, “Design and Architectural Guidelines, Volume 1,” Royal Commission for Riyadh City, rcrc.gov.sa. The guidance covers building facades, pedestrian corridors, and public realm quality. Urban Design, Public Realm, and Landscape Design also serve cities that use place quality to support economic development, public health, and local identity.
Transportation and Mobility Planning gains from transit investment because routes, stations, and streets require coordinated land-use and public-space decisions. The Others category includes environmental impact planning, heritage conservation advice, and digital urban modeling. These services are used when clients need a broader assessment of risks and outcomes. Zoning, Development Control and Implementation Advisory is the fastest-growing service type, with an 8.4% CAGR through 2031. This part of the urban design market is growing because clients increasingly view zoning codes and design standards as tools that shape long-term outcomes. It also requires firms to connect regulatory rules with a workable delivery sequence. Implementation advisory is becoming more valuable where projects have multiple phases, owners, and public agencies.


By Sector: Mixed-Use Dominance Persists While Transit Projects Scale Up
Mixed-Use and Township Developments accounted for 38.2% of revenue in 2025. Cities often support these schemes because they can combine homes, workplaces, retail, services, and public space in one district. They can also support a stronger local tax base than single-use development. The public sector uses mixed-use plans to reduce dependence on long daily trips and to make transit investment more productive. Public, Civic, and Institutional Developments provide a stable demand base because they include public buildings, parks, cultural facilities, and community infrastructure. The Others category includes developing types such as net-zero industrial districts and health-oriented neighborhood design.
Transportation and Infrastructure is forecast to grow at an 8.1% CAGR through 2031, the fastest rate among sectors. More than 1,000 km of urban rail opened in 2025, and the supplied material noted a comparable volume was planned for 2026. Transport projects increasingly include station precincts, active travel routes, and transit-oriented development plans alongside physical infrastructure. This increases the scope of design work required around an infrastructure investment. The UN transport decade also supports attention to inclusive, safe, and sustainable urban mobility. The urban design market can capture this work when teams integrate mobility planning with local development rules and public-realm design.
By Investor Type: Private Capital Closing the Gap with Public Mandates
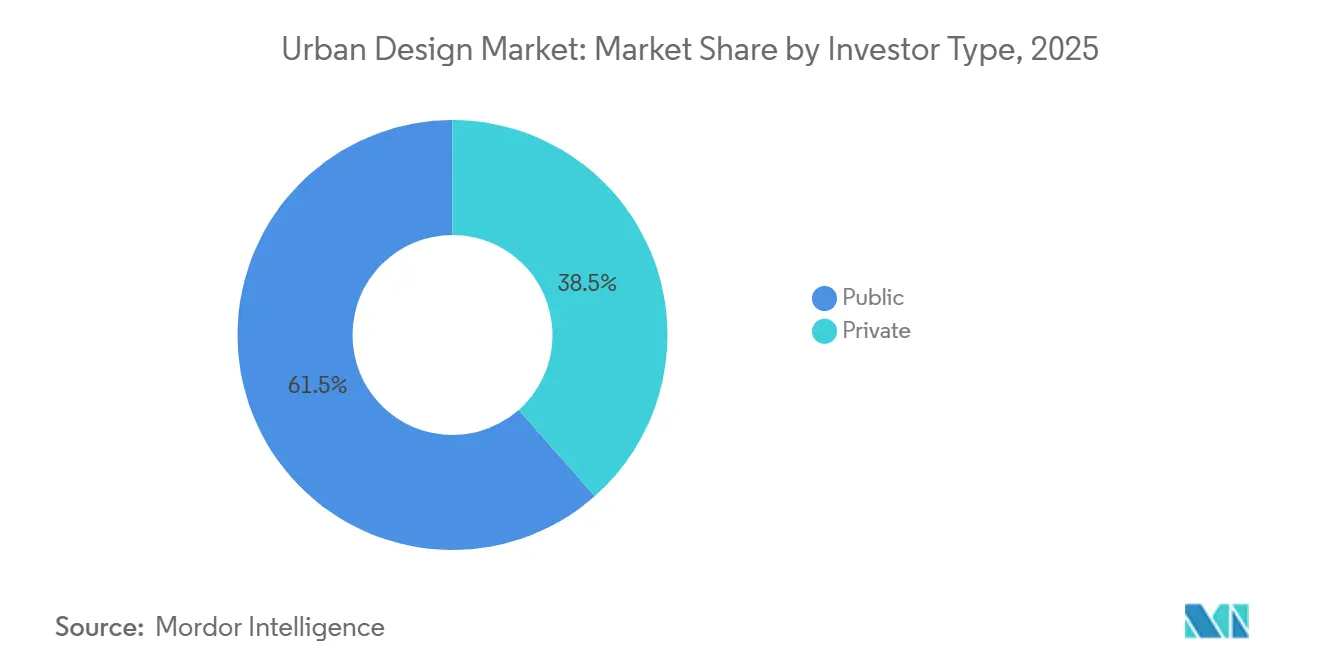
Public clients accounted for 61.5% of urban design market revenue in 2025. Governments remain the largest client group because they regulate land use, own infrastructure, and support public facilities and social housing. In the Gulf, China, and parts of Southeast Asia, some state-linked developers procure design services through commercial processes rather than standard lowest-bid methods. These assignments can have broader scopes because they involve large development programs and complex delivery arrangements. China’s 2026 urban renewal framework encourages public-private partnerships and REIT structures for renewal programs. This can widen the investor base for planning and design commissions.
Private investor clients are forecast to grow at a 7.8% CAGR through 2031. Private capital is seeking design advice to distinguish build-to-rent, senior living, and lifestyle-oriented mixed-use projects. Developers may prioritize higher-density and higher-quality schemes when construction and financing costs are high. That can increase the design input needed for each project even when the number of projects does not rise. Private clients also need clear advice on phasing, tenant appeal, access, and public approvals. The urban design market serves this need when advisory teams can translate planning goals into commercially workable places. Public and private demand can therefore overlap in regeneration areas where public infrastructure supports private development.
Geography Analysis
Asia-Pacific held 37.8% of the urban design market in 2025, the largest regional share. The region has a large pipeline of new and expanding cities, as well as extensive transport and renewal needs. The UN Development Programme projected that more than 200 new cities could emerge in ASEAN by 2030[3]United Nations Development Programme, “Transforming Urban Futures in Asia-Pacific,” United Nations Development Programme, undp.org. Secondary cities are especially important because many are establishing planning systems while managing rapid growth. China’s urban renewal plan provides a major national setting for retrofitting existing urban areas through 2030. Asia-Pacific’s transport funding gap also sustains planning work around mobility and land use.
The Middle East and Africa is forecast to grow at an 8.9% CAGR through 2031, the fastest regional rate in the urban design market. Gulf programs are generating large requirements for master planning, public realm design, mobility planning, and implementation advice. Saudi Arabia’s commercial development pipeline supports demand for workplace, mixed-use, and entertainment districts. In the United Arab Emirates, Marsa Al Saadiyat is advancing through enabling works and infrastructure in 2026. The project was announced with an investment value of USD 27.2 billion. In Africa, the ability to convert development plans into commissions will depend on project finance and local institutional capacity.
North America and Europe are mature regions where urban design market demand is often driven by regeneration complexity instead of project volume. Long approvals, high costs, and community concerns can slow delivery in these regions. At the same time, public agencies continue to procure planning, architecture, and infrastructure advice for renewal and civic projects. Brazil’s Green Resilient Cities Programme creates a national policy setting for climate-integrated planning. This can create opportunities for firms with Portuguese-language capability and climate planning experience. Across these regions, firms need to show that design proposals can meet public goals while remaining workable within approval and funding constraints.

Competitive Landscape
The urban design market has large integrated consultancies and specialist design practices with different competitive strengths. AECOM, Jacobs Solutions, WSP Global, Arcadis, and AtkinsRéalis compete through multidisciplinary services, geographic coverage, and delivery capacity. Their teams can combine planning, transport, water, engineering, architecture, and program management. AECOM reported a record backlog of USD 26.2 billion in its second-quarter fiscal 2026 results, along with a record design pipeline and strong client funding in transportation, water, and urban end markets. Arcadis reported net revenue of approximately USD 4.1 billion in 2025, free cash flow of approximately USD 311 million, and a backlog of approximately USD 3.9 billion. These indicators show why scale, financial capacity, and long client relationships remain important in major programs.
Specialist firms, including Gensler, HOK, Perkins&Will, Sasaki Associates, Gehl People, and Surbana Jurong, compete through local context, placemaking, design quality, and sector knowledge. These firms can be selected for prominent projects where cultural fit and public experience carry significant weight. Formal local partnerships can help international practices access early planning work in South and Southeast Asia. This approach can be more effective than relying only on a branch office because local studios often have established public-sector relationships. Implementation advice for large programs is a further area of competition because it combines phasing, community engagement, standards, and adaptive management. Compliance with frameworks such as ISO 37120 can influence tender assessments when clients require evidence of sustainable city outcomes.
Consolidation is also shaping the urban design market. WSP Global made a second unsolicited bid for Arcadis in July 2026, and Arcadis rejected the offer. The supplied material reported a bid value of USD 4.8 billion, and stated that Arcadis considered it to undervalue the company. AECOM and Jacobs Solutions were jointly appointed in November 2025 to provide design services for The Mukaab in Riyadh’s New Murabba development. Their remit includes infrastructure, road tunnels, wadi podiums, and public realm areas. These moves show that firms are seeking scale and major-program positions, while specialists continue to compete where local knowledge and design distinction matter.
Urban Design Industry Leaders
AECOM
Jacobs Solutions Inc.
WSP Global Inc.
Arcadis N.V.
Stantec Inc.
- *Disclaimer: Major Players sorted in no particular order

Recent Industry Developments
- July 2026: WSP Global made a second unsolicited takeover bid for Arcadis NV at approximately EUR 4.4 billion (USD 4.8 billion), or EUR 51.5 per share (USD 56.2 per share), which Arcadis’s executive and supervisory boards unanimously rejected, citing fundamental undervaluation. The bid underscores the intensifying consolidation pressure in the global urban design and engineering consultancy market.
- May 2026: AECOM raised its fiscal 2026 guidance following a record second-quarter fiscal 2026 backlog of USD 26.2 billion and double-digit design pipeline growth. The company reaffirmed long-term targets of a 20% or greater margin exit rate by fiscal 2028 and a 15% or greater CAGR in adjusted EPS from fiscal 2026 to fiscal 2029.
- February 2026: Arcadis reported full-year 2025 results including EUR 3.8 billion in net revenue (USD 4.1 billion), EUR 288 million in free cash flow (USD 314.2 million), and a EUR 3.6 billion backlog (USD 3.9 billion). The company announced a Capital Markets Day for November 2026 to unveil refreshed medium-term strategy and targets.


Global Urban Design Market Report Scope
| Master Planning and Land-Use Planning |
| Urban Design, Public Realm and Landscape Design |
| Transportation and Mobility Planning |
| Zoning, Development Control and Implementation Advisory |
| Others |
| Mixed-Use and Township Developments |
| Transportation and Infrastructure |
| Public, Civic and Institutional Developments |
| Others |
| Public |
| Private |
| North America | United States |
| Canada | |
| Mexico | |
| South America | Brazil |
| Argentina | |
| Chile | |
| Peru | |
| Rest of South America | |
| Europe | Germany |
| United Kingdom | |
| France | |
| Italy | |
| Spain | |
| Rest of Europe | |
| Asia - Pacific | China |
| India | |
| Japan | |
| South Korea | |
| Australia | |
| Rest of Asia - Pacific | |
| Middle East and Africa | United Arab Emirates |
| Saudi Arabia | |
| South Africa | |
| Egypt | |
| Rest of Middle East and Africa |
| By Type | Master Planning and Land-Use Planning | |
| Urban Design, Public Realm and Landscape Design | ||
| Transportation and Mobility Planning | ||
| Zoning, Development Control and Implementation Advisory | ||
| Others | ||
| By Sector | Mixed-Use and Township Developments | |
| Transportation and Infrastructure | ||
| Public, Civic and Institutional Developments | ||
| Others | ||
| By Investor Type | Public | |
| Private | ||
| By Geography | North America | United States |
| Canada | ||
| Mexico | ||
| South America | Brazil | |
| Argentina | ||
| Chile | ||
| Peru | ||
| Rest of South America | ||
| Europe | Germany | |
| United Kingdom | ||
| France | ||
| Italy | ||
| Spain | ||
| Rest of Europe | ||
| Asia - Pacific | China | |
| India | ||
| Japan | ||
| South Korea | ||
| Australia | ||
| Rest of Asia - Pacific | ||
| Middle East and Africa | United Arab Emirates | |
| Saudi Arabia | ||
| South Africa | ||
| Egypt | ||
| Rest of Middle East and Africa | ||


Key Questions Answered in the Report
What is the projected growth rate for urban design services through 2031?
The sector is projected to grow at a 7.8% CAGR from 2026 to 2031, rising from USD 79.01 billion in 2026 to USD 114.8 billion by 2031.
Which urban design service type is growing the fastest?
Zoning, Development Control and Implementation Advisory is forecast to grow at an 8.4% CAGR through 2031.
Which project sector creates the largest demand for urban design services?
Mixed-Use and Township Developments held 38.2% of revenue in 2025, the largest sector share.
Why are regeneration projects important for design consultancies?
Existing districts require coordinated work on land use, public space, infrastructure, local engagement, and phased delivery.
Page last updated on:





