
United States Wires and Cables Market Size and Share
Market Overview
| Study Period | 2020 - 2031 |
|---|---|
| Forecast Data Period | 2026 - 2031 |
| Base Year Market Size (2025) | USD 34.92 Billion |
| Market Size (2025) | USD 37.02 Billion |
| Market Size (2031) | USD 48.25 Billion |
| Growth Rate (2026 - 2031) | 5.44 % |
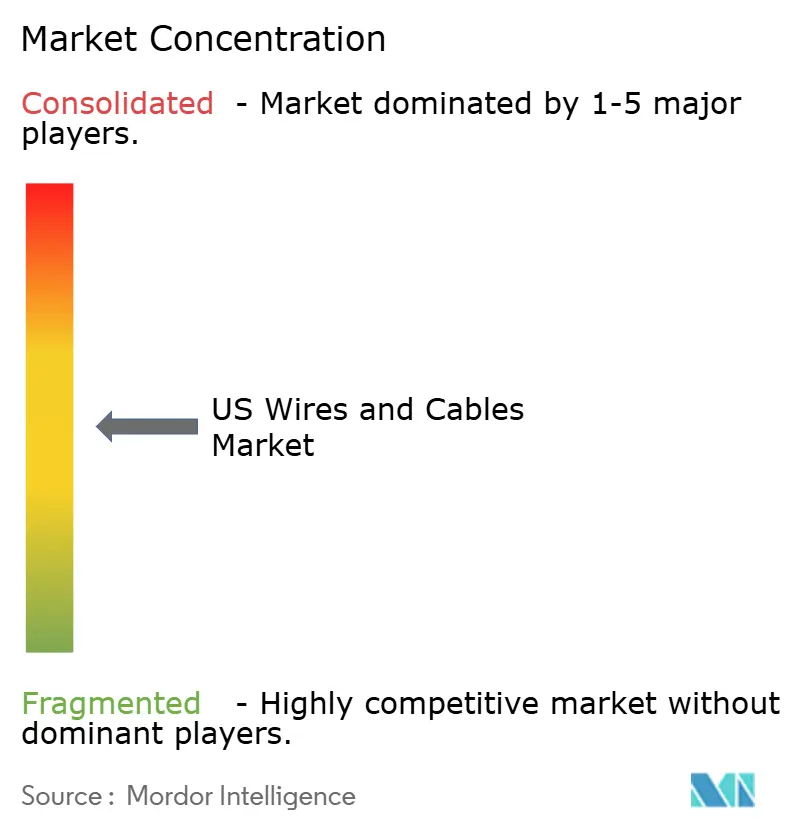
| Market Concentration | Medium |
Major Players *Disclaimer: Major Players sorted in no particular order Image © Mordor Intelligence. Reuse requires attribution under CC BY 4.0. | |
United States Wires and Cables Market Analysis by Mordor Intelligence
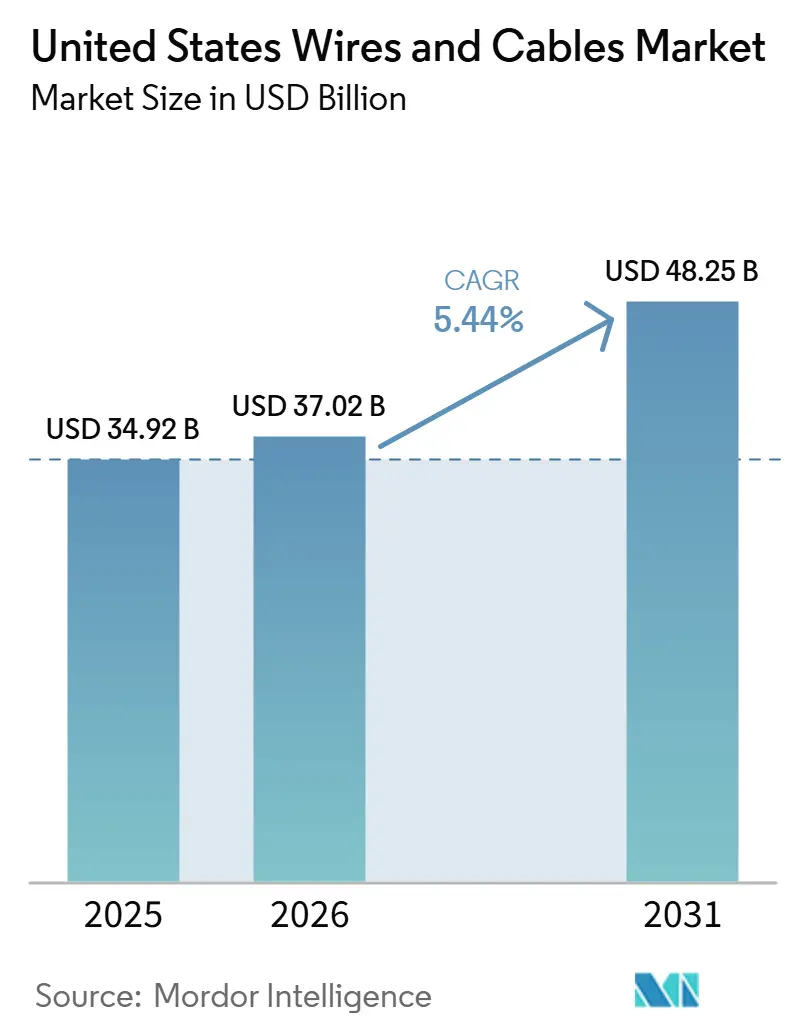
The United States wires and cables market size was valued at USD 34.92 billion in 2025 and estimated to grow from USD 37.02 billion in 2026 to reach USD 48.25 billion by 2031, at a CAGR of 5.44% during the forecast period (2026-2031). A broad grid replacement cycle, heavy data center construction, and federal funding for power and broadband infrastructure are supporting the United States wires and cables market. Demand is also being reinforced by the age of the national transmission network, which is pushing utilities toward long-duration replacement and upgrade programs rather than short project cycles. The South remains the largest regional center for both production and use, while the West is expanding faster as renewable interconnections and digital infrastructure move ahead. Underground and submarine installations are taking a larger role as resilience, wildfire exposure, and offshore wind requirements shape procurement priorities. Competition in the United States wires and cables market remains led by large integrated manufacturers with domestic production, while copper costs and labor availability continue to shape margins and project execution.
Key Report Takeaways
- By cable type, low-voltage energy cable held 32.86% share of the United States wires and cables market size in 2025, while fiber-optic cable is projected to expand at a 6.74% CAGR through 2031.
- By insulation type, insulated cable accounted for 84.48% share of the US wires and cables market size in 2025 and is projected to grow at a 5.50% CAGR through 2031.
- By voltage rating, sub-1 kV held 57.79% share of the USA wires and cables market size in 2025, while the 36-69 kV range is projected to record the fastest CAGR at 6.14% through 2031.
- By installation type, overhead installations accounted for 38.44% share of the United States wires and cables market size in 2025, while submarine installations are projected to expand at an 8.18% CAGR through 2031.
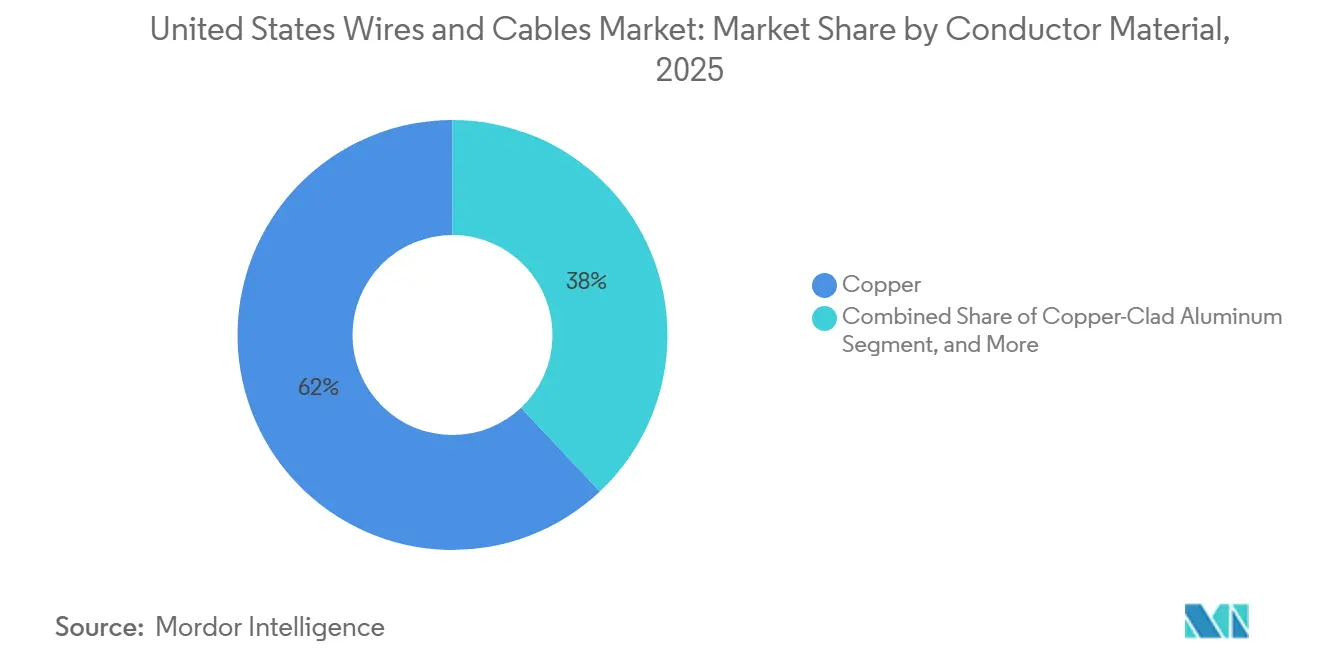
- By conductor material, copper held 62.02% share in 2025, while composite and high-strength core conductors are projected to advance at a 7.95% CAGR through 2031.
- By end-user industry, construction retained a 27.00% share of the United States wires and cables market size in 2025, while telecommunications and data centers are projected to grow at the fastest CAGR of 8.79% through 2031.
Note: Market size and forecast figures in this report are generated using Mordor Intelligence’s proprietary estimation framework, updated with the latest available data and insights as of January 2026.
United States Wires and Cables Market Trends and Insights
Drivers Impact Analysis*
| DRIVER | (~) % IMPACT ON CAGR FORECAST | GEOGRAPHIC RELEVANCE | IMPACT TIMELINE |
|---|---|---|---|
| Rising Infrastructure Modernization Spending | +1.5% | Nationwide, the highest concentration is in the South, the Midwest, and the West | Long term (≥ 4 years) |
| Grid Hardening and Smart-Grid Retrofits | +1.1% | National, concentrated in California, Texas, and the Southeast | Medium term (2-4 years) |
| Data Center Fiber Build-Out | +0.9% | Northern Virginia, Texas, the Midwest, Pacific Northwest | Short term (≤ 2 years) |
| Utility-Scale Renewable Transmission Demand | +0.7% | South, West, Midwest wind belt | Medium term (2-4 years) |
| Underground and Submarine Transmission Projects | +0.4% | Northeast and Gulf Coast coastlines | Long term (≥ 4 years) |
| Buy America-Driven Domestic Sourcing Preference | +0.3% | National priority in federally funded infrastructure projects | Medium term (2-4 years) |
| Source: Mordor Intelligence | |||
Rising Infrastructure Modernization Spending
Federal funding remains the clearest demand support for the United States wires and cables market because it is tied directly to power grid and broadband build programs. The IIJA allocated USD 73 billion for power grid upgrades and USD 65 billion for broadband expansion across 2021 to 2026, which set a clear spending base for utilities, contractors, and communications network operators.[1]American Society of Civil Engineers, “Energy Infrastructure,” Infrastructure Report Card 2025, infrastructurereportcard.org U.S. utilities spent USD 27.7 billion on transmission and USD 50.9 billion on distribution in 2023, while investor-owned utility transmission construction investment for 2023 to 2026 is projected at USD 121 billion. The Department of Energy stated in July 2026 that data centers, domestic manufacturing, and electrification are key sources of load growth that are pressing on the existing grid.[2]U.S. Department of Energy Office of Electricity, “DOE’s Office of Electricity Publishes 2026 Draft National Transmission Needs Study to Strengthen America’s Grid,” U.S. Department of Energy, energy.gov The same study also noted that 70% of U.S. transmission lines are 25 or more years old, which provides the USA wires and cables market with a durable replacement floor, even when individual projects move slowly. This spending profile supports steady order visibility because modernization is now tied to system reliability, industrial growth, and new electricity demand rather than to one-time upgrades.
Grid Hardening and Smart-Grid Retrofits
Grid hardening is raising both cable demand and the average technical specification of that demand across the United States wires and cables market. The Department of Energy administered close to USD 5 billion through the Grid Resilience and Innovation Partnerships program before the program moved into the SPARK structure in 2026. Smart grid grant funding of USD 3 billion across 34 projects is also deploying fiber-optic communication links alongside power conductors, making cable procurement more integrated than in earlier grid cycles. Utilities in fire- and storm-prone territories are shifting toward covered conductors, underground systems, and higher-performance insulation, which improves the value mix even when route miles do not rise as quickly. That shift is especially important for large manufacturers because it moves demand away from simpler commodity wire and toward products with better pricing power. The result is a stronger revenue mix for the US wires and cables market as resilience standards become part of routine capital plans rather than exceptional spending.
Data Center Fiber Build-Out
AI-led data center construction is reshaping the growth profile of the United States wires and cables market, especially in fiber-intensive corridors.[3]Fiber Broadband Association and RVA LLC, “The Underappreciated Need to Enable AI and Data Center Connectivity with Fiber,” Fiber Broadband Association, fiberbroadband.org Fiber Broadband Association and RVA estimated that fiber miles needed in the United States will rise from 159 million in 2024 to 373 million by 2029, while annual new fiber-mile additions are expected to move from 30 million in 2025 to nearly 60 million by 2029. Corning and Meta announced a multiyear agreement worth up to USD 6 billion in January 2026, and the related expansion at Corning’s Hickory, North Carolina, facility moved into construction in March 2026.[4]Corning Incorporated, “Corning and Meta Announce Multiyear, Up to USD 6 Billion Agreement to Accelerate US Data Center Buildout,” Corning Incorporated, corning.com This demand remains concentrated around corridors with power access and large campus development, including Northern Virginia, Central Texas, the Midwest, and the Pacific Northwest. That concentration matters because it increases the risk of local supply bottlenecks even as national production capacity expands. It also means the US wires and cables market is benefiting from a customer group that pulls optical, medium-voltage, and low-voltage products into a single build cycle.
Utility-Scale Renewable Transmission Demand
Renewable generation growth is raising demand for long-haul, technically differentiated transmission cables in the United States wires and cables market. The Department of Energy said in its 2026 transmission needs study that MISO approved the largest transmission portfolio in U.S. history in 2024, while Southwest Power Pool and PJM are also processing unusually large portfolios. Prysmian stated in June 2026 that Invenergy placed the first cable order for the Grain Belt Express project, underscoring how large transmission programs eventually translate into cable revenues after long regulatory lead times.[5]Prysmian Group North America, “Prysmian, in Partnership with Invenergy, Doubles Down on US Manufacturing and Domestic Energy Supply Chain,” Prysmian Group North America, na.prysmian.com Advanced conductors are also gaining attention because reconductoring can increase line capacity within existing rights-of-way at a much lower cost than new line construction. A 2024 PNAS study found that advanced reconductoring could meet more than 80% of near-term interregional transmission needs and support clean electricity coverage above 90% by 2035. This makes renewable transmission a strong support factor for premium conductor products as utilities balance speed, cost, and permitting limits.
Restraints Impact Analysis*
| RESTRAINT | (~) % IMPACT ON CAGR FORECAST | GEOGRAPHIC RELEVANCE | IMPACT TIMELINE |
|---|---|---|---|
| High Installation and Civil Work Costs | -0.7% | National, most acute in the urban Northeast and California | Short term (≤ 2 years) |
| Copper and Aluminum Price Volatility | -0.5% | Global, U.S. manufacturers exposed via LME pricing | Short term (≤ 2 years) |
| Skilled Labor Shortages for Cable Installation | -0.3% | National, most severe in data center and grid corridors | Medium term (2-4 years) |
| Permitting Delays and Right-of-Way Constraints | -0.2% | Interstate transmission routes and offshore wind corridors | Long term (≥ 4 years) |
| Source: Mordor Intelligence | |||
High Installation and Civil Work Costs
Installation costs are a major restraint because underground deployment now carries a much larger civil works burden than aerial alternatives. Fiber Broadband Association and Cartesian reported median underground deployment at USD 18 per foot versus USD 8 per foot for aerial in 2025, and this cost gap shapes cable route selection in 2026. In the same 2026 survey, 88% of operators expected costs to rise again because of labor, materials, permitting, and make-ready requirements. Medium-voltage and high-voltage projects face an even heavier burden because trenching, conduit work, substation connections, and roadway restoration are added to the material bill. This pressure does not reduce the need for cable, but it can slow the pace at which projects move from approval to installation. In the USA, the wires and cables market faces strong demand but is still hampered by timing friction as buyers delay civil work commitments.
Copper And Aluminum Price Volatility
Raw material volatility is another short-term restraint, as metal prices now move faster than many buyers can absorb within fixed budgets. Reuters reported in 2024 that more manufacturers were shifting from copper to aluminum as the cost ratio moved into a range that changed formal specifications. In 2026, copper prices rose enough to push cable makers toward London Metal Exchange-linked pricing formulas instead of traditional fixed-price agreements. That change protects manufacturers from sudden margin compression, but it also passes more budget uncertainty to utilities, contractors, and industrial buyers. The shift is also widening the role of aluminum and copper-clad aluminum in selected low-voltage applications, changing the product mix within the United States wires and cables market. Even where substitution remains limited, the need for frequent price resets complicates procurement planning and tender management.
*Our forecasts treat driver/restraint impacts as directional, not additive. The impact forecasts reflect baseline growth, mix effects, and variable interactions.
Segment Analysis
By Cable Type: Fiber-Optic Expansion Is Reshaping a Broad Product Mix
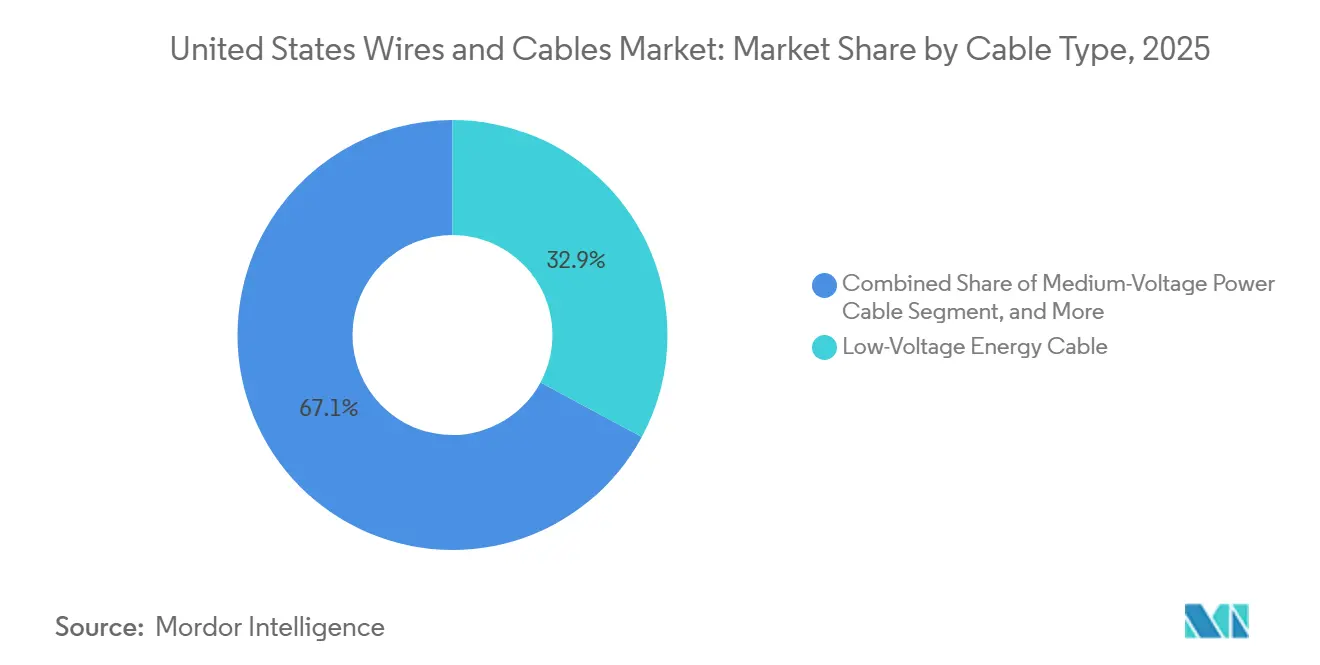
Low-voltage energy cable is expected to account for 32.86% of the by-cable-type segment in 2025. This position reflects steady demand from residential, commercial, and light industrial construction, where routine wiring requirements remain broad and recurring. Fiber-optic cable is the fastest-growing type and is projected to record a 6.74% CAGR from 2026 to 2031 as digital infrastructure spending accelerates. The Fiber Broadband Association and RVA stated that the installed fiber-mile base will need to more than double by 2029, which explains why cable producers are adding capacity specifically for hyperscale and broadband demand.
Corning’s Hickory expansion provides a clear company-level example of how the United States wires and cables market is responding to this demand shift in real time. Medium-voltage power cable, high- and extra-high-voltage cable, signal and control cable, coaxial and data cable, and specialty wire continue to serve narrower but technically important roles across grid, automation, defense, and broadcast systems. Utilities are also bundling power conductors with fiber-enabled ground wire in new transmission builds, reducing the historical separation between communications cable and power cable procurement. Demand for signal and control cable is rising as distributed energy resource management and industrial automation expand, where shielding and reliability matter as much as route miles. Specialty wire is also benefiting as domestic production of motors, transformers, and EV charging equipment keeps more downstream demand within the US wires and cables industry.



By Insulation Type: Insulated Products Continue to Anchor Demand
Insulated cable is expected to account for 84.48% of the segment in 2025 and to remain the dominant category, as most voltage classes and end uses require polymeric protection. In this segment, insulated cable is expected to account for 84.48% of the USA wires and cables market share in 2025 and to grow at a 5.50% CAGR through 2031. Its scale comes from broad use across buildings, utility networks, transportation systems, and data infrastructure, where safety, thermal performance, and environmental resistance are essential. This leadership does not depend on a single end market, making insulated cable one of the most stable parts of the US wires and cables market.
The main competitive question within this segment is the mix of insulation chemistry rather than the overall position of insulated products. XLPE continues to gain ground over older PVC formulations in medium-voltage and high-voltage applications because utilities value its improved heat performance and moisture resistance. Halogen-free flame-retardant compounds are also gaining wider adoption in dense installations, such as data centers, tunnels, and transit systems, where smoke and toxicity profiles matter. Non-insulated cable remains relevant in bare overhead conductors and grounding applications, especially as advanced conductor designs improve the performance of older line corridors. The 2024 PNAS study on advanced conductors supports this part of the United States wires and cables market by showing that premium bare-conductor technologies can unlock major transmission gains within existing rights-of-way.
By Voltage Rating: Low-Voltage Scale Supports Volume While Mid-Range Uses Grow Faster
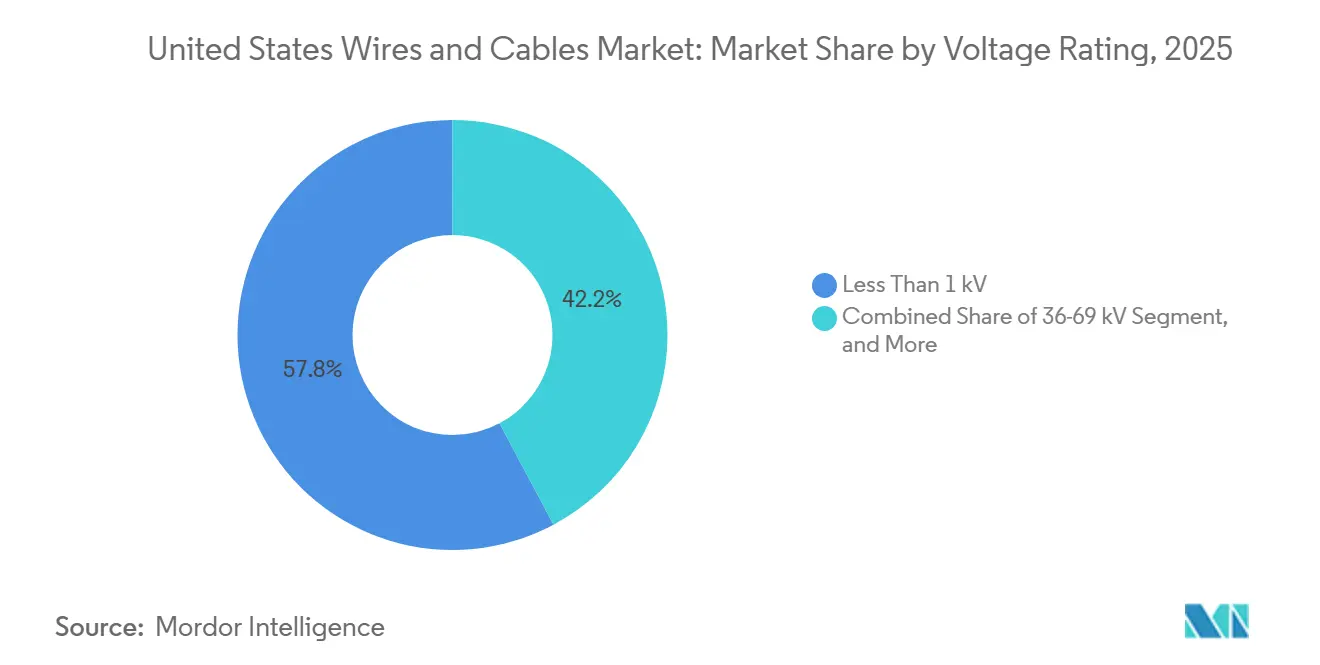
The sub-1 kV segment is expected to account for 57.79% of the by-voltage-rating segment in 2025, making it the largest voltage class by a wide margin. This category includes large volumes of building wire, low-voltage distribution circuits, and in-facility cable for data centers and commercial projects. Its size is closely tied to construction activity and on-site electrical systems, so it benefits from broad nonresidential and digital campus development. The United States' wires and cables market in the sub-1 kV band is expected to remain the largest in 2025, as every new building, retrofit, and data hall requires large quantities of low-voltage products.
The 36-69 kV range is the fastest-growing voltage band, with a 6.14% CAGR projected from 2026 to 2031. This band is important because many wind and utility-scale solar projects collect and move power at 34.5 kV to 69 kV before stepping up to transmission voltage. The Department of Energy’s 2026 transmission study pointed to expanding interregional transmission portfolios across MISO, Southwest Power Pool, PJM, and ERCOT, supporting continued investment across middle-voltage grid links. The 1-35 kV and 70-220 kV bands continue to serve large installed bases in distribution and transmission, but the middle range is gaining stronger momentum from renewable collection systems and industrial sub-transmission. This creates a growth pocket in the United States wires and cables market between the high-volume low-voltage base and the more specialized high-voltage network buildout.
By Installation Type: Overhead Routes Hold the Base While Submarine Projects Lead Growth
Overhead installation is expected to account for 38.44% of the by-installation-type segment in 2025 and remain the largest installation format across the United States wires and cables market. This share reflects the long-established structure of US transmission and distribution networks, where overhead lines still cover most route miles. Underground installation is expected to remain the second-largest category, especially in urban and suburban distribution systems, where resilience and land-use constraints matter more. Indoor and building cable continues to track construction and data center activity, while aerial micro-duct is emerging in fiber builds that require lower civil costs than full underground routes.
Submarine installation is projected to grow at an 8.18% CAGR from 2026 to 2031, making it the fastest-growing installation type in the United States wires and cables market. LS GreenLink began vertical construction in May 2026 on its USD 681 million Phase 1 submarine cable facility in Chesapeake, Virginia, and Phase 1 operations are expected in Q4 2027. Coastal Virginia Offshore Wind began delivering power to the grid in March 2026, while Nexans’ Marmac 306 had already started cable installation work for Empire Wind 1 in July 2025. The Buy America, Build America framework is also making domestic production more relevant for federally assisted projects, supporting local sourcing of submarine and underground systems. This mix leaves overhead routes as the volume anchor while placing some of the strongest growth in higher-value installation formats.
By Conductor Material: Copper Leads Current Demand While Advanced Conductors Gain Momentum
Copper conductor is expected to account for 62.02% of the by-conductor-material segment in 2025 and remain the leading material across the United States wires and cables market because it combines high conductivity with broad compatibility in existing systems. Copper is especially important in data center power distribution, building wire, and control applications, where conductivity and established termination standards remain critical. Aluminum is expected to remain the second-largest material, mainly in overhead transmission and medium-voltage distribution, where its weight advantages support long-route economics. Copper-clad aluminum also continues to serve cost-sensitive low-voltage uses where buyers accept substitution to control budgets.
Composite and high-strength core conductors are projected to record a 7.95% CAGR from 2026 to 2031, making them the fastest-growing material category. Their appeal comes from reconductoring programs that increase capacity without requiring full tower replacement, which is valuable when rights-of-way and permitting windows are tight. Prysmian stated in June 2026 that its Williamsport, Pennsylvania, expansion tied to the Grain Belt Express project would double capacity for specific advanced transmission conductors. That investment shows how project-level transmission demand is beginning to shape factory decisions within the United States wires and cables market. It also shows that growth is shifting toward materials that solve network bottlenecks rather than simply supplying traditional conductor volume.
By End-User Industry: Construction Holds the Largest Base While Digital Infrastructure Expands Fastest
Construction, including residential and commercial activity, is expected to retain the largest end-user share at 27.00% in 2025 and remain the broadest demand base in the United States wires and cables market. This position reflects recurring needs across housing, offices, retail sites, and light industrial facilities, where basic electrical infrastructure is essential. Power transmission and distribution utilities are expected to remain the second-largest end-user group because grid replacement and system expansion continue to absorb large cable volumes. Industrial manufacturing, renewable energy, oil and gas, mining, and transportation applications add stable demand with different technical requirements and procurement cycles.
Telecommunications and data centers are projected to grow at an 8.79% CAGR from 2026 to 2031, making this the fastest-growing end-user segment in the United States wires and cables market. The Fiber Broadband Association and RVA estimated that AI infrastructure growth will require 2.3 times the current installed fiber-mile base by 2029, supporting long-term optical demand. This segment also creates a strong pull-through effect because a single hyperscale campus often requires fiber cable, medium-voltage feeder cable, low-voltage internal distribution cable, and dedicated communications links within the same project cycle. Military and defense needs remain smaller in volume, but they create specialized demand that favors high reliability and technical qualifications. This end-user mix shows that both broad construction activity and a concentrated wave of digital infrastructure investment are supporting the USA wires and cables industry.
Geography Analysis
The South remains the largest regional market in the United States wires and cables market, supported by heavy construction activity, large utility programs, and a strong domestic manufacturing base. Texas and Florida continue to anchor regional demand through grid additions, population-driven construction, and rising digital infrastructure requirements. Production capacity is also concentrated across Texas and the Southeast, including Georgia, Alabama, South Carolina, and North Carolina, giving the region a strong role in both supply and end use. The Midwest remains a steady demand center, as utilities continue to replace aging distribution assets, while automotive and EV plants require specialized cable systems. Large transmission portfolios approved across Midwestern grid territories also support longer-duration demand for overhead and underground products.
The West is the fastest-growing regional market in the USA wires and cables market, as renewable interconnections and Pacific Northwest data center expansion are progressing simultaneously. California’s resilience and energy transition programs are driving demand for covered conductors, high-performance insulation, and higher-capacity transmission links. The Northeast accounts for a relatively high concentration of underground cable spending, as dense urban systems in New York, New Jersey, and Massachusetts rely more heavily on buried infrastructure. Testimony from Americans for a Clean Energy Grid noted that the New England Clean Energy Connect project increased from an initial estimate of nearly USD 1 billion to almost USD 1.5 billion after two years of permitting delays, showing how siting friction can raise delivered project costs without reducing the need for cable.
The Department of Energy identified NYISO, NorthernGrid South, and MISO as having the highest potential for new in-region transmission to reduce congestion, while key interregional links include WestConnect-SPP and NorthernGrid-WestConnect. These corridors are important because they indicate where higher-value transmission cable orders are most likely to develop during 2026-2031. Domestic plant utilization in 2026 is estimated at 75% to 85%, with some producers expected to operate near full utilization in high-demand categories such as data center power cable and plenum-rated cable. The geographic spread of U.S. production also helps the United States wires and cables market serve federally assisted projects without creating unnecessary Buy America compliance gaps.
Competitive Landscape
The USA wires and cables market remains moderately concentrated at the top, with the leading five to eight manufacturers accounting for a significant portion of domestic production. Prysmian materially strengthened its U.S. position through the USD 4.2 billion acquisition of Encore Wire in 2024 and is expanding that platform with major manufacturing additions in Texas. In April 2026, Prysmian and Encore Wire are expected to open a new copper building wire plant and a 1-million-square-foot service center in McKinney, Texas, increasing the scale and responsiveness of the combined platform. Nexans also announced a notable transaction, the planned acquisition of Republic Wire in April 2026, for an enterprise value of EUR 680 million (USD 734 million), plus a contingent earn-out of up to EUR 43 million (USD 46 million) payable in 2028. Southwire, Belden, Nexans, LS Cable and System USA, and other established suppliers continue to hold differentiated positions across power cable, specialty cable, and submarine systems through domestic footprints, depth of certifications, and product specialization.
Technology competition is intensifying in advanced conductors and AI-grade fiber systems, where mid-tier specialists can still disrupt larger incumbents. Fujikura announced in May 2026 that it would invest up to JPY 260 billion (USD 1.63 billion) to expand U.S. fiber optic cable production through a new subsidiary structure. Furukawa Electric also announced in March 2026 that it would invest up to JPY 300 billion (USD 1.91 billion) to expand optical fiber and cable capacity to up to three times current levels, including capacity tied to the United States. At the same time, Buy America documentation has become a practical qualification gate for suppliers seeking federally assisted work, strengthening the position of companies with established U.S. manufacturing.
A second tier of specialty producers and importers continues to maintain pricing discipline in more standardized product classes. As a result, leadership in the United States wires and cables market does not eliminate competitive pressure. Metal price volatility is pushing contract structures toward exchange-linked formulas, favoring suppliers with stronger sourcing capabilities, stronger treasury controls, and stronger customer relationships. Skilled labor constraints also remain important, as expansion plans and project awards convert into revenue only when factories and field crews can support on-time delivery. Overall, the United States wires and cables market rewards scale and domestic production, while leaving room for technically focused players that can respond quickly to grid, submarine, and data center demand.
United States Wires and Cables Industry Leaders
Prysmian Group USA, LLC
TE Connectivity plc
Southwire Company, LLC
Belden Inc.
Corning Incorporated
- *Disclaimer: Major Players sorted in no particular order

Recent Industry Developments
- July 2026: The US DOE Office of Electricity published the draft 2026 National Transmission Needs Study, identifying load growth from data centers, domestic manufacturing, and electrification as primary drivers for an expanded transmission infrastructure buildout. The study designates NYISO, NorthernGrid South, and MISO as the highest-congestion regions, directly mapping the cable procurement corridors for the 2026 to 2031 period.
- July 2026: Lightpath announced new fiber builds to 2 hyperscale data center campuses, each exceeding 1 GW, in Saline, Michigan, and Port Washington, Wisconsin, in partnership with an anchor hyperscale customer. The Saline build is targeted for 2026 delivery, with Port Washington following in Q2 2027.
- June 2026: Prysmian received the first cable order for the Grain Belt Express HVDC project from Invenergy, triggering a USD 22.5 million expansion of its Williamsport, Pennsylvania, facility that doubles E3X advanced conductor manufacturing capacity. The project's 7-year gap between regulatory approval and first cable order highlights the structural lead-time risk embedded in large US transmission programs.
- May 2026: LS GreenLink began vertical construction on the primary building at its USD 681 million Phase 1 submarine cable facility in Chesapeake, Virginia, supported by USD 99 million in DOE advanced-energy tax credits and a USD 13.2 million Virginia Opportunity Fund grant, which will become the largest subsea cable production base in the US, with Phase 1 completion expected in Q4 2027.


United States Wires and Cables Market Report Scope
The United States Wires and Cables Market Report is Segmented by Cable Type (Low-Voltage Energy, Medium-Voltage Power Cable, High / Extra-High-Voltage Cable, Fiber-Optic Cable, Signal and Control Cable, Coaxial and Data Cable, and Specialty Wires), Insulation (Insulated and Non-Insulated), Voltage Rating (Less Than1 kV, 1-35 kV, 36 - 69 kV, and 70 - 220 kV), Installation Type (Overhead, Underground, Submarine, Indoor and Building, and Aerial Micro-Duct), Conductor Material (Copper, Aluminum, Copper-Clad Aluminum, and Composite and High-Strength Core), and End-User Industry (Construction, Power Transmission and Distribution Utilities, Telecommunications and Data Centers, Industrial Manufacturing, Automotive and Transportation, EV and Rail, Renewable Energy, Solar and Wind, Oil, Gas, and Mining, Military and Defense and Other End-User Industries). The Market Forecasts are Provided in Terms of Value (USD).
| Low-Voltage Energy Cable |
| Medium-Voltage Power Cable |
| High / Extra-High-Voltage Cable |
| Fiber-Optic Cable |
| Signal and Control Cable |
| Coaxial and Data Cable |
| Specialty Wire (Magnet, Stranded, etc.) |
| Insulated |
| Non-Insulated |
| Less Than 1 kV |
| 1 - 35 kV |
| 36 - 69 kV |
| 70 - 220 kV |
| Overhead |
| Underground |
| Submarine |
| Indoor and Building |
| Aerial Micro-Duct |
| Copper |
| Aluminum |
| Copper-Clad Aluminum |
| Composite and High-Strength Core |
| Construction (Residential and Commercial) |
| Power Transmission and Distribution Utilities |
| Telecommunications and Data Centers |
| Industrial Manufacturing |
| Automotive and Transportation, EV and Rail |
| Renewable Energy, Solar and Wind |
| Oil, Gas, and Mining |
| Military and Defense |
| Other End-User Industries |
| By Cable Type | Low-Voltage Energy Cable |
| Medium-Voltage Power Cable | |
| High / Extra-High-Voltage Cable | |
| Fiber-Optic Cable | |
| Signal and Control Cable | |
| Coaxial and Data Cable | |
| Specialty Wire (Magnet, Stranded, etc.) | |
| By Insulation Type | Insulated |
| Non-Insulated | |
| By Voltage Rating | Less Than 1 kV |
| 1 - 35 kV | |
| 36 - 69 kV | |
| 70 - 220 kV | |
| By Installation Type | Overhead |
| Underground | |
| Submarine | |
| Indoor and Building | |
| Aerial Micro-Duct | |
| By Conductor Material | Copper |
| Aluminum | |
| Copper-Clad Aluminum | |
| Composite and High-Strength Core | |
| By End-User Industry | Construction (Residential and Commercial) |
| Power Transmission and Distribution Utilities | |
| Telecommunications and Data Centers | |
| Industrial Manufacturing | |
| Automotive and Transportation, EV and Rail | |
| Renewable Energy, Solar and Wind | |
| Oil, Gas, and Mining | |
| Military and Defense | |
| Other End-User Industries |


Key Questions Answered in the Report
What is the size of the United States Wires and cables market in 2026?
The United States wires and cables market reached USD 37.02 billion in 2026 and is projected to reach USD 48.25 billion by 2031 at a 5.44% CAGR.
Which product type is expanding the fastest in this space?
Fiber-optic cable is the fastest-growing cable type, with a projected 6.74% CAGR from 2026 to 2031, supported by AI data center and broadband buildouts.
Which installation format is showing the highest growth through 2031?
Submarine installation is expected to grow the fastest, at an 8.18% CAGR, supported by offshore wind and coastal transmission activity.
Which end-user group is creating the strongest growth opportunity?
Telecommunications and data centers are projected to post the fastest growth at an 8.79% CAGR, driven by hyperscale campus construction and fiber demand.
Why is grid modernization so important for demand?
Aging transmission lines, federal funding, and rising electricity demand from manufacturing and data centers are creating a long replacement and expansion cycle for utilities.
What are the main risks affecting near-term performance?
High installation costs and copper price volatility are the main near-term risks, as they can delay project timing and increase procurement uncertainty even when end demand remains strong.
Page last updated on:





