
United States E-Commerce Last-Mile Delivery Market Size and Share
Market Overview
| Study Period | 2020 - 2031 |
|---|---|
| Forecast Data Period | 2026 - 2031 |
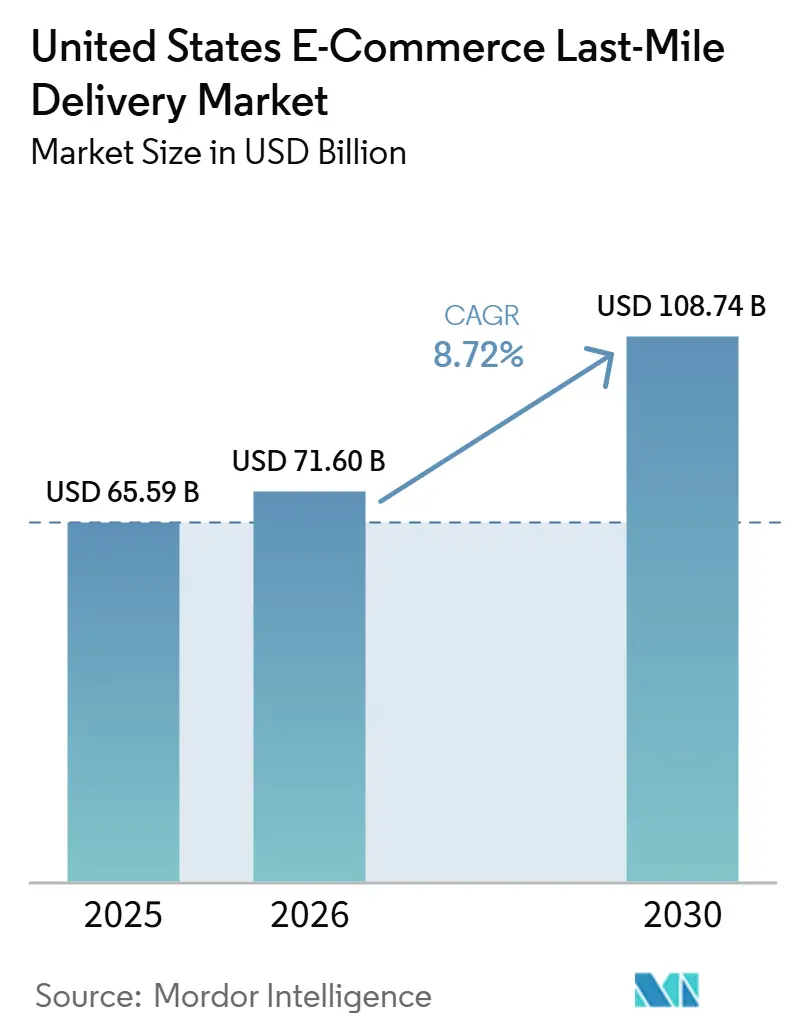
| Base Year Market Size (2025) | USD 65.59 Billion |
| Market Size (2026) | USD 71.60 Billion |
| Market Size (2031) | USD 108.74 Billion |
| Growth Rate (2026 - 2030) | 8.72 % |
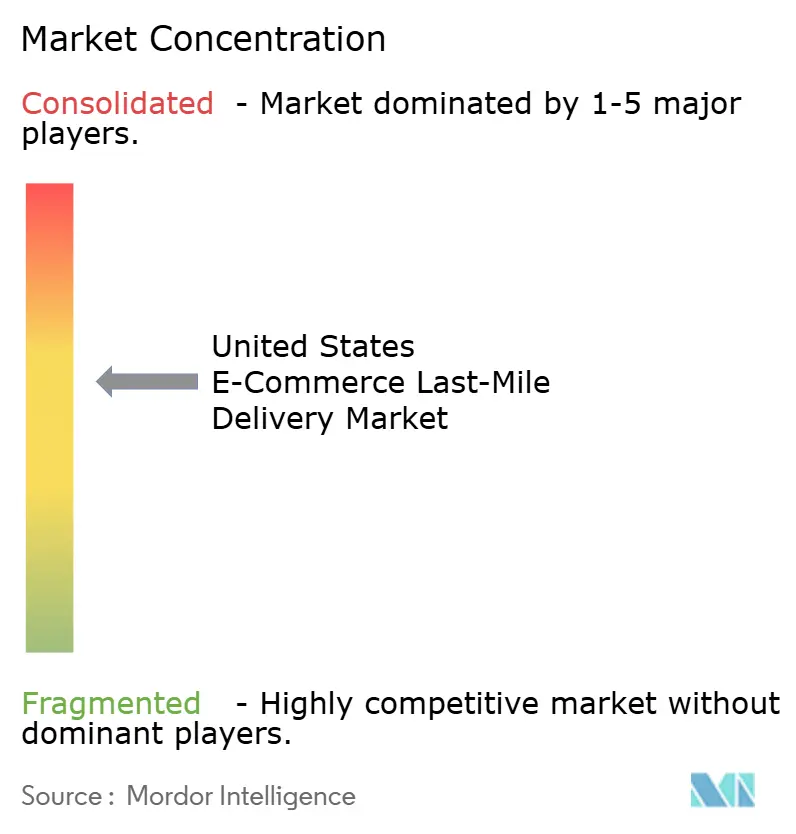
| Market Concentration | Medium |
Major Players *Disclaimer: Major Players sorted in no particular order Image © Mordor Intelligence. Reuse requires attribution under CC BY 4.0. | |
United States E-Commerce Last-Mile Delivery Market Analysis by Mordor Intelligence
The United States e-commerce last-mile delivery market size was valued at USD 65.59 billion in 2025 and is estimated to grow from USD 71.6 billion in 2026 to reach USD 108.74 billion by 2031, at a CAGR of 8.72% during the forecast period 2026-2031.
Delivery speed now shapes purchasing behavior more directly, and the service baseline keeps moving higher as Amazon expands same-day and next-day coverage into smaller cities and rural communities. The network model in the United States e-commerce last-mile delivery market is also changing as shared infrastructure, local injection points, and micro-fulfillment sites make faster delivery more practical across a wider set of ZIP codes. Automation is moving from a productivity upgrade to an operating requirement, with UPS, FedEx, and other operators investing in visibility, sortation, and robotic handling to support higher parcel volumes without matching labor growth one-for-one. Margin pressure remains high because surcharge inflation, tighter labor availability, and state-level labor rules are increasing the cost of serving residential deliveries in the e-commerce last-mile delivery market across the United States. Competitive advantage is therefore concentrated around route density, local access, operating technology, and the ability to blend national scale with neighborhood-level execution in the United States e-commerce last-mile delivery market.
Key Report Takeaways
- By delivery type, next-day delivery held a 41.22% share of the United States e-commerce last-mile delivery market size in 2025, while same-day delivery is forecast to expand at a 12.17% CAGR through 2031.
- By delivery model, B2C accounted for 65.1% in the United States e-commerce last-mile delivery market share in 2025, while C2C is projected to record the highest CAGR at 14.84% through 2031.
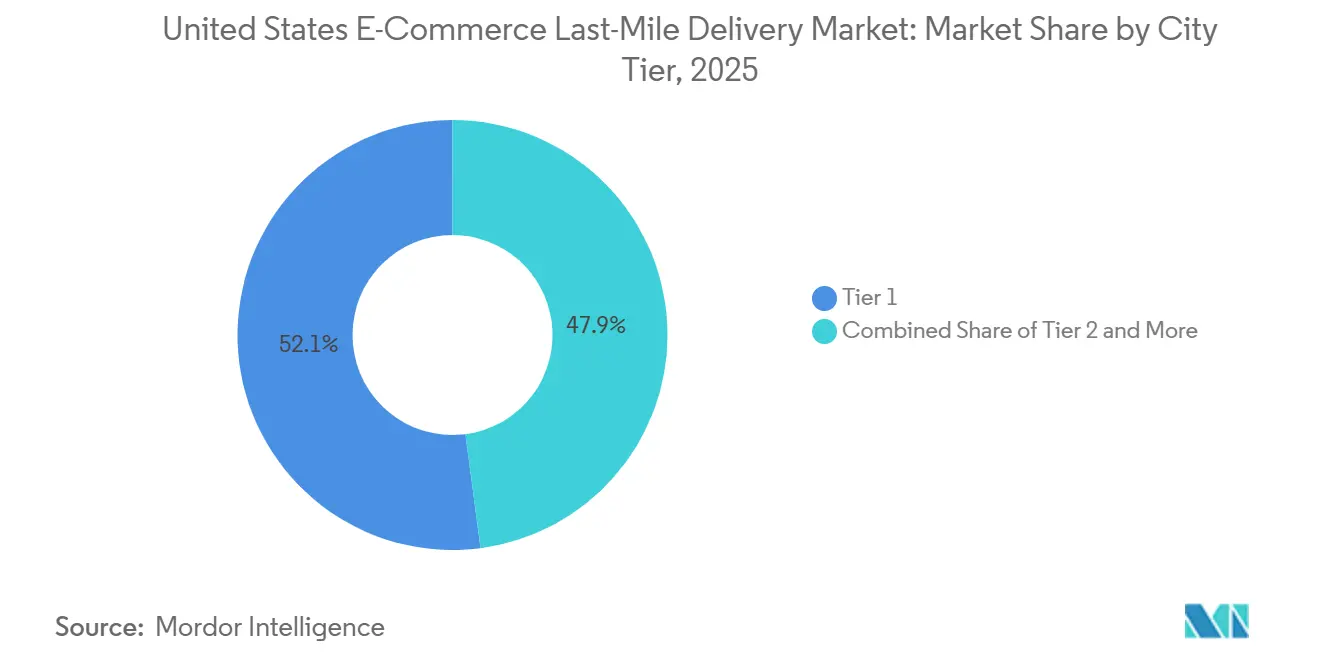
- By city tier, Tier 1 cities accounted for 52.07% of the United States e-commerce last-mile delivery market share in 2025, while Tier 3 and below are forecast to grow at a 11.77% CAGR through 2031.
- By product type, foods and beverages accounted for a 28.49% share of the United States e-commerce last-mile delivery market size in 2025, while personal and household care is projected to grow at a 10.97% CAGR through 2031.
- By geography, the Northeast held a 24.34% share of the United States e-commerce last-mile delivery market size in 2025, while the Southwest is forecast to expand at a 9.8% CAGR through 2031.
Note: Market size and forecast figures in this report are generated using Mordor Intelligence’s proprietary estimation framework, updated with the latest available data and insights as of January 2026.
United States E-Commerce Last-Mile Delivery Market Trends and Insights
Drivers Impact Analysis*
| Driver | (~) % Impact on CAGR Forecast | Geographic Relevance | Impact Timeline |
|---|---|---|---|
| Rising demand for same-day and next-day delivery in urban e-commerce corridors | +2.6% | National, highest density in Northeast, West Coast, and Southwest metros | Short term (≤ 2 years) |
| Parcel density gains from micro-fulfillment and route optimization | +1.8% | National, concentrated in Tier 1 and Tier 2 cities | Medium term (2-4 years) |
| Carrier diversification away from single-carrier dependence | +1.3% | National, early adoption concentrated in Northeast and West Coast e-commerce hubs | Short term (≤ 2 years) |
| Growth of alternative delivery points, lockers, and pickup networks | +1.0% | National, USPS-anchored rural and suburban coverage with urban locker density | Medium term (2-4 years) |
| Automation in sortation, dispatch, and exception management | +1.5% | National, early deployment in high-volume hubs in the Midwest and Northeast | Long term (≥ 4 years) |
| Sustainable fleet transition in high-stop-density urban routes | +0.8% | Urban corridors in the West, Northeast, and Southwest | Long term (≥ 4 years) |
| Source: Mordor Intelligence | |||
Rising Demand for Same-Day and Next-Day Delivery in Urban E-Commerce Corridors
Speed has become a core service requirement in the United States e-commerce last-mile delivery market, not a premium add-on. Amazon expanded same-day and next-day delivery to more than 4,000 smaller United States cities and rural communities in 2025, supported by a USD 4 billion investment to triple its rural delivery network. In May 2026, Amazon launched Amazon Now and brought 30-minute delivery to dozens of US cities, including Atlanta, Dallas-Fort Worth, Philadelphia, and Seattle. That rollout shows how major operators are shifting inventory closer to demand and turning fulfillment speed into a more local operating problem. It also raises the service threshold for retailers that still depend on slower national routing models. The result is a United States e-commerce last-mile delivery market that rewards carriers and platforms with dense urban coverage, tight inventory positioning, and consistent execution within short windows.
Parcel Density Gains from Micro-Fulfillment and Route Optimization
Parcel density has become one of the most important cost levers in the United States e-commerce last-mile delivery market. Amazon states that it uses more than 20 machine learning models to refine delivery routes up to the point when a package is loaded, using traffic and real-time operating conditions to improve route selection. In July 2026, Descartes Systems Group acquired Drivin, adding route optimization and AI-based dispatch tools to its last-mile software portfolio[1]“Acquisition of Drivin,” SEC Filing / Press Release, sec.gov. Research published in Scientific Reports in 2025 found that traffic-aware routing and adaptive dispatch can reduce missed deliveries and lower per-stop costs in urban delivery systems. Micro-fulfillment supports those gains by placing inventory closer to the order location and reducing the distance per stop. As these methods spread, the United States e-commerce last-mile delivery market becomes more favorable to operators that can combine software intelligence with localized inventory and route planning.
Carrier Diversification Away from Single-Carrier Dependence
Single-network dependence is becoming harder to justify in the United States e-commerce last-mile delivery market. In January 2026, USPS opened a formal bid solicitation platform that grants broader access to more than 18,000 destination delivery units and local processing centers. That move makes shared last-mile infrastructure more accessible to third-party shippers that can inject pre-sorted parcel volume. In May 2026, Amazon launched Amazon Supply Chain Services for businesses beyond Amazon sellers, extending freight, distribution, fulfillment, and parcel shipping under one operating umbrella. These developments expand the set of delivery paths available to merchants and reduce reliance on a single incumbent carrier. The market is therefore moving toward a model where multi-network orchestration is a standard operating approach rather than a backup plan.
Automation in Sortation, Dispatch, and Exception Management
Automation is becoming a direct response to cost pressures and changing volumes in the United States e-commerce last-mile delivery market. In February 2026, FedEx announced plans to deploy Berkshire Grey’s Scoop autonomous robotic trailer unloader, with the first production systems expected to start operating later in 2026. UPS completed a full RFID package sensing rollout across its United States small package network in April 2026, covering vehicles, facilities, and more than 5,500 UPS The UPS Store locations. In May 2026, Pathenbot Group launched commercial intelligent robotic sorting services in the United States, with an initial order for 100,000 units of cargo sorting equipment[4]“Pathenbot Launches Commercial Intelligent Robotic Sorting Services in US,” SEC Filing, sec.gov. These examples show that automation is now extending across unloading, tracking, sortation, and exception handling, rather than remaining limited to a single facility function. As a result, the market is steadily shifting toward operating models that rely less on manual throughput growth and more on capital-backed process control.
Restraints Impact Analysis*
| Restraint | (~) % Impact on CAGR Forecast | Geographic Relevance | Impact Timeline |
|---|---|---|---|
| Last-mile cost inflation from residential surcharges and failed delivery attempts | -1.8% | National, disproportionate in suburban and extended DAS ZIP codes | Short term (≤ 2 years) |
| Driver shortages and peak-season capacity constraints | -1.5% | National, acute in high-density metros and rural expansion corridors | Medium term (2-4 years) |
| Fragmented address quality and hard-to-serve suburban sprawl | -0.8% | Southwest and Midwest suburban zones, rural ZIP codes nationally | Medium term (2-4 years) |
| Regulatory and labor compliance complexity across states and cities | -0.7% | California, New York, Illinois, and national FMCSA-related enforcement | Short term (≤ 2 years) |
| Source: Mordor Intelligence | |||
Last-Mile Cost Inflation from Residential Surcharges and Failed Delivery Attempts
Residential delivery costs are rising faster than many operators can offset through volume alone in the United States e-commerce last-mile delivery market. UPS and FedEx both implemented a 5.9% general rate increase for 2026, but residential surcharges increased faster, with FedEx moving from USD 5.95 to USD 6.45 and UPS moving from USD 6.10 to USD 6.50. That makes residential-heavy shipping books more exposed than the headline rate increase suggests. The pressure is strongest where delivery density is low, and customer expectations for free shipping remain high. It also encourages more route audits, stricter service-area planning, and wider use of alternative delivery points. In the United States e-commerce last-mile delivery market, this cost profile favors operators that can shorten routes, reduce reattempts, and control surcharge exposure at the lane level.
Driver Shortages and Peak-Season Capacity Constraints
Labor availability remains a structural constraint on the United States e-commerce last-mile delivery market. The United States Bureau of Labor Statistics reported truck transportation employment at 1,466,600 in June 2026, down from 1,493,100 at the start of 2025[2]“Delivery Truck Drivers and Driver/Sales Workers, Occupational Outlook Handbook,” BLS, bls.gov. That decline matters because delivery networks need stable driver coverage to maintain route consistency, ensure peak-period readiness, and expand their rural reach. When turnover stays high or recruitment weakens, carriers must either pay more, accept lower utilization, or narrow service promises. Capacity tightness is especially important for suburban and outer-zone routes where route economics are already weaker. The United States e-commerce last-mile delivery market, therefore, faces a labor ceiling that can slow network expansion even when demand remains strong.
*Our forecasts treat driver/restraint impacts as directional, not additive. The impact forecasts reflect baseline growth, mix effects, and variable interactions.
Segment Analysis
By Delivery Type: Speed Compression Reshaping the Revenue Stack
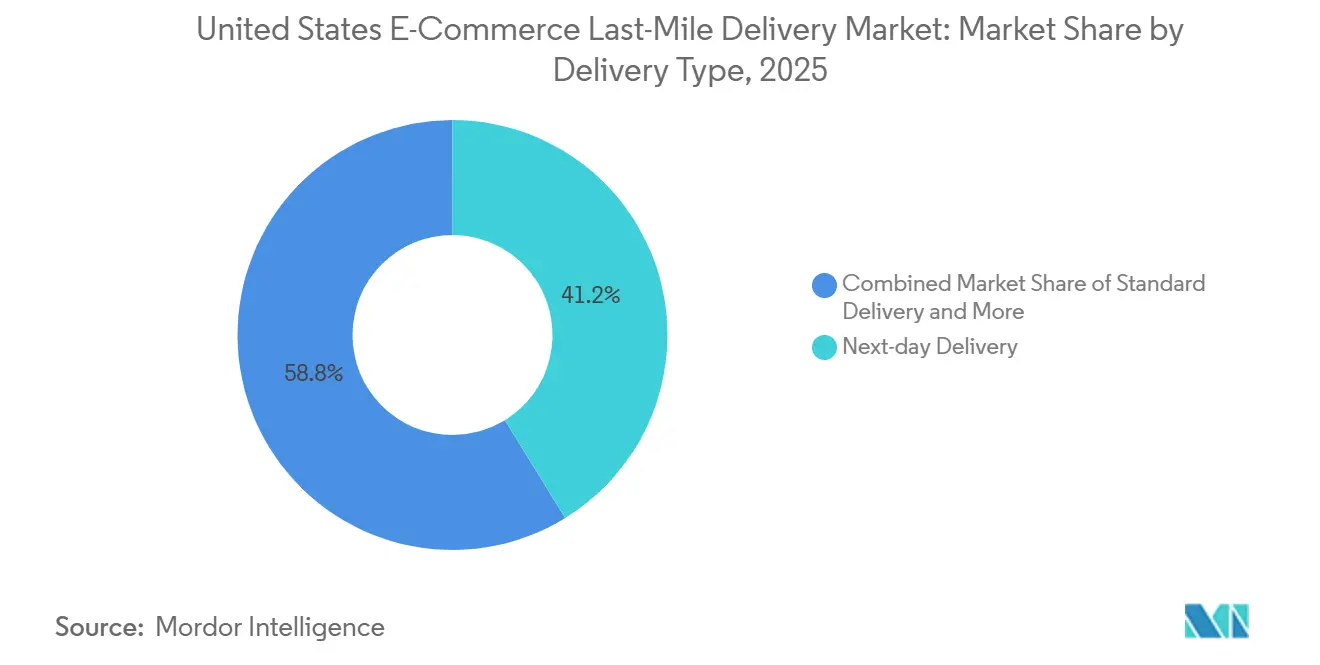
Next-day delivery held 41.22% of the United States e-commerce last-mile delivery market share in 2025, making it the largest delivery type by value. That position reflects how fast delivery has become a standard expectation across major online retail categories. Retailers outside Amazon’s ecosystem are no longer building next-day capacity to stand out. They are building it to stay credible in the United States e-commerce last-mile delivery market. Compliance limits, route length, and low delivery density keep standard service relevant in many parts of the country.
Same-day delivery is projected to expand at a 12.17% CAGR through 2031, indicating that the fastest service tier is moving beyond a narrow urban premium use case. Amazon’s May 2026 launch of Amazon Now pushed that benchmark even lower by offering 30-minute delivery in dozens of US cities. That move matters because it shifts the service ladder from standard versus expedited into a more granular speed hierarchy. Standard delivery still plays an important role for long-zone shipments and value-oriented orders where rapid fulfillment does not justify the cost. Over time, the United States e-commerce last-mile delivery market is likely to see same-day grow fastest in dense metros, while next-day remains the broad commercial anchor and standard delivery stays important in outer-zone and rural lanes.



By Delivery Model: B2C Dominance with C2C as the Structural Disruptor
B2C delivery captured 65.1% of the United States e-commerce last-mile delivery market size in 2025, confirming that residential retail demand remains the sector’s largest volume engine. Years of investment by major retailers and parcel operators have made B2C the most established operating model. Its scale also means that changes in residential delivery cost, customer promise windows, and carrier productivity have a wide effect across the market. Instacart expanded its enterprise fulfillment relationship with ALDI in Q1 2026 through a redesigned digital storefront and exclusive fulfillment support, showing how platform-based fulfillment models continue to blur demand boundaries across the United States e-commerce last-mile delivery market.
C2C is forecast to grow at 14.84% CAGR through 2031, making it the fastest-moving delivery model in the current structure. That growth is linked to resale platforms and recommerce activity that create parcel demand outside traditional retail supply chains. C2C growth matters because it introduces more uneven shipment patterns, variable pickup points, and dispersed origin locations. Those traits make flexible regional operators and app-based delivery networks more relevant in selected lanes. B2B remains smaller in the e-commerce last-mile setting, but it still supports meaningful volume in industrial supplies, commercial replenishment, and scheduled business deliveries. As that blurring continues, the United States e-commerce last mile delivery industry will need more flexible pickup, reverse logistics, and order orchestration capabilities to serve both structured retail flows and less predictable peer-originated parcel activity.
By City Tier: Density Economics Drive Performance Divergence
Tier 1 cities accounted for 52.07% of the United States e-commerce last-mile delivery market size in 2025, reflecting the purchasing power and route density advantages concentrated in the largest urban centers. Dense urban demand supports faster drop cycles, shorter route miles, and better use of micro-fulfillment nodes. That keeps Tier 1 cities at the center of premium delivery service economics. Amazon’s USD 4 billion investment in rural networks and its service expansion into more than 4,000 smaller communities help explain that growth path. USPS adds to that shift by opening access to more than 18,000 local delivery units and processing centers for third-party use.
Tier 3 and below are projected to grow at 11.77% CAGR through 2031, making them the fastest-growing city tier in the United States e-commerce last-mile delivery market. Tier 2 cities remain strategically important because they offer enough parcel density to support regional carrier economics without the real estate and congestion intensity seen in the largest metros. That makes them useful expansion zones for carriers trying to build profitable adjacency before moving deeper into smaller markets. The current phase of the United States e-commerce last-mile delivery market, therefore, rewards operators that can build route density in Tier 2 locations while extending selective fast-service coverage into Tier 3 territories. As those networks mature, the relative weight of Tier 1 cities will still stay large, but growth will become more distributed across the broader national footprint.
By Product Type: Grocery Commands Share While Personal Care Leads Growth
Foods and beverages held 28.49% share in 2025, making the category the largest product type within the United States e-commerce last-mile delivery market. The category’s lead reflects the frequency of grocery ordering and the short, acceptable delivery windows for food and household replenishment. Grocery delivery also creates a steady stream of orders that supports denser local dispatch cycles. DoorDash strengthened that pattern in September 2025 when it unveiled DashMart Fulfillment Services for inventory management, picking, packing, and delivery through its DashMart network. That move showed how on-demand platforms are extending from delivery execution into broader fulfillment control.
Personal and household care is projected to grow at 10.97% CAGR through 2031, making it the fastest-growing product segment. This segment benefits from repeat replenishment behavior and frequent small-parcel orders, which align with dense residential routing models. Fashion and lifestyle depend heavily on speed and returns handling, while consumer electronics depend more on tracking integrity and secure handoff. Furniture requires specialized handling, scheduled delivery windows, and higher service complexity than lighter parcel categories. These different service profiles are pushing the United States e-commerce last mile delivery market toward more product-specific routing, packaging, and carrier selection practices rather than one uniform delivery model across all categories.
Geography Analysis
The Northeast held 24.34% of the United States e-commerce last-mile delivery market share in 2025, making it the largest regional contributor by value. Its position reflects dense consumer demand, mature parcel infrastructure, and the ability to support premium service windows across closely connected metro corridors. The Northeast also tends to favor operators that can manage difficult urban stop patterns, constrained curb access, and high service expectations. The Southeast contributes a smaller share, but it remains an important expansion geography as population growth and secondary city demand support higher parcel throughput. Across both regions, the service promise in the United States e-commerce last-mile delivery market increasingly depends on local node placement, labor stability, and the ability to serve residential density without losing route productivity.
The Midwest provides steady delivery demand through established retail and industrial corridors that support predictable parcel movement. That stability makes the region useful for carriers that want balanced network utilization rather than only high-growth exposure. The Southwest is projected to expand at 9.8% CAGR through 2031, making it the fastest-growing regional market in the current structure. Population growth in Texas and Arizona metros is pulling more fulfillment and delivery capacity into the region. Amazon’s expansion into smaller communities and USPS access to local delivery infrastructure also support broader service reach across outer zones and fast-growing suburban areas.
The West combines some of the strongest e-commerce demand with some of the highest operating complexity in the United States e-commerce last mile delivery market. California’s AB-1340, effective January 1, 2026, gives app-based delivery and rideshare drivers the right to unionize and bargain collectively[3]“AB-1340 Transportation Network Company Drivers, Labor Relations,” California Legislative Information, leginfo.legislature.ca.gov, which raises labor planning complexity for operators that depend on flexible driver models. The West is also an important proving ground for electric fleet deployment, route automation, and premium instant delivery because dense urban demand can justify higher operating investment. Veho’s Bay Area expansion in June 2026, which brought its network to 78 markets and 52% of the United States population, shows how regional specialists are using sequential launches to close the national coverage gap without replicating legacy hub-and-spoke systems.
Competitive Landscape
The United States e-commerce last-mile delivery market remains moderately concentrated at the national carrier level, but it is becoming more fragmented at the local carrier level. UPS and FedEx still hold major volume positions because of their network breadth, operating discipline, and long-standing shipper relationships. Even so, the market is opening up to regional specialists, platform-led fulfillment models, and shared infrastructure arrangements. Amazon’s launch of Amazon Supply Chain Services in May 2026 is one of the clearest examples, because it opened freight, distribution, fulfillment, and parcel shipping capabilities to businesses beyond Amazon sellers. That move signals direct competition for third-party parcel volume across multiple commercial verticals.
Technology is the main differentiator in the 2026 competitive landscape. UPS completed a full RFID rollout across its United States small package network in April 2026, after investing more than USD 100 million in the initiative, providing stronger package visibility across vehicles, facilities, and store locations. FedEx is pursuing the same broader goal through automation, including Berkshire Grey’s autonomous trailer unloader, intended to improve hub throughput and reduce labor intensity. USPS is also becoming more important to competition because its 2026 bid platform lets third parties use a broader set of local delivery assets under negotiated arrangements USPS. That creates a structural opening for merchants and logistics providers that want last-mile reach without building a full network from scratch.
Regional and niche operators are gaining room where they can focus on selected geographies or service types. Veho’s expansion to 78 markets and 52% population reach in June 2026 shows how a purpose-built last-mile player can scale through focused market launches. DoorDash’s DashMart Fulfillment Services shows another route to competition, where an on-demand platform extends beyond delivery execution into inventory and order handling. Instacart remains relevant to fulfillment flows, but its role is better understood as platform and retail enablement rather than as a standalone parcel carrier network. The competitive picture in the United States e-commerce last mile delivery market therefore favors operators that can combine reliable execution, dense local coverage, and targeted technology investment without carrying unnecessary network complexity.
United States E-Commerce Last-Mile Delivery Industry Leaders
Amazon, Inc.
United States Postal Service
FedEx
United Postal Service of America, Inc. (UPS)
OnTrac
- *Disclaimer: Major Players sorted in no particular order

Recent Industry Developments
- July 2026: Descartes Systems Group acquired Drivin, a last-mile delivery management platform used by distributors, retailers, and logistics providers across high-density urban markets, adding machine learning-driven route optimization and agentic AI dispatch capabilities to its portfolio. The acquisition directly expands Descartes' presence in the rapidly growing last-mile software segment.
- June 2026: Veho expanded to the San Francisco Bay Area, including Oakland, San Francisco, Sacramento, and San Jose, bringing its network to 78 markets and reaching 52% of the United States population, the first time the company has served 1 in 2 Americans. Over the prior 12 months, Veho added 28 markets, tripled the number of new client launches, and doubled parcel volume.
- May 2026: Amazon launched Amazon Supply Chain Services, opening its full freight, distribution, fulfillment, and parcel shipping capabilities to businesses of all sizes beyond Amazon sellers. Early adopters included Procter & Gamble, 3M, Lands' End, and American Eagle Outfitters, positioning Amazon as a direct competitor to UPS and FedEx in third-party parcel services.
- May 2026: USPS and DHL eCommerce finalized a multi-year exclusive agreement valued at well over USD 10 billion, through which DHL eCommerce handles nationwide pickup and sortation across its 19 fully automated United States hubs before handing pre-sorted volume to USPS for final-mile delivery to more than 170 million locations. The deal extends a 25-year partnership and gives DHL eCommerce a significantly expanded domestic delivery scale in the United States.


United States E-Commerce Last-Mile Delivery Market Report Scope
| Standard Delivery |
| Same-Day Delivery |
| Next-Day Delivery |
| Business-to-Consumer (B2C) |
| Business-to-Business (B2B) |
| Consumer-to-Consumer (C2C) |
| Tier 1 |
| Tier 2 |
| Tier 3 and Below |
| Foods and Beverages |
| Personal and Household Care |
| Fashion and Lifestyle (Accessories, Apparel, Footwear) |
| Furniture |
| Consumer Electronics and Household Appliances |
| Other Products |
| Northeast |
| Southeast |
| Midwest |
| Southwest |
| West |
| By Delivery Type | Standard Delivery |
| Same-Day Delivery | |
| Next-Day Delivery | |
| By Delivery Model | Business-to-Consumer (B2C) |
| Business-to-Business (B2B) | |
| Consumer-to-Consumer (C2C) | |
| By City Tier | Tier 1 |
| Tier 2 | |
| Tier 3 and Below | |
| By Product Type | Foods and Beverages |
| Personal and Household Care | |
| Fashion and Lifestyle (Accessories, Apparel, Footwear) | |
| Furniture | |
| Consumer Electronics and Household Appliances | |
| Other Products | |
| By Region | Northeast |
| Southeast | |
| Midwest | |
| Southwest | |
| West |


Key Questions Answered in the Report
What is the 2031 outlook for United States e-commerce last mile delivery?
The United States e-commerce last mile delivery market is projected to reach USD 108.74 billion by 2031, rising from USD 71.6 billion in 2026 at an 8.72% CAGR.
Which delivery type currently leads parcel value in the United States?
Next-day delivery led with 41.22% share in 2025, showing that fast fulfillment has become a standard customer expectation.
Which delivery model is expanding the fastest through 2031?
C2C is projected to grow at 14.84% CAGR through 2031, supported by resale and recommerce activity that creates more peer-originated parcel flows.
Why are Tier 3 and smaller cities becoming more important for carriers?
Tier 3 and below are forecast to grow at 11.77% CAGR, helped by Amazon’s rural network buildout and USPS access points that expand practical service coverage.
Which product category generates the largest order value flow?
Foods and beverages held 28.49% share in 2025, supported by frequent order cycles and tight delivery windows tied to grocery and essentials demand.
What is changing the competitive structure most in 2026?
Amazon’s logistics opening to outside businesses, USPS network access for third parties, UPS RFID rollout, and FedEx robotics deployment are all widening competition based on technology and network design.
Page last updated on:





