
Telecom Site Power Optimization Market Size and Share
Market Overview
| Study Period | 2021 - 2032 |
|---|---|
| Market Size (2027) | USD 0.79 Billion |
| Market Size (2032) | USD 1.66 Billion |
| Growth Rate (2027 - 2032) | 16.01 % |
| Fastest Growing Market | Asia-Pacific |
| Largest Market | Asia-Pacific |
| Market Concentration | Medium |
Major Players *Disclaimer: Major Players sorted in no particular order Image © Mordor Intelligence. Reuse requires attribution under CC BY 4.0. | |
Telecom Site Power Optimization Market Analysis by Mordor Intelligence
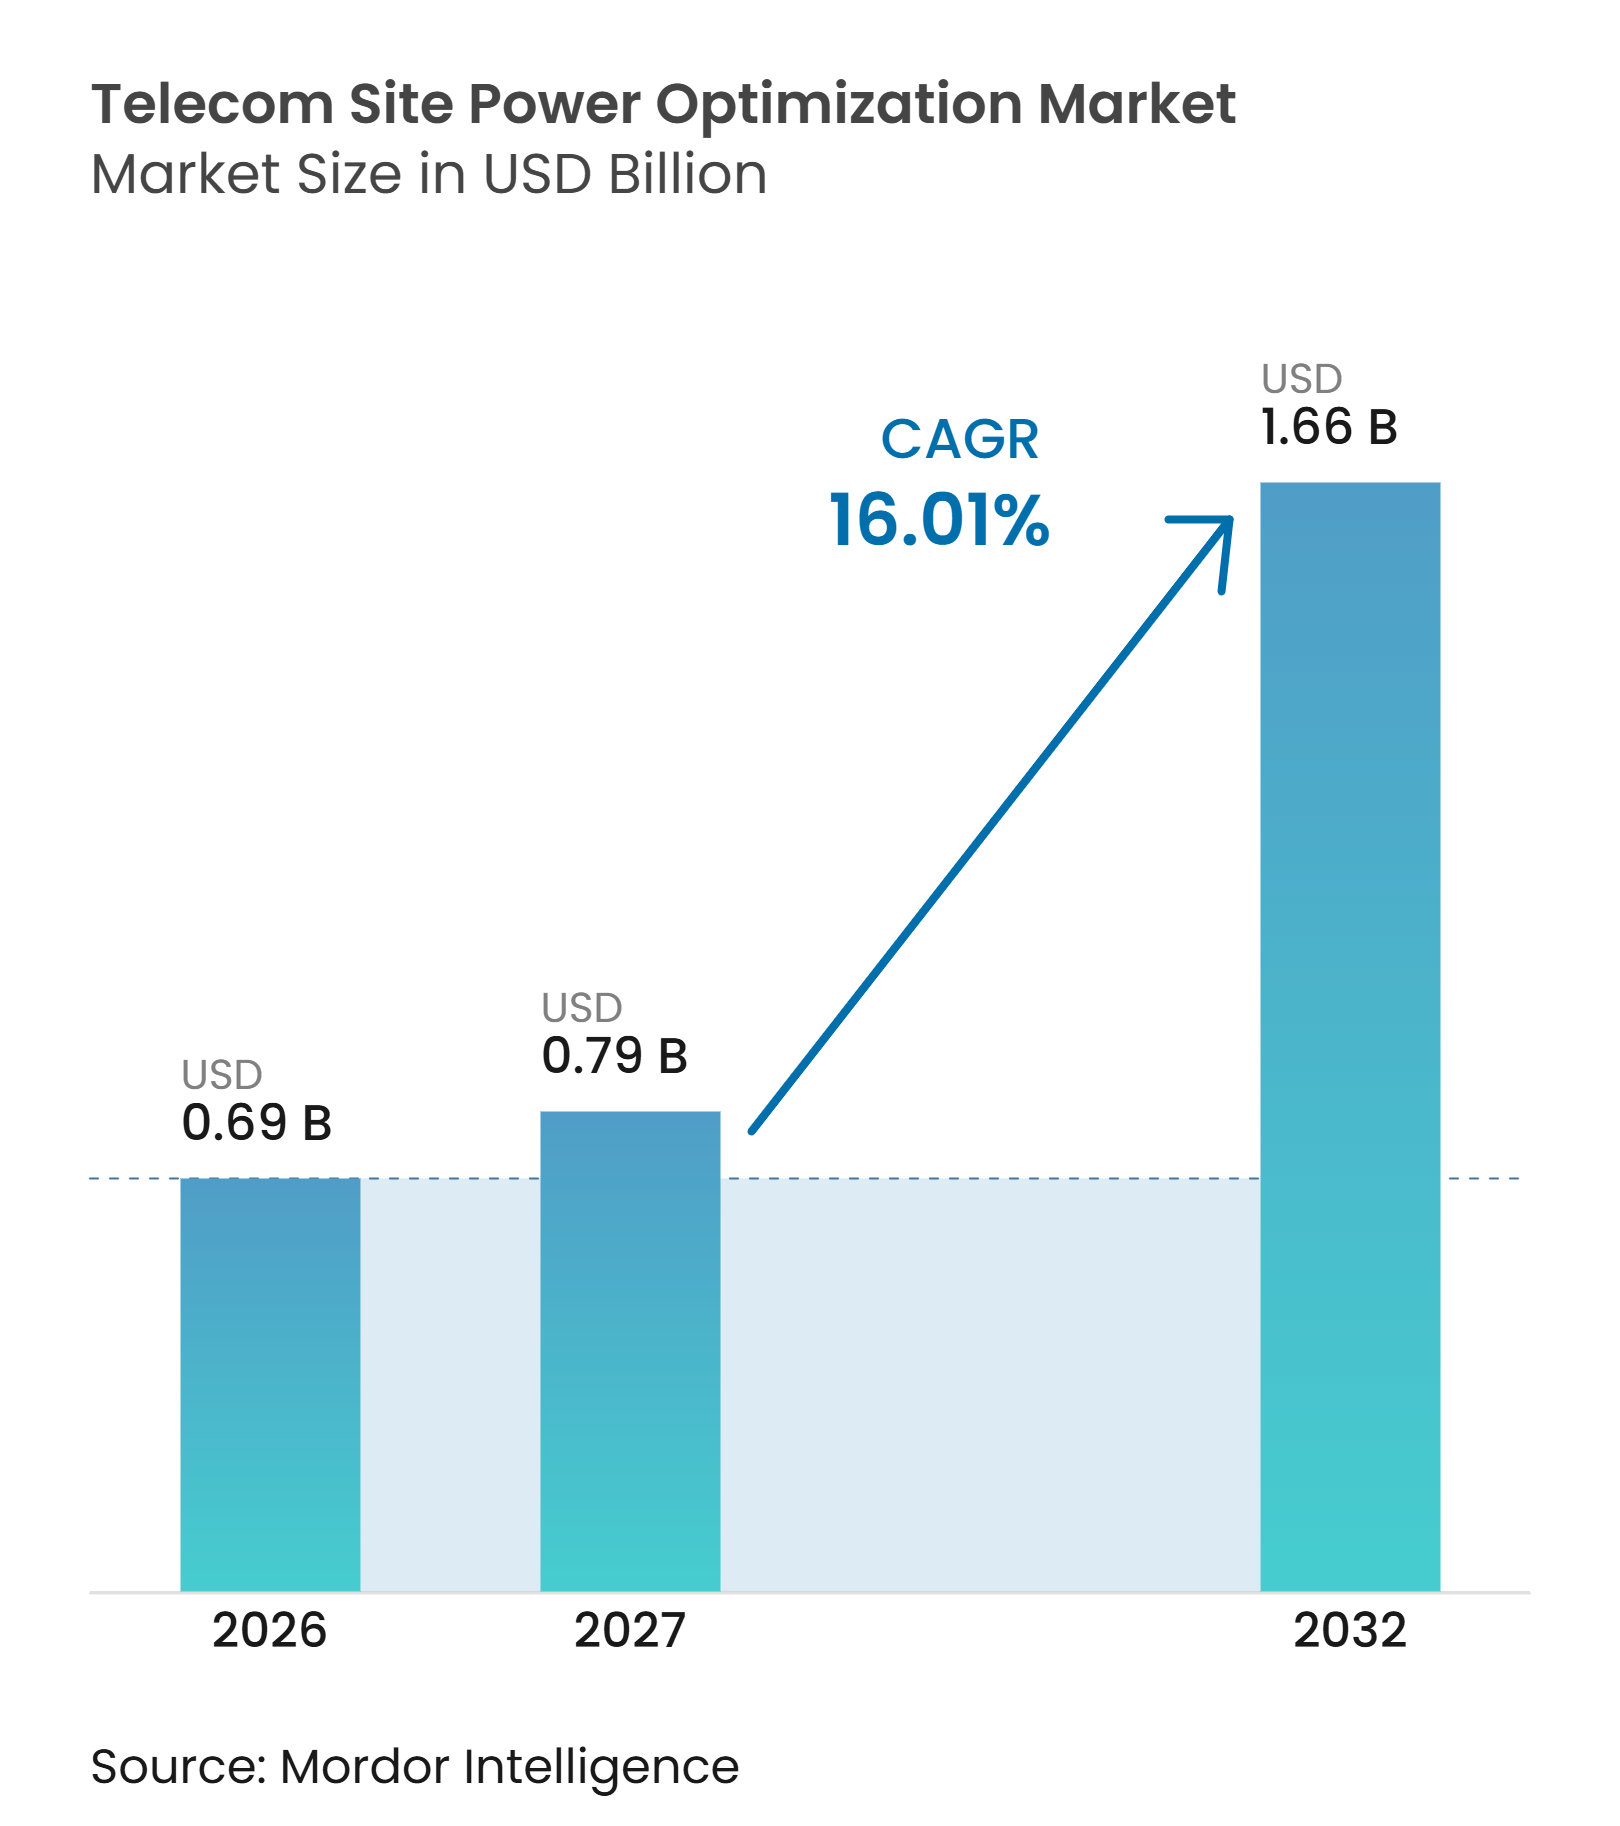
The Telecom Site Power Optimization Market size was valued at USD 0.69 billion in 2026 and is estimated to reach USD 1.66 billion by 2032, at a CAGR of 16.01% during 2027-2032. The telecom site power optimization market is expanding as 5G densification increases site electricity demand and makes power loads less predictable. Operators and tower companies are also treating energy performance as an operating cost, resilience, and emissions-management issue rather than only a backup-power requirement. This is increasing demand for systems that combine power conversion, storage, monitoring, and automated control. Vendors are responding with integrated hardware-and-software offerings, while managed-energy contracts reduce the initial investment burden for some customers. Interoperability with older equipment, site modernization costs, battery safety requirements, and fuel losses at remote sites remain key barriers to adoption.
Key Report Takeaways
- By component, power supply units held 21.33% of the Telecom Site Power Optimization Market share in 2026, while controllers and monitoring systems are projected to expand at a 17.65% CAGR through 2032.
- By solution type, energy monitoring and visibility software held 25.66% revenue share in 2026, while AI-based power optimization software is projected to expand at a 16.99% CAGR through 2032.
- By end user, mobile network operators held 33.46% revenue share in 2026, while private network operators are projected to expand at a 17.49% CAGR through 2032.
- By power source, grid-connected sites accounted for 39.67% of revenue in 2026, while renewable energy is projected to expand at an 18.02% CAGR through 2032.
- By geography, Asia-Pacific accounted for 29.99% of revenue in 2026 and is projected to expand at a 17.34% CAGR through 2032.
Note: Market numbers in this report are based on Mordor Intelligence's proprietary estimation framework, which combines nine months of actuals with Q4 projections for base year 2026.
Market Trends and Insights
Drivers Impact Analysis of Telecom Site Power Optimization Market*
| Driver | (~) % Impact on CAGR Forecast | Geographic Relevance | Impact Timeline |
|---|---|---|---|
| 5G Radio Expansion and Rising Site Power Density | +4.2% | Global | Short term (≤ 2 years) |
| Telecom Energy-Cost Reduction and OPEX Pressure | +3.5% | Global | Short term (≤ 2 years) |
| Renewable-Powered and Hybrid Site Deployment | +2.8% | Asia-Pacific and Middle East and Africa core, spillover to South America | Short term (≤ 2 years) to Medium term (2-4 years) |
| Regulatory Pressure for Energy Efficiency and Emissions Disclosure | +2.0% | Europe and China core, expanding globally | Medium term (2-4 years) |
| AI-Based Traffic-Aware Power Dispatch | +1.5% | Global, led by North America and Asia-Pacific | Medium term (2-4 years) |
| TowerCo Energy-as-a-Service and Shared-Power Models | +1.2% | Asia-Pacific and Middle East and Africa, with early adoption in Europe | Medium term (2-4 years) to Long term (≥ 4 years) |
| Source: Mordor Intelligence | |||
5G Radio Expansion and Rising Site Power Density
The telecom site power optimization market is being driven by the higher and more variable energy requirements of 5G radio networks. A 5G macro cell with multiple bands and massive MIMO configurations draws 5-10 kW under typical load, compared with 2-3 kW at a legacy 2G or 3G site. A study of 37,525 5G base stations found capacity utilization of 26-41%, indicating considerable scope to align site power use more closely with traffic demand. A live-network evaluation of a zero-carbon 5G-Advanced architecture recorded a 32% reduction in daily power consumption, equal to 27.66 kWh per site per day, without reducing LTE or 5G performance indicators. As carrier aggregation and additional spectrum layers are deployed, static power provisioning becomes less suitable for telecom sites. Controllers and monitoring systems therefore serve as the link among radio traffic, tariff signals, renewable output, and battery health.
Telecom Energy-Cost Reduction and OPEX Pressure
Energy costs are a major operating expense for mobile networks, particularly where sites depend on diesel generation. In grid-connected settings, energy can account for 20-30% of network operating costs, while mobile data traffic continues to rise by 25-30% each year. The Wireless Infrastructure Association reported in its North American assessment that hybrid energy systems can reduce site operating expenditure by up to 90% over 10 years and achieve an average payback period of 3 years. In March 2026, the International Finance Corporation committed USD 45 million to IPT PowerTech for 2,235 sites across Ethiopia, Liberia, and Sierra Leone, with modeled power cost reductions of 26-52% per country through solar and battery integration.[1] These conditions support recurring revenue from software, monitoring, and managed services in the telecom site power optimization market rather than only one-time power equipment sales. They also make performance guarantees and transparent reporting more important in vendor selection.
Renewable-Powered and Hybrid Site Deployment
The telecom site power optimization market is supported by renewable and hybrid systems that can reduce diesel use and improve site availability. EdgePoint Towers commissioned its first solar hybrid site in Malaysia in April 2025, using a 5.9 kWp photovoltaic array and battery storage to provide up to 100% of daytime energy requirements. Airtel Nigeria deployed 200 solar-powered towers between April 2025 and March 2026, reporting a 21% improvement in site uptime and a 90% reduction in monthly maintenance costs. Research based on 49,000 base stations in Anhui Province found that solar-plus-storage upgrades with intelligent operating strategies could reduce electricity use by more than 35% and recover investment in just over 4 years.[2] An IEEE Access assessment found that solar photovoltaic systems combined with grid supply and battery storage had daily operating costs 35.8-40.3% below alternative configurations.[3] China’s YD/T 6543-2025 standard, effective from April 2026, also requires base-station greenhouse-gas accounting across 7 gas categories, which increases the value of measured energy data in the telecom site power optimization market.
Regulatory Pressure for Energy Efficiency and Emissions Disclosure
Regulation is moving energy reporting from a voluntary activity toward a more formal operating requirement for telecom infrastructure owners. The European Commission’s work on sustainable telecommunications networks uses the EU Code of Conduct for the Sustainability of Telecommunications Networks as a benchmark across design, deployment, operation, and decommissioning. The GSMA reported that only 1 quarter of the top 100 tower companies had publicly disclosed emissions, despite their combined annual diesel use of 2 billion liters. The European Wireless Infrastructure Association issued carbon-accounting guidance in May 2026 that aligns tower company disclosure with the GHG Protocol and ISO 14064-1:2018.[4] The ITU has also prioritized national monitoring of ICT-sector emissions and telecommunications operators in its 2025-2026 work cycle. These requirements create a lasting role for monitoring, analytics, audit records, and energy-efficiency metrics in the telecom site power optimization market. They also favor suppliers that can connect operational data to credible emissions reporting.
Restraints Impact Analysis of Telecom Site Power Optimization Market*
| Restraint | (~) % Impact on CAGR Forecast | Geographic Relevance | Impact Timeline |
|---|---|---|---|
| High Upfront Cost of Site Modernization | -2.8% | Global, most acute in Africa and South America | Short term (≤ 2 years) to Medium term (2-4 years) |
| Complex Integration With Legacy Multi-Generation Networks | -2.1% | North America and Europe core | Medium term (2-4 years) |
| Battery Safety, Recycling, and Thermal-Runaway Compliance | -1.4% | Global, driven by IEC and local regulations | Long term (≥ 4 years) |
| Fuel Pilferage and Data Integrity at Remote Off-Grid Sites | -0.9% | Africa and Southeast Asia | Short term (≤ 2 years) |
| Source: Mordor Intelligence | |||
High Upfront Cost of Site Modernization
Site modernization in the telecom site power-optimization market requires investment in hybrid power systems, rectifiers, lithium-ion batteries, and digital energy management platforms. Retrofit projects can cost more than greenfield projects because existing site layouts, grid quality, diesel exposure, and equipment condition differ widely. This issue is especially significant at off-grid and weak-grid sites in Africa and Southeast Asia, where accessible project finance is often limited. Managed-energy agreements can shift some capital risk from operators or tower companies to a service provider. However, the supply of qualified telecom energy service companies capable of managing energy performance risk across large portfolios remains limited. Multi-site contracts also require agreement among tenants on shared towers, which can slow adoption even when the operating case is strong.
Complex Integration With Legacy Multi-Generation Networks
The telecom site power optimization market faces deployment friction because many sites operate 2G, 3G, 4G, and 5G equipment together. These systems have different energy profiles, signaling methods, interfaces, and equipment-vendor environments. Older power hardware may not provide the digital interfaces needed for remote telemetry and control. Operators must then either replace equipment or use protocol converters, which add cost, latency, and potential failure points. Existing tower-company contracts can also be based on fixed power budgets rather than dynamic, traffic-aware dispatch. Work by 5TONIC and Ericsson found that data-driven energy management depends on changes to network digital twins and API exposure layers, not only the addition of software.
*Our forecasts treat driver/restraint impacts as directional, not additive. The impact forecasts reflect baseline growth, mix effects, and variable interactions.
Telecom Site Power Optimization Market Segment Analysis
By Component:
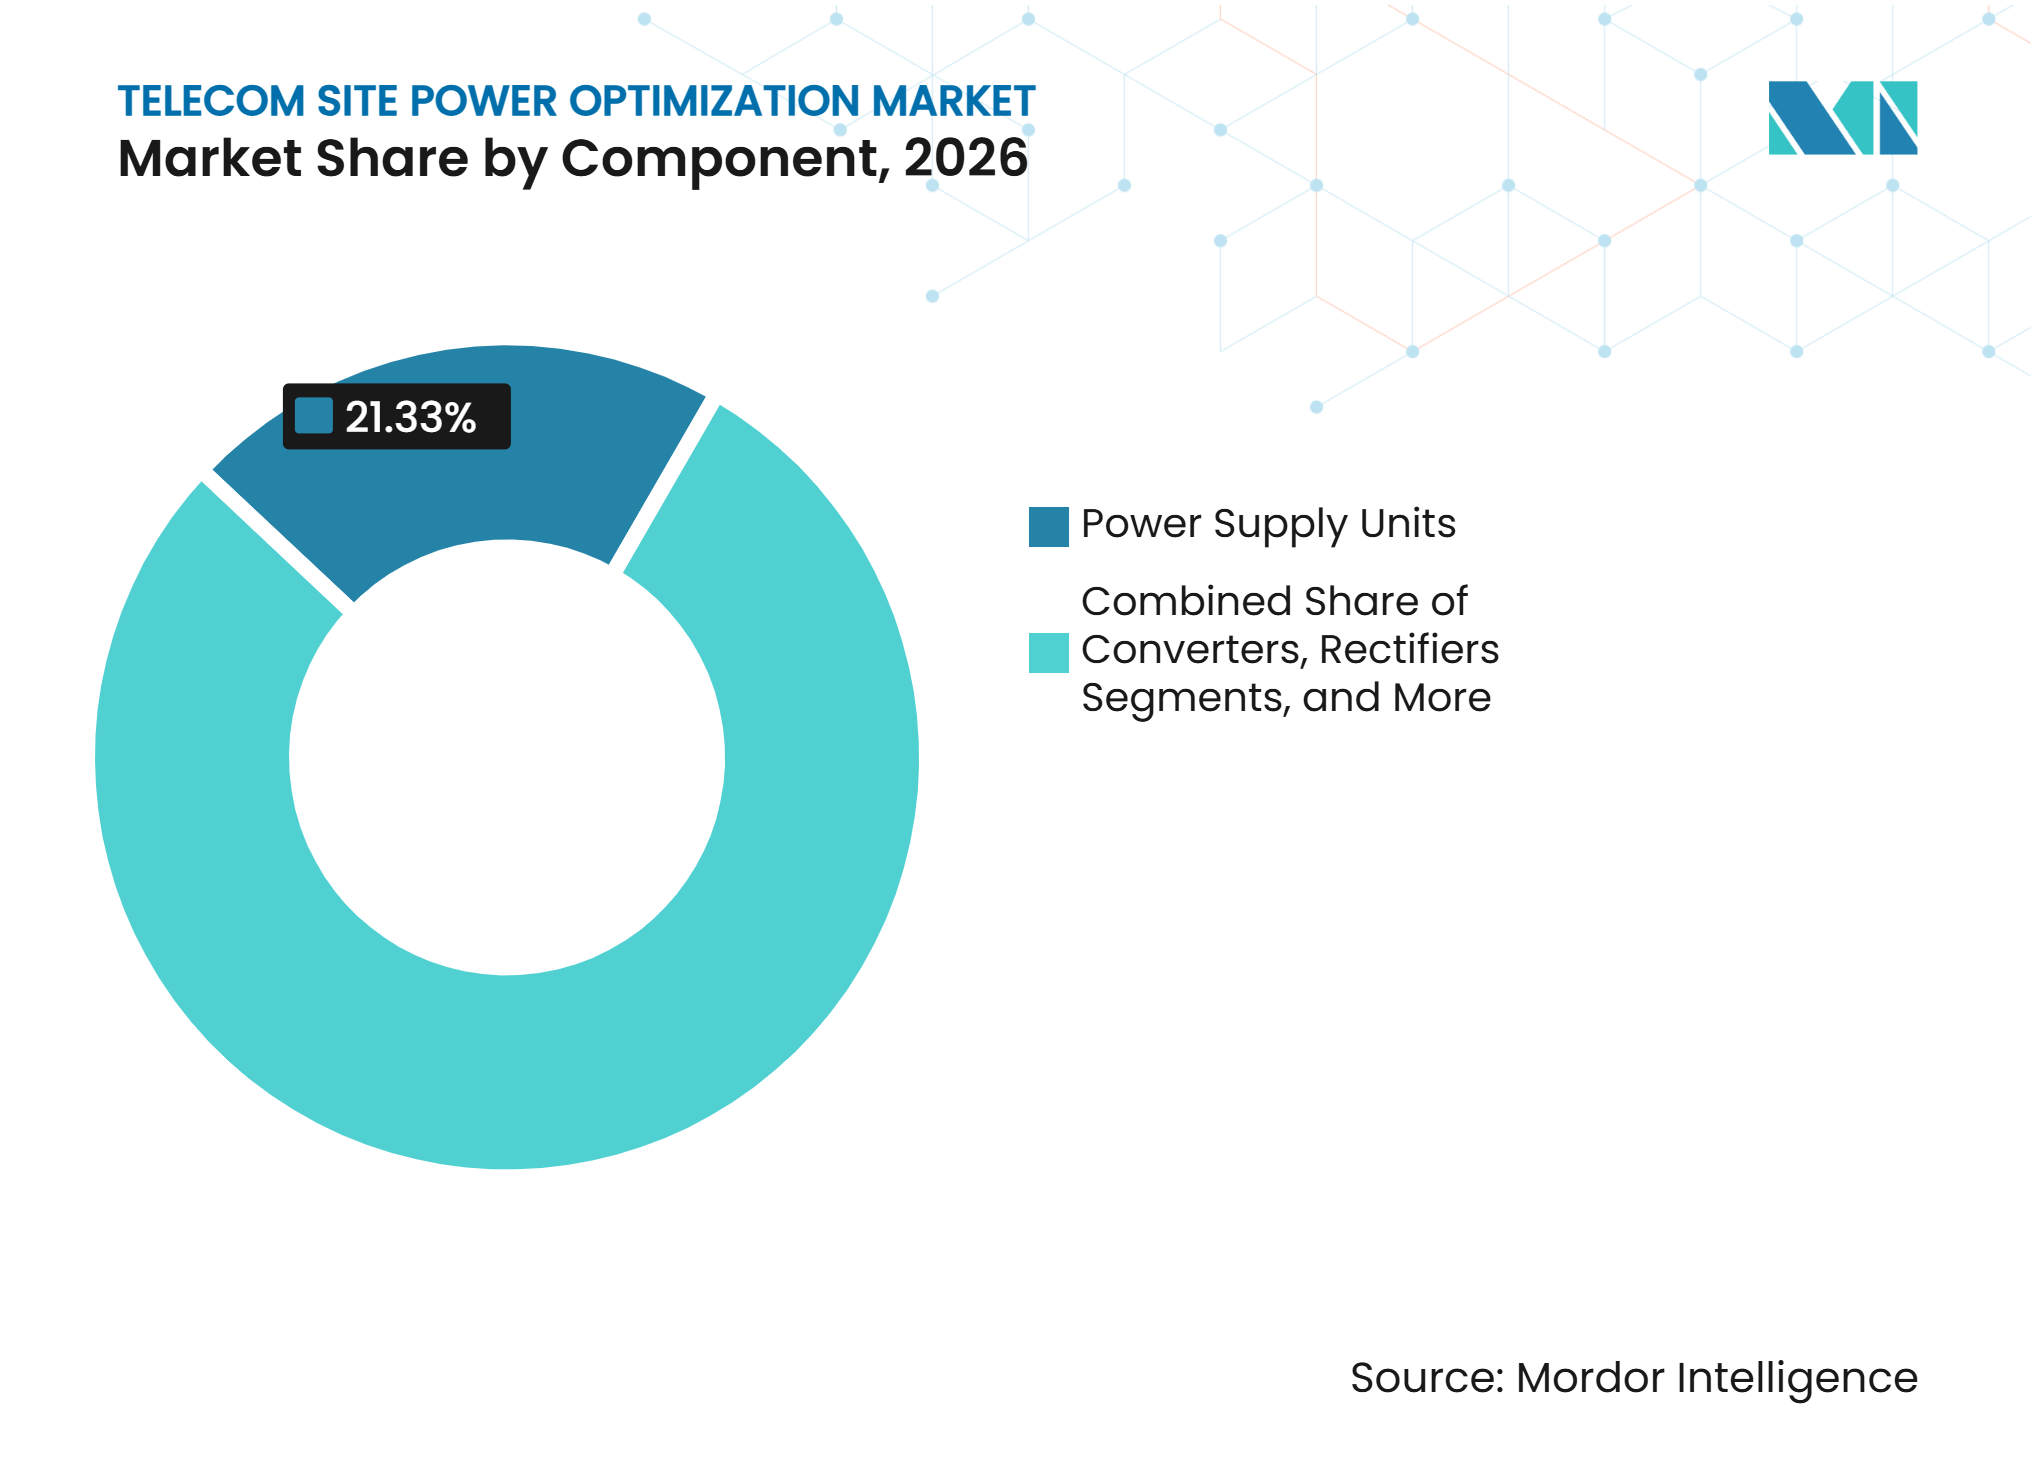
Intelligence Layer Accelerates Beyond Power ConversionPower supply units are projected to hold a 21.33% share of the Telecom Site Power Optimization Market in 2026, as every site requires a reliable power-delivery layer. This category includes AC-DC converters, rectifier modules, outdoor power cabinets, inverters, thermal management equipment, and related hardware used in macro and microcells. The shift from legacy 48V DC designs to higher-voltage systems is expected to drive replacement demand in the Telecom Site Power Optimization Market during 5G upgrades. Converters and rectifiers remain central to this demand, as operators replace less efficient modules.
Controllers and monitoring systems are projected to grow at a 17.65% CAGR through 2032, the fastest rate among component segments. These systems connect radio traffic data, grid tariffs, renewable generation profiles, and battery state-of-health information. They enable operators to replace fixed operating settings with site-specific decisions while supporting recurring software and service revenue. Huawei is expected to introduce AI GreenSite in 2026 as an integrated platform covering grid power, solar storage, diesel, wireless, and service functions. This launch highlights the category’s transition from passive hardware to active coordination across site energy assets.



By Solution Type:
AI Moves From Experimental to Operational StandardEnergy monitoring and visibility software is projected to hold a 25.66% share of the Telecom Site Power Optimization Market in 2026. These platforms provide real-time visibility into site energy consumption, fuel use, and battery status across telecom networks. Tower companies use this information to manage dispersed portfolios and allocate energy consumption among tenants. Energy analytics and reporting software provides trend analysis, operating cost comparisons, carbon accounting capabilities, and support for more structured disclosures in Europe and Asia.
AI-based power optimization software is projected to grow at a 16.99% CAGR through 2032, making it the fastest-growing solution type. Energy management and automation software converts analytics into actions, including load shedding, battery dispatch, and generator scheduling. Nokia reported that AI-based deep-sleep logic deployed with Orange reduced site-level energy consumption by up to 95% during off-peak hours. In London trials conducted in March 2025, Vodafone and Ericsson recorded up to 33% lower daily 5G radio-unit power consumption without affecting user experience. China Mobile’s Hebei branch reported a 1,800-tonne reduction in carbon emissions after deploying a large-model energy management system in Shijiazhuang.
By End User:
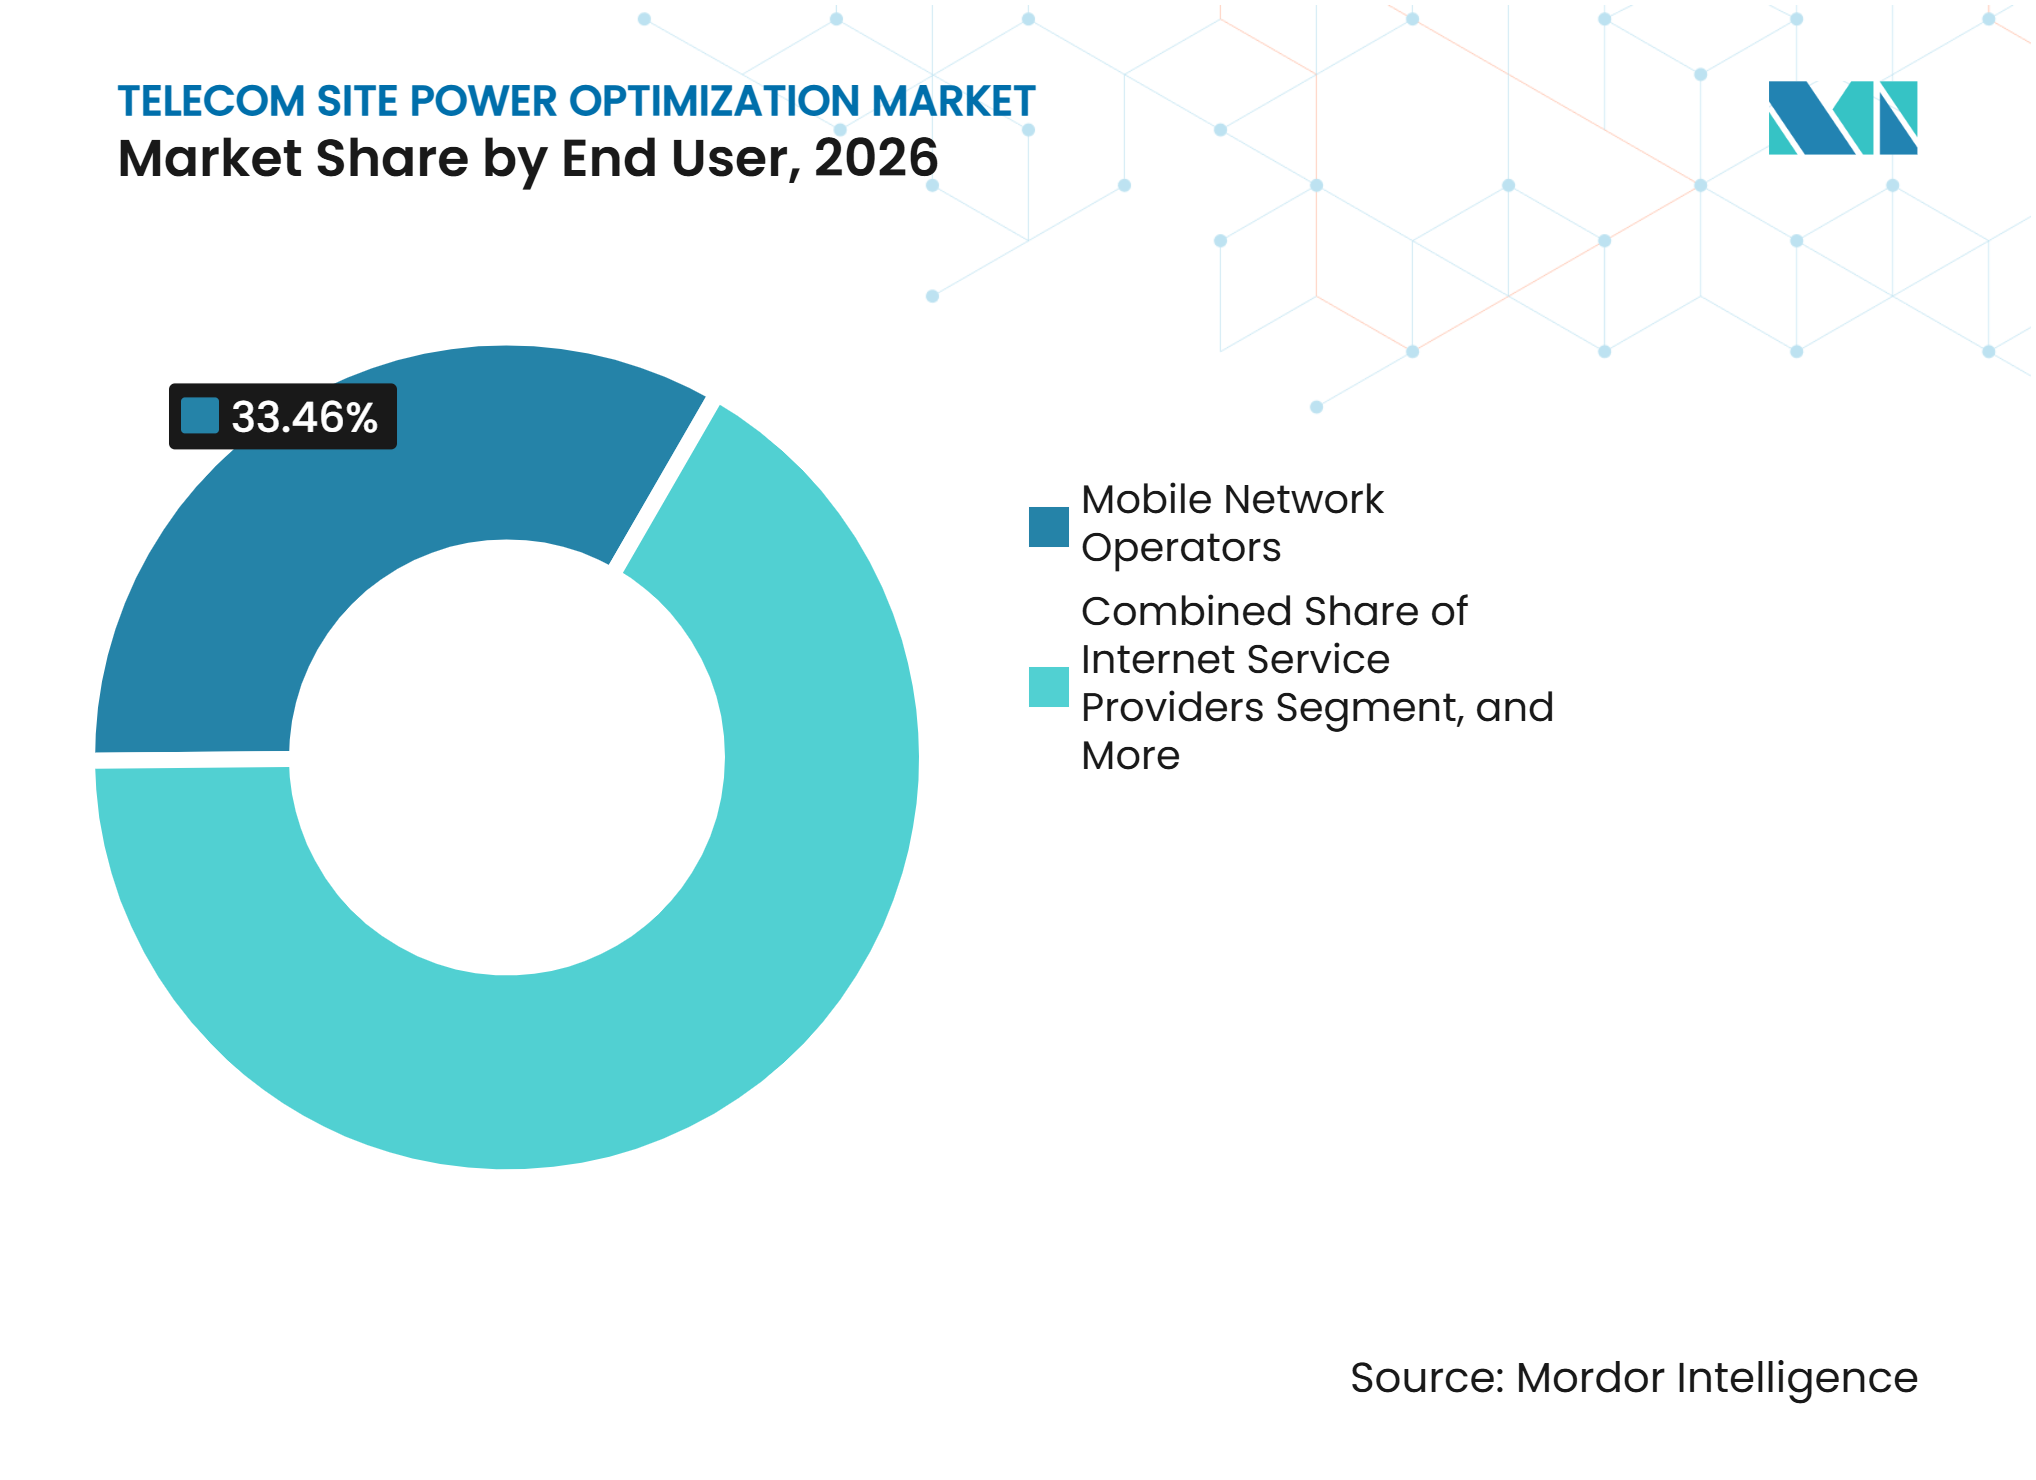
Enterprise Networks Emerge As A High-Value Growth VerticalMobile network operators are projected to hold a 33.46% share of the Telecom Site Power Optimization Market in 2026, supported by the scale of their tower portfolios and exposure to energy costs. Their procurement often covers thousands of sites, all subject to standardized technical requirements. Operators increasingly consider uptime guarantees and integrated carbon reporting alongside equipment performance. Tower companies also require transparent energy allocation among tenant operators at shared sites, while internet service providers and network infrastructure providers require resilient power for fixed wireless, fiber backhaul, wholesale, and interconnection applications.
Private network operators are projected to grow at a CAGR of 17.49% through 2032. Enterprise 5G deployments are increasingly linking network design with broader facility power management priorities. Centralized control-plane functions and lower-power radio dots can reduce the energy requirements of private 5G systems. Research by 5TONIC and Ericsson found that these architectural choices can deliver 30-40% energy savings compared with fixed proprietary systems. These benefits make purpose-built optimization offerings relevant to vendors seeking demand beyond large public-network operators and encourage enterprise customers to consider energy performance early in network planning.

By Power Source:
Renewable Energy Gains Ground As The Grid Model EvolvesGrid-connected sites are projected to account for 39.67% of the Telecom Site Power Optimization Market in 2026. This share reflects the installed base in North America, Europe, and urban Asia-Pacific, where grid supply represents the lowest-cost base configuration. Operators are increasingly pairing these sites with battery storage and demand-response capabilities to reduce peak-tariff exposure, improve resilience, and support participation in grid services. Diesel generator-powered sites remain relevant in Africa, rural Southeast Asia, and parts of South America, where grid coverage remains incomplete.
Renewable energy is projected to grow at a CAGR of 18.02% through 2032, the fastest rate among power-source segments. Hybrid systems combine two or more energy sources under a common controller and are particularly relevant in weak-grid and off-grid locations. An IEEE Access study covering 4,378 base stations in Bali found that solar-based hybrid systems could meet 57% of annual site energy demand at 70% site occupancy, with payback periods ranging from 4 to 9 years depending on site type. China Tower’s Shenzhen virtual power plant initiative integrated base-station storage with grid management, resulting in 8.57 million kWh of adjusted electricity volume and 7,168 tonnes of avoided carbon emissions. These examples demonstrate that storage can support site continuity, grid coordination, and integrated control of solar output, batteries, grid conditions, and radio demand.
Geography Analysis
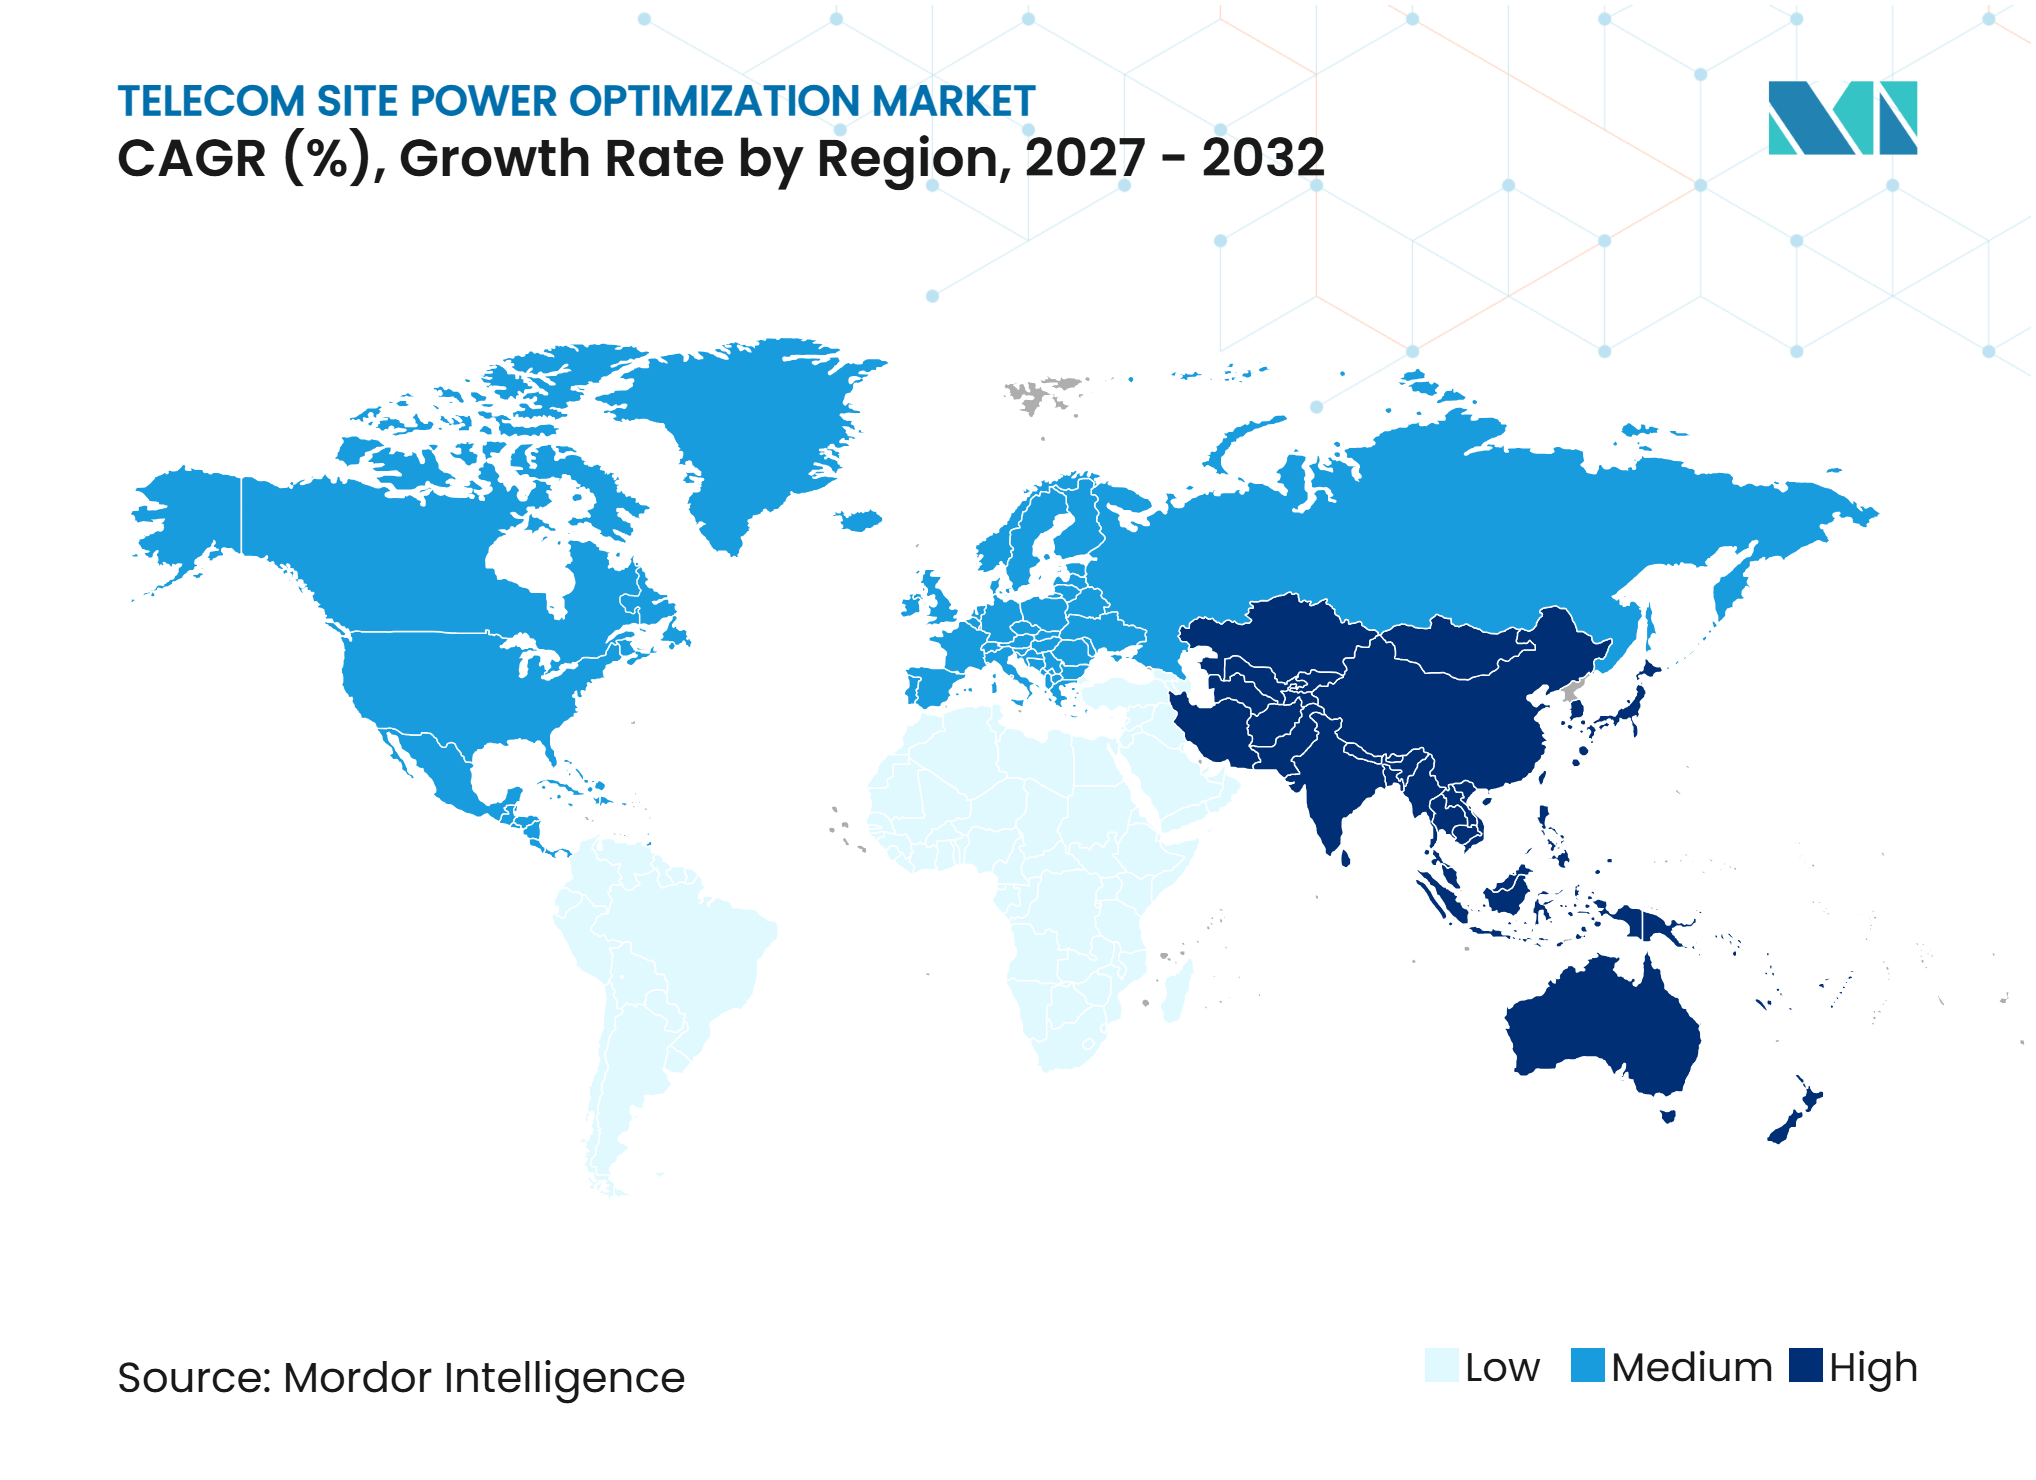
Asia-Pacific
Asia-Pacific accounted for 29.99% of the telecom site power optimization market in 2026 and is projected to grow at a 17.34% CAGR through 2032. China drives regional demand, with 4.838 million 5G base stations operational by the end of 2025. The country increasingly views base-station batteries as assets for virtual power plant applications. China’s 2026–2030 Digital-Green Coordinated Transformation Plan links renewable energy consumption at 5G sites to provincial clean-energy quotas. In addition, YD/T 6543-2025 mandates greenhouse gas accounting at communication base stations from April 2026. India further supports regional demand through Indus Towers’ deployment of 300 zero-emission aluminum-air energy systems, alongside solar-powered sites and lithium-ion microgrids.
Japan, Southeast Asia, and South Korea
Japan, Southeast Asia, and South Korea also contribute to growth in the Asia-Pacific telecom site power optimization market. KDDI deployed its Open Power Station system across 300 base stations in Kyushu, coordinating battery charging and discharging with renewable energy output and grid tariffs. The company also demonstrated demand-response adjustments of 400 kWh per operating cycle. Southeast Asian countries are increasing 5G network density, while tower companies explore managed-energy models. In South Korea, SK Telecom and Schneider Electric announced a partnership in 2025 covering mechanical, electrical, and plumbing systems for AI data centers.
Europe
Europe is a mature, compliance-driven region where energy optimization supports cost management and reporting requirements. The proposed Digital Networks Act references a sustainability code of conduct, while ETSI ES 203 228 provides energy-efficiency metrics for assessment. Deutsche Telekom is rolling out 300 MWh of behind-the-meter battery storage in Germany, with 126 MWh targeted for commissioning by the end of 2026. North America relies on optimization to manage extensive 5G portfolios, grid stress, and resilience requirements. Africa shows strong demand for solar-diesel hybrid systems and telecom energy service company models. Brazil and Argentina lead the South American market, while the Middle East combines high energy costs with network modernization initiatives in Saudi Arabia and the United Arab Emirates.
Competitive Landscape
Market Concentration
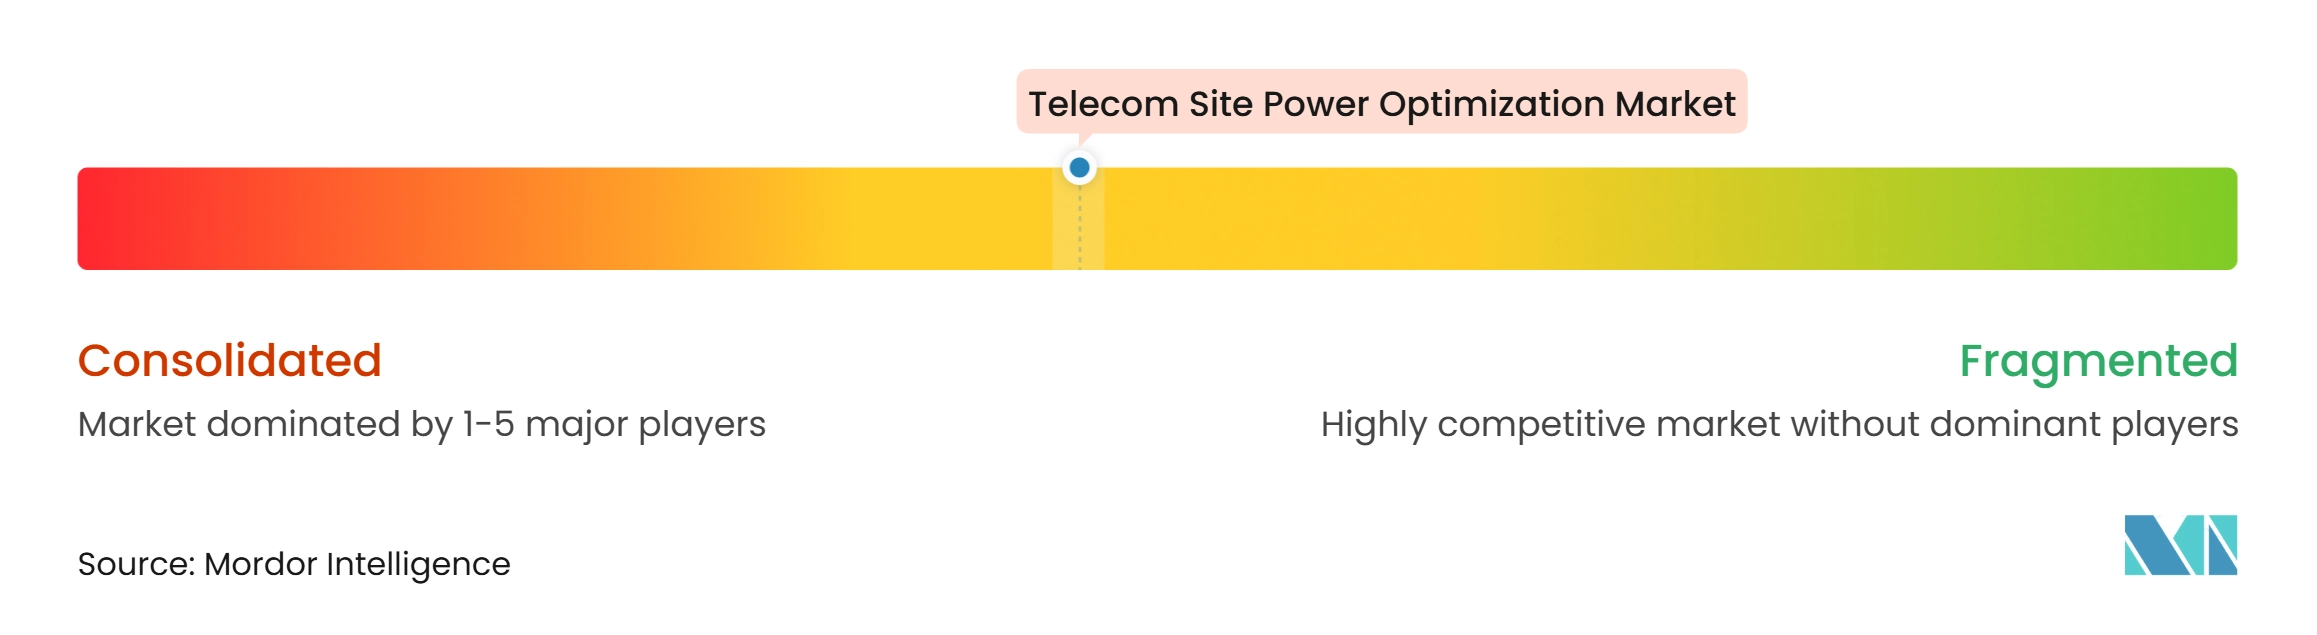
The telecom site power optimization market is moderately concentrated. Huawei Digital Power, Vertiv, Delta Electronics, Eaton, and Schneider Electric compete through integrated hardware and software, global service coverage, and managed energy offerings. Their portfolios include DC power plants, monitoring systems, energy storage integration, cooling solutions, and service support. This breadth is important because tower owners must maintain network availability across widely distributed portfolios. Consequently, procurement in the telecom site power optimization market is shifting beyond initial hardware prices toward lifetime energy costs, uptime, carbon reporting, and renewable energy integration.
Huawei Digital Power is positioning site storage as a grid-interactive asset through its site-power virtual power plant initiatives. The company is expected to introduce AI GreenSite in July 2026, integrating grid, solar, storage, diesel, wireless, and service layers on a unified Huawei Digital Power platform. Vertiv is expected to introduce the PowerDirect 7100 Energy in November 2025 for telecom and edge applications, supporting grid, generator, solar, wind, and fuel-cell inputs. In February 2025, Ballard Power Systems and Vertiv are expected to partner on a zero-emission hydrogen fuel-cell UPS system for critical backup applications.
Radio access network suppliers are also entering the optimization software layer. Nokia and Ericsson can embed energy management functions within radio network platforms, giving operators a choice between integrated and standalone systems. Future Connections is expected to deploy its NIx RAN Energy Saver application at MasOrange in December 2025 through the Ericsson Intelligent Automation Platform. Managed energy providers compete by assuming capital and performance risks for operators in off-grid and weak-grid areas. Meanwhile, smaller software providers use open, multi-vendor interfaces, while suppliers respond to price pressure on basic rectifier hardware by offering analytics, lifecycle services, integrated cooling, and emissions reporting.
Telecom Site Power Optimization Industry Leaders
-
Huawei Technologies Co., Ltd.
-
Delta Electronics, Inc.
-
Vertiv Holdings Co
-
Schneider Electric SE
-
Eaton Corporation plc
- *Disclaimer: Major Players sorted in no particular order
Telecom Site Power Optimization Market Companies Covered in this Report
- Huawei Technologies Co., Ltd.
- Delta Electronics, Inc.
- Vertiv Holdings Co
- Eaton Corporation plc
- Schneider Electric SE
- Telefonaktiebolaget LM Ericsson
- Nokia Corporation
- ZTE Corporation
- Cummins Inc.
- ABB Ltd.
- Siemens AG
- Enedo Oyj
- Alpha Technologies Services, Inc.
- GE Vernova Inc.
- Mitsubishi Electric Corporation
- GenCell Ltd.
- Ballard Power Systems Inc.
- Honeywell International Inc.
- Socomec Group S.A.
- Sungrow Power Supply Co., Ltd.
- Eltek AS
Recent Industry Developments in Telecom Site Power Optimization Market
- October 2026: NTT DOCOMO and NTT announced the world's first demonstration of coordinated control of workload shifting and energy management at radio base stations, integrating reinforcement-learning-based energy operating plans with AI-driven equipment scheduling to simultaneously optimize solar generation, battery dispatch, and vRAN compute load, with evaluation planned through December 2026.
- September 2026: Schneider Electric unveiled the world's first software-defined medium-voltage switchgear, expanding its AI-ready telecom and data center power portfolio with digitally configurable protection and monitoring capabilities that enable remote power management and reduce commissioning time across large site portfolios.
- July 2026: Huawei Digital Power launched AI GreenSite, described as the industry's first end-to-end intelligent collaboration system integrating grid, power, solar storage, diesel, wireless, and service layers into a unified optimization platform for mobile operator sites.
- June 2026: China Mobile's Hebei branch deployed a DeepSeek large-model-based AI energy management system across its 5G base station network in Shijiazhuang, achieving approximately 1,800 tonnes of annual carbon emission reduction and compressing per-cycle energy strategy generation from 7.6 hours to under 10 minutes.
Global Telecom Site Power Optimization Market Report Scope
The Telecom Site Power Optimization Market Report is Segmented by Component (Power Supply Units, Converters, Rectifiers, Inverters, and Controllers and Monitoring Systems), Solution Type (Energy Monitoring and Visibility Software, Energy Analytics and Reporting Software, AI-Based Power Optimization Software, and Energy Management and Automation Software), End User (Mobile Network Operators, Tower Companies, Internet Service Providers, Network Infrastructure Providers, and Private Network Operators), Power Source (Grid-Connected, Diesel Generator, Renewable Energy, and Hybrid Power), and Geography (North America, South America, Europe, Asia-Pacific, and the Middle East and Africa). The Market Forecasts are Provided in Value (USD).
Segmentation Overview
| Power Supply Units |
| Converters |
| Rectifiers |
| Inverters |
| Controllers and Monitoring Systems |
| Other Components |
| Energy Monitoring and Visibility Software |
| Energy Analytics and Reporting Software |
| AI-Based Power Optimization Software |
| Energy Management and Automation Software |
| Other Solution Type |
| Mobile Network Operators |
| Tower Companies |
| Internet Service Providers |
| Network Infrastructure Providers |
| Private Network Operators |
| Grid-Connected |
| Diesel Generator |
| Renewable Energy |
| Hybrid Power |
| North America | United States |
| Canada | |
| Mexico | |
| South America | Brazil |
| Argentina | |
| Rest of South America | |
| Europe | Germany |
| United Kingdom | |
| France | |
| Italy | |
| Rest of Europe | |
| Asia-Pacific | China |
| India | |
| Japan | |
| South Korea | |
| Southeast Asia | |
| Rest of Asia-Pacific | |
| Middle East | Saudi Arabia |
| United Arab Emirates | |
| Rest of Middle East | |
| Africa | South Africa |
| Nigeria | |
| Rest of Africa |
| By Component | Power Supply Units | |
| Converters | ||
| Rectifiers | ||
| Inverters | ||
| Controllers and Monitoring Systems | ||
| Other Components | ||
| By Solution Type | Energy Monitoring and Visibility Software | |
| Energy Analytics and Reporting Software | ||
| AI-Based Power Optimization Software | ||
| Energy Management and Automation Software | ||
| Other Solution Type | ||
| By End User | Mobile Network Operators | |
| Tower Companies | ||
| Internet Service Providers | ||
| Network Infrastructure Providers | ||
| Private Network Operators | ||
| By Power Source | Grid-Connected | |
| Diesel Generator | ||
| Renewable Energy | ||
| Hybrid Power | ||
| By Geography | North America | United States |
| Canada | ||
| Mexico | ||
| South America | Brazil | |
| Argentina | ||
| Rest of South America | ||
| Europe | Germany | |
| United Kingdom | ||
| France | ||
| Italy | ||
| Rest of Europe | ||
| Asia-Pacific | China | |
| India | ||
| Japan | ||
| South Korea | ||
| Southeast Asia | ||
| Rest of Asia-Pacific | ||
| Middle East | Saudi Arabia | |
| United Arab Emirates | ||
| Rest of Middle East | ||
| Africa | South Africa | |
| Nigeria | ||
| Rest of Africa | ||
Key Questions Answered in the Report
What is the size of the Telecom Site Power Optimization Market?
The Telecom Site Power Optimization Market was valued at USD 0.69 billion in 2026 and is forecast to reach USD 1.66 billion by 2032 at a 16.01% CAGR.
What is driving demand for telecom site power optimization?
5G densification, electricity costs, resilience needs, renewable integration, and emissions-reporting requirements are increasing demand for intelligent site power systems.
Which component leads telecom site power optimization spending?
Power supply units led the component category with a 21.33% share in 2026, while controllers and monitoring systems have the highest forecast CAGR of 17.65%.
Which solution type is expanding fastest?
AI-based power optimization software is projected to expand at a 16.99% CAGR through 2032, supported by traffic-aware energy control and automation.
Which end users create the most demand?
Mobile network operators accounted for 33.46% of 2026 revenue due to their large site portfolios, while private network operators are projected to expand at a 17.49% CAGR.
Which region is most important for deployment?
Asia-Pacific led with 29.99% of revenue in 2026 and is projected to expand at a 17.34% CAGR through 2032.