
Telecom Performance Management Software Market Size and Share
Market Overview
| Study Period | 2020 - 2031 |
|---|---|
| Market Size (2026) | USD 5.37 Billion |
| Market Size (2031) | USD 8.96 Billion |
| Growth Rate (2026 - 2031) | 10.78 % |
| Fastest Growing Market | Asia-Pacific |
| Largest Market | North America |
| Market Concentration | Medium |
Major Players *Disclaimer: Major Players sorted in no particular order Image © Mordor Intelligence. Reuse requires attribution under CC BY 4.0. | |
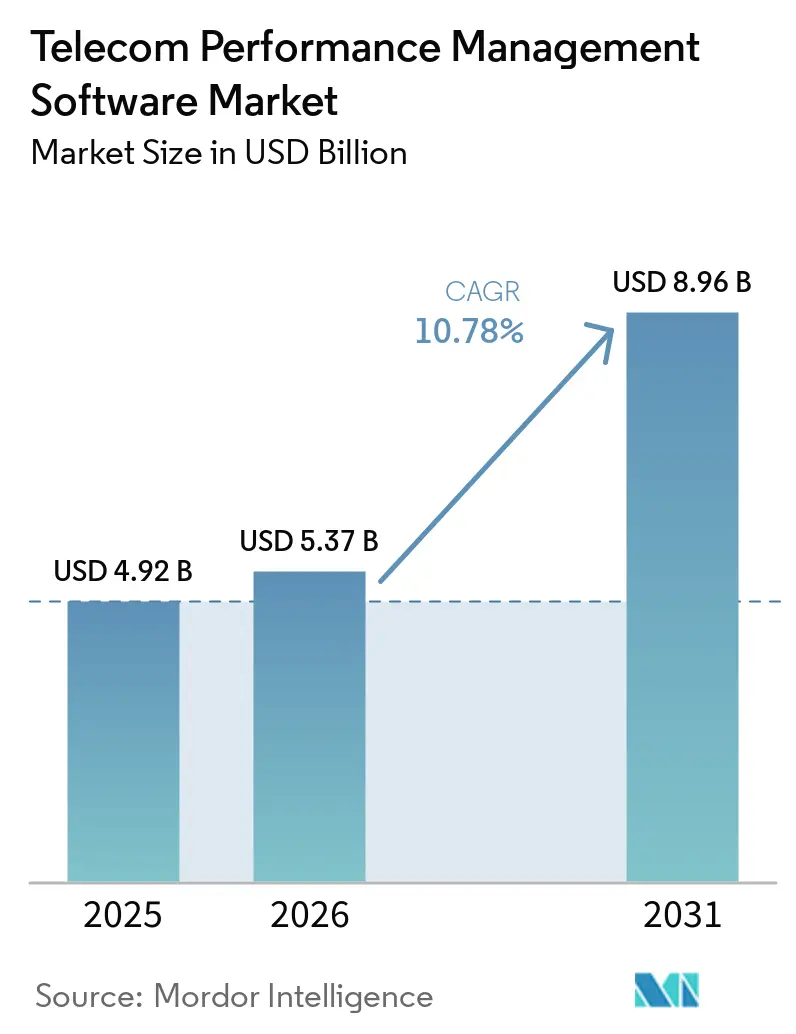
Telecom Performance Management Software Market Analysis by Mordor Intelligence
The Telecom performance management software market size was USD 4.92 billion in 2025 and is forecast to reach USD 8.96 billion by 2031, at a CAGR of 10.78% during 2026-2031. Growth reflects the commercial rollout of 5G Standalone networks, which require operators to assure performance for individual network slices. It also reflects a move toward cloud-native OSS and BSS platforms, in which monitoring tools can work alongside the network functions they monitor. AI-driven automation is raising the value of accurate, low-latency network data because automated decisions depend on reliable telemetry. These changes support enterprise contracts with service-level commitments and give vendors opportunities to offer software, integration, and managed services. The telecom performance management software market is therefore becoming more closely tied to operators' service revenues and network modernization plans.
Key Report Takeaways
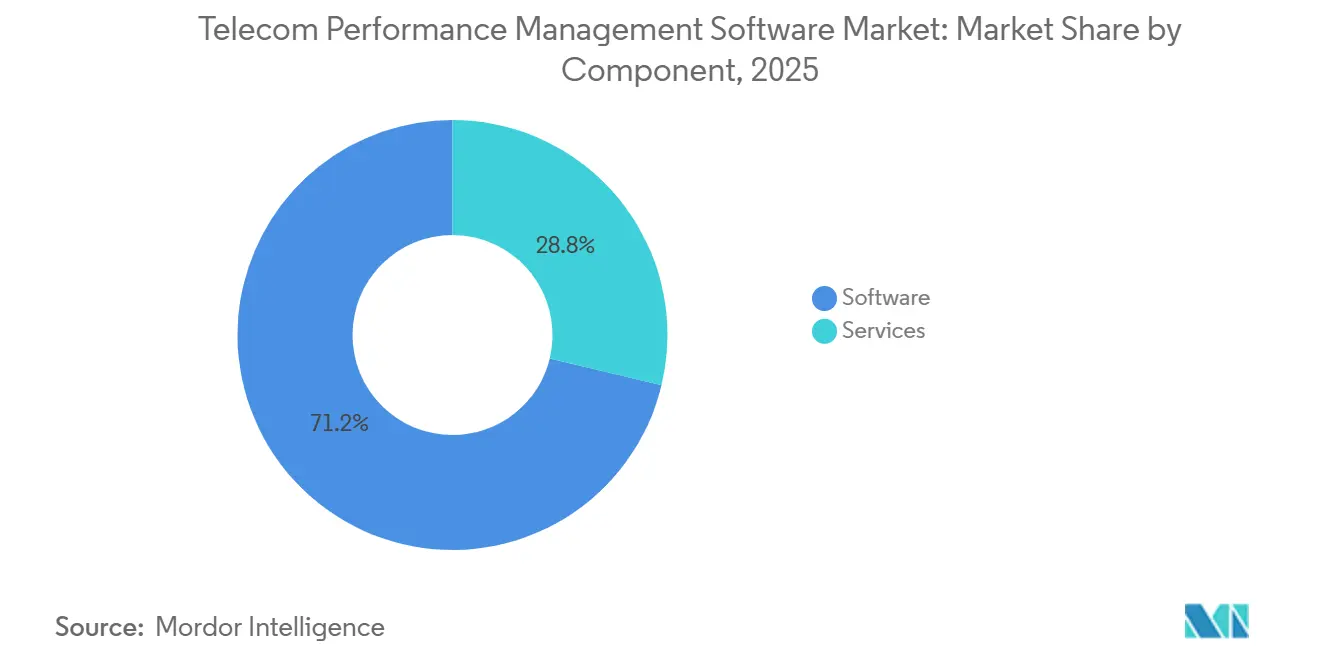
- By component, software held 71.24% of the Telecom performance management software market share in 2025, while services are projected to expand at an 11.54% CAGR through 2031.
- By deployment mode, cloud-based solutions held 63.78% of revenue in 2025 and are projected to grow at an 11.82% CAGR through 2031.
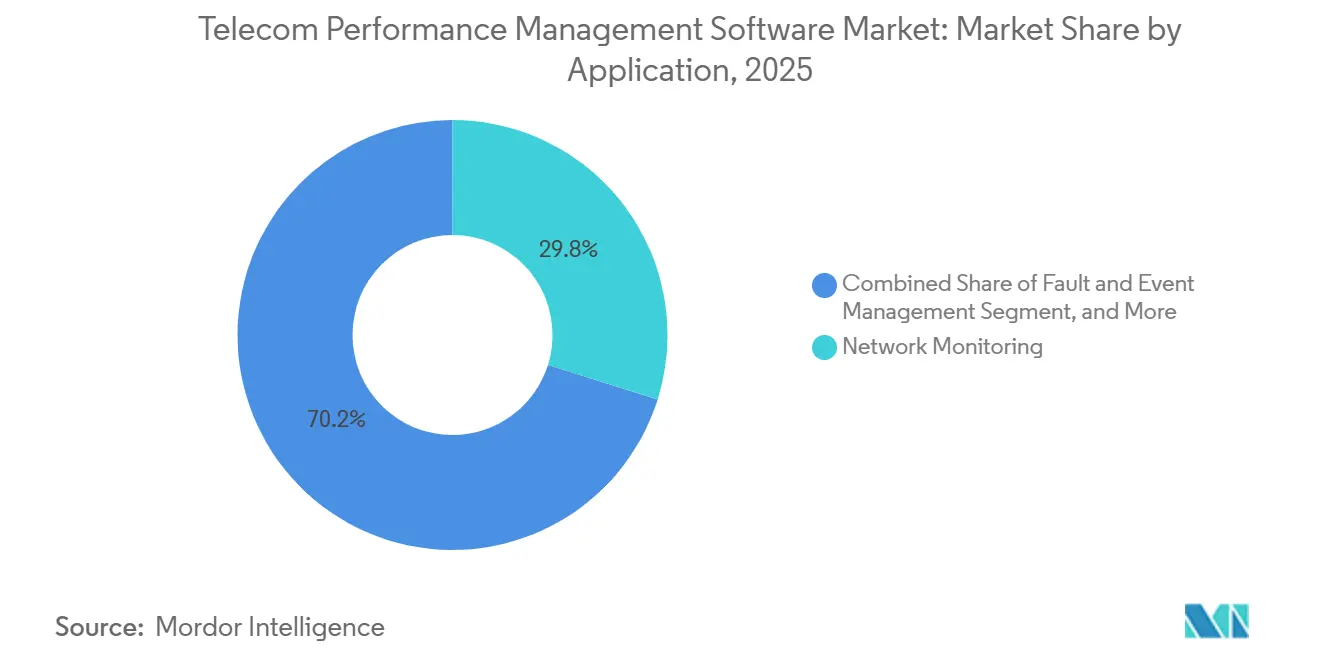
- By application, network monitoring accounted for 29.84% of revenue in 2025, while capacity planning and optimization is projected to grow at a 12.08% CAGR through 2031.
- By network domain, RAN held 33.56% of revenue in 2025, while edge and cloud infrastructure are projected to grow at a 12.34% CAGR through 2031.
- By organization size, large enterprises held 79.42% of revenue in 2025, while SMEs are projected to grow at an 11.93% CAGR through 2031.
- By end user, telecommunications operators held 51.63% of revenue in 2025, while private network operators are projected to grow at a 12.18% CAGR through 2031.
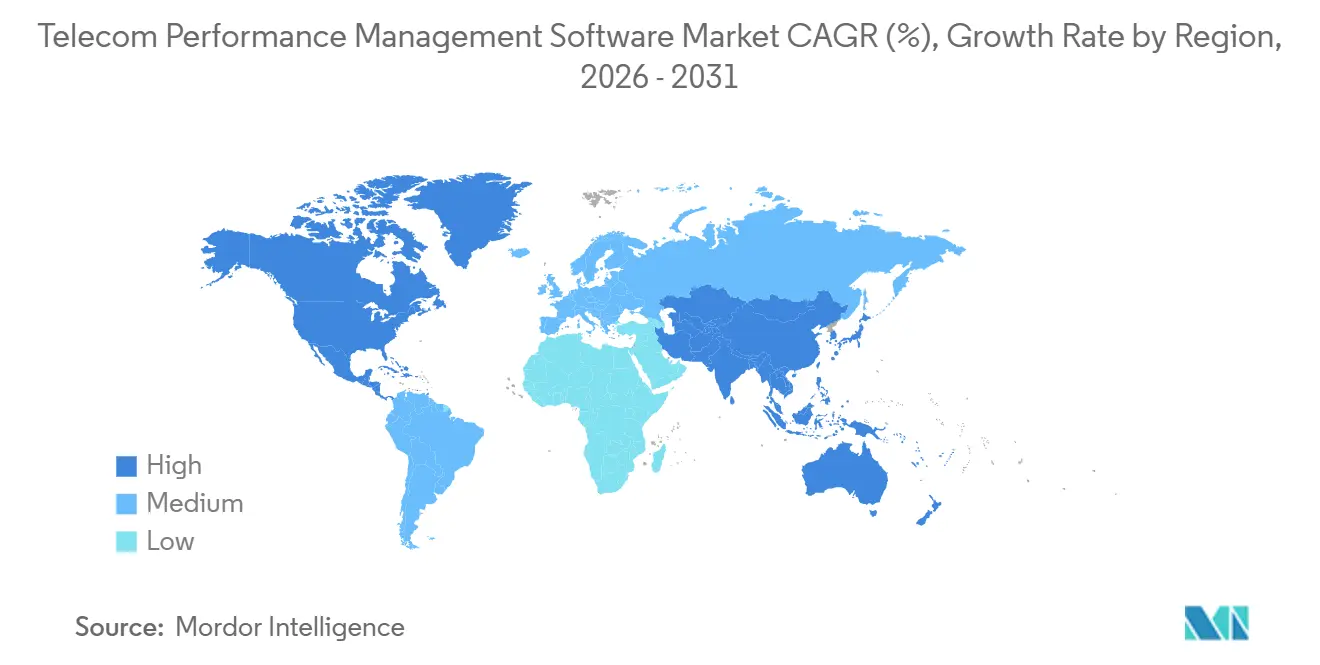
- By geography, North America held 35.18% of revenue in 2025, while Asia-Pacific is projected to grow at a 12.42% CAGR through 2031.
Note: Market size and forecast figures in this report are generated using Mordor Intelligence’s proprietary estimation framework, updated with the latest available data and insights as of January 2026.
Market Trends and Insights
Drivers Impact Analysis of Telecom Performance Management Software Market*
| Driver | (~) % Impact on CAGR Forecast | Geographic Relevance | Impact Timeline |
|---|---|---|---|
| Accelerating 5G Standalone and Network Slicing Deployments | +2.7% | Global, led by Asia-Pacific, North America, and Europe | Short term (≤ 2 years) |
| AI-Driven Predictive Assurance and Closed-Loop Automation | +2.3% | Global | Medium term (2-4 years) |
| Rising Multi-Vendor and Multi-Domain Network Complexity | +1.9% | Global, especially Open RAN markets | Medium term (2-4 years) |
| Increasing Demand for SLA-Backed Enterprise Connectivity | +1.5% | North America, Europe, and core Asia-Pacific markets | Medium term (2-4 years) |
| Cloud-Native OSS Transformation and Distributed Network Operations | +1.2% | North America, Europe, core Asia-Pacific markets, and spillover to Middle East and Africa | Long term (≥ 4 years) |
| Growth in Data Traffic, Connected Devices, and Edge Workloads | +0.9% | Global | Long term (≥ 4 years) |
| Source: Mordor Intelligence | |||
Accelerating 5G Standalone and Network Slicing Deployments
Commercial 5G Standalone deployments are increasing demand for slice-aware performance tools that were not needed in 4G-era OSS environments. Standalone networks require assurance of KPIs across radio access, transport, and core domains for each slice. 3GPP TS 28.554 defines end-to-end slicing KPIs that cover accessibility, integrity, utilization, and retainability.[1] Nokia and AWS presented an agentic AI-powered 5G-Advanced slicing solution in February 2026, with du and Orange identified as initial adopters.[2] NETSCOUT extended Omnis AI Insights to support predictive maintenance and network security across 5G, RAN, core, MEC, and transport domains. Enterprise customers are increasingly asking operators to demonstrate service performance, making assurance software relevant to both commercial delivery and network operations.
AI-Driven Predictive Assurance and Closed-Loop Automation
The telecom performance management software market is moving from reactive fault handling toward predictive assurance and closed-loop automation. Ericsson introduced Agentic rApp as a Service on AWS in February 2026 and reported that its platform supported more than 100 million AI inferences each day across 11 million cells serving over 2 billion subscribers. RADCOM introduced its Neura AI Agent Suite in February 2026 for network operations, service assurance, and customer care. The suite uses coordinated agents for root-cause analysis and supports Model Context Protocol and Agent-to-Agent communication standards. Deutsche Telekom developed the MINDR agent system with Google Cloud to correlate signals across network domains and identify service issues before customers experience them.[3] Vendors are increasingly competing on the quality of operational decisions and on demonstrated reductions in restoration time and SLA breaches, rather than on data collection alone.
Rising Multi-Vendor and Multi-Domain Network Complexity
Carrier networks now span 5G, 4G, Open RAN, cloud core, and fixed access domains simultaneously. This operating environment requires data integration because a vendor's native tools do not necessarily provide a complete view across domains. Operators can run hundreds of OSS and BSS systems with varying data formats and interfaces, limiting consistent analysis across their networks. Ericsson and Nokia announced a March 2026 cross-ecosystem SMO collaboration, under which each company joined the other's ecosystem to support multivendor rApp deployment. The collaboration shows that interoperability is becoming necessary for closed-loop automation. The telecom performance management software market favors cloud-agnostic and vendor-neutral platforms that support standardized interfaces and reduce the risk of proprietary lock-in.
Increasing Demand for SLA-Backed Enterprise Connectivity
Enterprise customers using private 5G, SD-WAN, and IoT networks increasingly require contractual service-level commitments. Operators need real-time evidence of network performance to support those commitments. Mycom launched SLA Guardian with LatenceTech in March 2026 to provide AI-driven monitoring across public and private 5G, SD-WAN, and satellite environments. A March 2026 joint demonstration led by NTT East Japan involved 26 companies and examined multivendor RIC applications for transmission power optimization in local 5G settings. The work reflected interest in performance-guaranteed local networks for manufacturing and logistics. This demand is bringing telecom-grade assurance and enterprise network management closer together, which expands the customer base for the telecom performance management software market.
Restraints Impact Analysis of Telecom Performance Management Software Market*
| Restraint | (~) % Impact on CAGR Forecast | Geographic Relevance | Impact Timeline |
|---|---|---|---|
| Legacy OSS Data Silos and Inconsistent KPI Semantics | -1.5% | Global, most acute in Middle East, Africa, and South America | Long term (≥ 4 years) |
| High Integration and Migration Costs Across Multi-Vendor Networks | -1.3% | Global | Medium term (2-4 years) |
| Shortage of Telecom-AIOps and Network Data Engineering Skills | -0.9% | Global, most acute in Africa and South America | Medium term (2-4 years) |
| Cybersecurity, Data Sovereignty, and Operational-Data Governance Risks | -0.7% | Europe, Asia-Pacific, and Middle East | Medium term (2-4 years) |
| Source: Mordor Intelligence | |||
Legacy OSS Data Silos and Inconsistent KPI Semantics
Legacy OSS systems remain a constraint on AI-enabled performance management because network information is often distributed across many incompatible systems. Different vendor systems may define or record the same KPI differently, making cross-domain calculations less reliable. A latency measure from a RAN platform, for example, may not align directly with one taken from a core monitoring tool. Operators must normalize data and strengthen inventory governance before they can effectively train AI models. TM Forum's PRISM-AI Phase II work presented in June 2026 showed the role of common standards, AI analytics, and cross-vendor integration in addressing these silos.[4] These programs require time, funding, and engineering capacity, which slows adoption in the telecom performance management software market.
High Integration and Migration Costs Across Multi-Vendor Networks
Migration to cloud-native, AI-ready platforms requires connections to vendor-specific interfaces, mediation layers, and data normalization tools. Open RAN networks add additional work because the O1, A1, and E2 interfaces can differ across vendor releases. Suppliers must maintain connector libraries to keep their platforms compatible with current network software. Vodafone Ireland went live with Amdocs Network Inventory in May 2026, following a multi-year engineering collaboration to replace a legacy system. Such projects can be difficult for smaller operators to fund and operate. Managed performance-management services can reduce this burden by shifting integration responsibility to the provider in return for recurring subscription revenue.
*Our forecasts treat driver/restraint impacts as directional, not additive. The impact forecasts reflect baseline growth, mix effects, and variable interactions.
Telecom Performance Management Software Market Segment Analysis
By Component:
Software Leads Revenue as Services Define the Next Growth CycleSoftware accounted for 71.24% of the Telecom performance management software market size in 2025. Within the telecom performance management software market, operators favor software platforms that place analytics directly within network operations workflows. These platforms can connect with OSS, BSS, and AI pipelines through standard APIs. This reduces the need to hand off data between separate environments. The installed base reflects investment in unified network operations center dashboards, AIOps-ready data lakes, and API-first architectures. It also reflects the need to consolidate multivendor RAN, transport, and core telemetry into a single operational view.
Services are projected to grow at an 11.54% CAGR through 2031. Operators are using managed services, systems integration, and AIOps consulting when they lack large internal data engineering teams. Mycom announced a multiyear agreement, effective June 2026, with a Tier-1 European CSP for its PrOptima Performance Management application on AWS. The agreement illustrates SaaS delivery in which the provider assumes responsibility for integration and AI model governance. As operators advance toward Level 4 autonomous operations, service providers can also support model retraining and outcome-based SLA management. This gives vendors with professional service capabilities an additional route to revenue.
By Deployment Mode:
Cloud Consolidates Leadership While Hybrid Preserves Regulated WorkloadsCloud-based deployment represented 63.78% of revenue in 2025 and is projected to grow at an 11.82% CAGR through 2031. Within the telecom performance management software market, its large share and faster growth indicate a broad cloud-native OSS transition, rather than adoption limited to greenfield operators. Cloud platforms allow operators to deploy assurance, orchestration, inventory, and automation capabilities with shared operating models. They also support SaaS delivery, which can simplify access to current software features. The telecom performance management software market is therefore moving toward platforms that can support cloud deployment at operator scale.
On-premises deployment remains relevant where security and data residency requirements are strict. O2 Telefónica deployed 5G core capabilities on AWS Outposts in its own data center in March 2026. The deployment showed how an operator can use cloud capabilities while keeping selected functions in its own facilities. European electronic communications requirements and data residency concerns support this approach in regulated environments. Hybrid models are likely to coexist with pure cloud models during the forecast period. Vendors that support several deployment options can address a wider range of operator requirements.
By Application:
Capacity Optimization Leads Growth as Monitoring Anchors the Revenue BaseNetwork monitoring held 29.84% of revenue in 2025, making it the largest application in the Telecom performance management software market. Monitoring has a foundational role across network generations, organization sizes, and regional markets. It provides the instrumentation used by other performance and assurance applications. Fault and event management, quality-of-service management, and service-level management are increasingly being placed on unified observability platforms. This approach combines previously separate operational budgets and data sources. Other applications include configuration analytics and lifecycle performance reporting.
Capacity planning and optimization is projected to grow at a 12.08% CAGR through 2031. The telecom performance management software market needs tools that can allocate resources across 5G slices, edge nodes, and cloud workloads in real time. Static and schedule-based capacity models cannot address these requirements at commercial 5G Standalone scale. Infovista launched VistAI in January 2026, a framework that allows operators to define network outcomes and lets AI agents execute related actions within configured controls. Capacity tools are becoming more important as network resources are distributed across more locations and service types. Their growth is linked to the need for dynamic resource allocation rather than periodic planning.

By Network Domain:
RAN Anchors Spend While Edge and Cloud Infrastructure Emerges as the New FrontierRAN held 33.56% of revenue in 2025. The telecom performance management software market receives a high volume of RAN performance counters from macro sites, small cells, and Open RAN locations. Operators also use RAN AI optimization through O-RAN RIC applications. These needs support sustained spending on RAN performance management. Core, transport, and fixed access domains also remain important for operators with converged networks. 3GPP end-to-end KPI requirements create an instrumentation baseline for tools used in 5G Standalone contracts.
Edge and cloud infrastructure is projected to grow at a 12.34% CAGR through 2031. Distributed computing shifts network functions outside traditional core data centers, creating new visibility requirements. Conventional RAN and core tools do not always provide complete monitoring for these workloads. RADCOM introduced the Analytics Designer Module in June 2026 to let analysts define and deploy KPIs and alarms without vendor involvement. RADCOM stated that the module could reduce change cycles from months to the same day. The telecom performance management software market is responding to the operational need for adaptable monitoring across rapidly changing distributed environments.
By Organization Size:
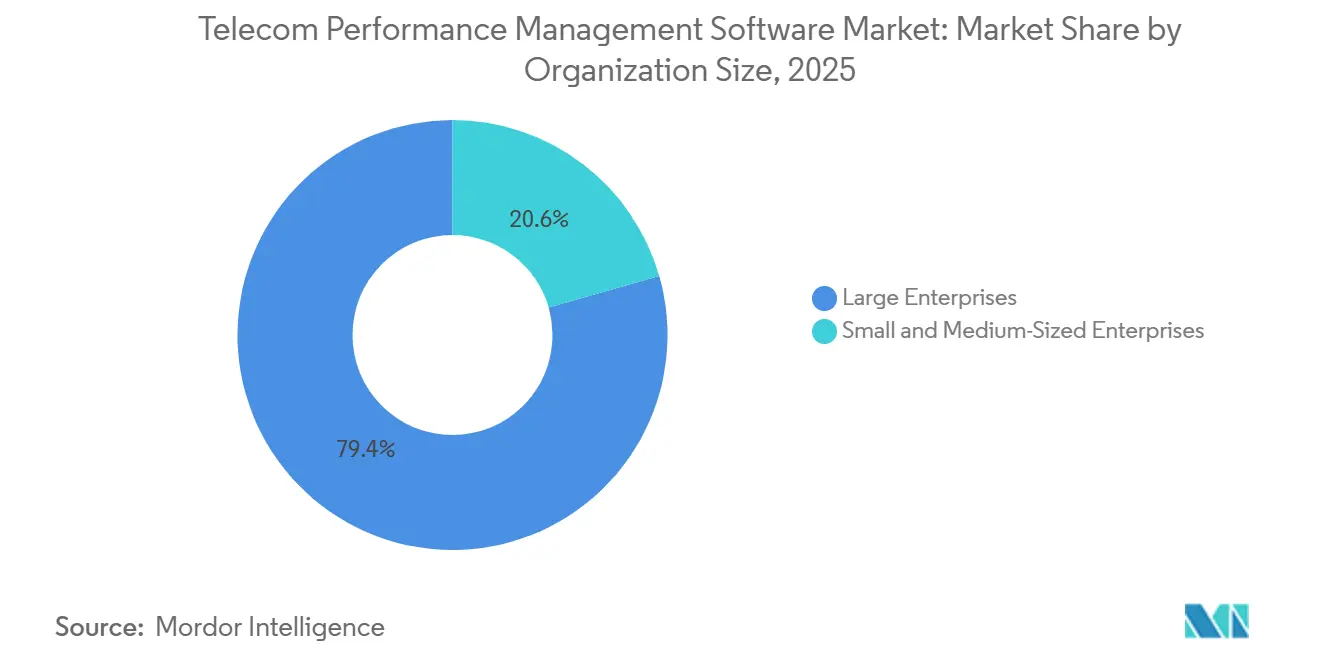
Large Enterprises Define the Revenue Base, SMEs Drive the ExpansionLarge enterprises held 79.42% of revenue in 2025. Tier-1 and Tier-2 operators in the telecom performance management software market generate data volumes that require carrier-scale processing and continuous network operations. Mycom stated that its PrOptima platform can process 100 billion records each hour for some of the largest mobile networks. Large operators also have regulatory reporting responsibilities across licensed spectrum bands. These requirements make performance management a core operating capability. The large-enterprise base continues to anchor spending on broad assurance platforms.
SMEs are projected to grow at an 11.93% CAGR through 2031. SaaS delivery lowers procurement barriers for tools that previously required on-premises carrier-grade infrastructure. ETSI published the F5G-A SME Service and Network Quality Classification standard in 2024, which defines 6 dimensions for assessing SME network quality. Managed service providers and neutral host operators can include performance tools within their service packages. This gives smaller organizations access to assurance capabilities that resemble those used by larger operators. Private 5G deployments in logistics, health care, and retail can further expand demand among mid-market organizations.
By End User:
Telecommunications Operators Anchor the Market, Private Network Operators AccelerateTelecommunications operators held 51.63% of revenue in 2025. Their scale, 24-hour network operations center processes, and regulatory reporting obligations support this position. They manage licensed spectrum networks that require continuous monitoring and assurance. Internet service providers, managed service providers, and neutral hosts and tower companies are also adopting more active shared-network service models. These providers need differentiated service tiers and related performance evidence. Telecommunications operators remain the central customer group for the telecom performance management software market.
Private network operators are projected to grow at a 12.18% CAGR through 2031. Within the telecom performance management software market, their requirements differ from those of public operators because enterprise users need network KPIs linked to business measures such as overall equipment effectiveness, restoration time, and cycle time. Verizon described this need to relate private wireless performance to operational outcomes in 2025. Indosat Ooredoo Hutchison and Huawei reported that their AUTINOps solution achieved an 80% one-hop fault closure rate, reduced mean time to repair by 15%, and improved network availability from 99.3% to 99.7%. These results show the operational value that performance tools can offer in emerging-market operator settings. Private networks widen the addressable base beyond traditional communication service providers.
Geography Analysis
North America Telecom Performance Management Software Market
North America held 35.18% of the Telecom performance management software market share in 2025. The region's position reflects 5G Standalone upgrades, advanced adoption of cloud OSS, and enterprise private 5G activity. Federal Communications Commission reporting requirements for 5G coverage and performance support ongoing investment in monitoring among licensed carriers. Ericsson reported in February 2026 that its AI-powered optimization platform handled over 100 million AI inferences a day across 11 million cells. Canada and Mexico add demand through enterprise digital transformation and spectrum monetization programs.
APAC Telecom Performance Management Software Market
Asia-Pacific is projected to grow at an 12.42% CAGR through 2031. China and India support this expansion through large 5G deployments, while Japan and South Korea advance cloud-native and Open RAN programs. NTT DOCOMO and NEC launched Japan's first commercial 5G core on AWS in February 2026. The deployment used AI-automated network construction and dynamic capacity scaling in a production environment. NTT East Japan's 26-company local 5G project also examined RAN power optimization and interference mitigation. India's phased nationwide rollout is increasing demand for platforms that can manage new 5G Standalone networks at national scale.
EMEA and South America Telecom Performance Management Software Market
Europe remains technically advanced and investment active in the Telecom performance management software market. Germany, the United Kingdom, France, and the Nordic region are deploying cloud-native OSS, automated assurance, and AI-driven network operations programs. Netcracker and Swisscom received the 2026 FutureNet Award for a SaaS autonomous network platform that reduced deployment time by more than 60% and development costs by 40%. O2 Telefónica's March 2026 deployment addressed data residency concerns through a core deployment in its own data center. South America, the Middle East, and Africa have later but accelerating 5G rollout schedules. Brazil, Saudi Arabia, the United Arab Emirates, and South Africa are expanding cloud performance-management procurement as part of wider digital transformation programs.
Competitive Landscape
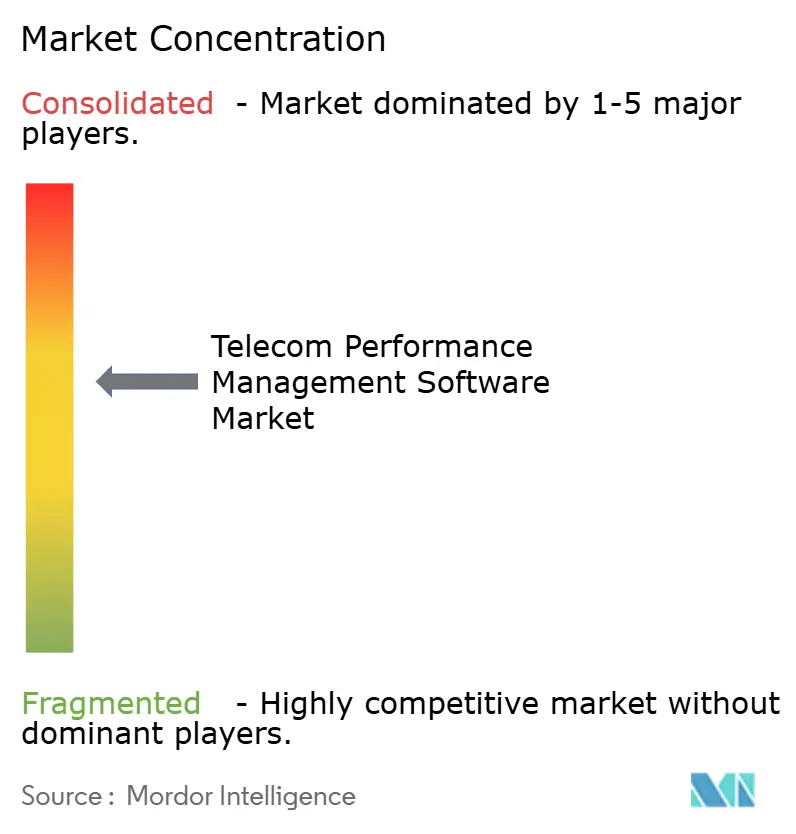
The telecom performance management software market is moderately consolidated among large enterprise operators. Ericsson, Nokia, and Huawei hold significant positions through platforms that combine RAN hardware, core software, and performance management. These relationships enable infrastructure vendors to incorporate assurance functions into broader network modernization programs. Nokia and Google Cloud announced in June 2026 that 6 Gemini-powered AI agents would be embedded in Nokia's Assurance Center. The companies stated that the agents would cover event triage, KPI analysis, anomaly reasoning, and remediation recommendations. The platform is planned for availability on the Google Cloud Marketplace in September 2026 and targets a 50-80% reduction in time spent on network problem-solving.
Specialist suppliers, including RADCOM, Infovista, NETSCOUT, and VIAVI, compete on open, vendor-neutral architectures. RADCOM's Neura AI Agent Suite supports integration with agentic AI environments through open MCP and A2A standards. Ericsson and Nokia's March 2026 marketplace cooperation provided another example of vendors supporting multivendor automation across open platforms. Amdocs introduced CES26 at MWC Barcelona in March 2026 as an agent-driven BSS, OSS, and network suite with closed-loop assurance and unified orchestration. This approach extends assurance into a broader operational stack and raises competition for standalone providers.
Demand remains open for unified observability that serves both private network operators and traditional telecom operators. There is also demand for tools that link service-level management across network domains with enterprise business outcomes in real time. Infovista stated that its VistAI framework draws on 30 years of performance data from more than 1,000 deployments. This type of training-data depth can support differentiation where suppliers are evaluated on operational decision quality. Vendors without a credible AI automation proposition may be disadvantaged as operators treat performance software as an AI inference platform as well as a data-collection platform. The telecom performance management software industry continues to include both integrated infrastructure suppliers and specialists with focused assurance capabilities.
Telecom Performance Management Software Industry Leaders
-
Telefonaktiebolaget LM Ericsson
-
Nokia Corporation
-
Huawei Technologies Co., Ltd.
-
International Business Machines Corporation
-
Oracle Corporation
- *Disclaimer: Major Players sorted in no particular order
Telecom Performance Management Software Market Companies Covered in this Report
- Telefonaktiebolaget LM Ericsson
- Nokia Corporation
- Huawei Technologies Co., Ltd.
- International Business Machines Corporation
- Oracle Corporation
- Amdocs Limited
- Cisco Systems, Inc.
- Hewlett Packard Enterprise Company
- Juniper Networks, Inc.
- Broadcom Inc.
- NETSCOUT SYSTEMS, INC.
- VIAVI Solutions Inc.
- EXFO Inc.
- Infovista SAS
- Comarch S.A.
- RADCOM Ltd.
- Spirent Communications plc
- Paessler AG
- Progress Software Corporation
- TEOCO Corporation
Recent Industry Developments in Telecom Performance Management Software Market
- June 2026: Nokia and Google Cloud announced an expanded partnership to embed 6 Gemini-powered AI agents into Nokia's Assurance Center, covering event triage, KPI analysis, anomaly reasoning, and remediation recommendation. The platform will be available on Google Cloud Marketplace in September 2026 as a SaaS model, targeting a 50-80% reduction in network problem-solving times.
- June 2026: RADCOM launched the Analytics Designer Module for the RADCOM ACE platform, enabling network data analysts to define and deploy KPIs and alarms in real time without vendor engagement, reducing change cycles from months to the same day. General availability is planned for Q3 2026.
- June 2026: Amdocs completed a live multivendor AI-RAN field-validated blueprint with 1Finity, Fujitsu, and Supermicro. The blueprint demonstrated cloud-native 5G Standalone performance across an Open vRAN architecture on NVIDIA GH200 Grace Hopper Superchips and advanced aOS workflow capabilities for multivendor RAN orchestration.
- May 2026: Vodafone Ireland went live with Amdocs Network Inventory, replacing its legacy OSS system to automate mobile network planning, deployment, and assurance as part of a broader digital transformation initiative.
Global Telecom Performance Management Software Market Report Scope
The Telecom Performance Management Software Report is Segmented by Component (Software and Services), Deployment Mode (Cloud-Based and On-Premises), Application (Network Monitoring, Fault and Event Management, Quality-of-Service Management, Service-Level Management, Capacity Planning and Optimization, and Other Applications), Network Domain (Radio Access Network, Core Network, Transport Network, Fixed Access Network, Edge and Cloud Infrastructure, and Enterprise and Private Network), Organization Size (Large Enterprises and Small and Medium-Sized Enterprises), End User (Telecom Operators, ISPs, MSPs, Neutral Hosts and Tower Companies, and Private Network Operators), and Geography. The Market Forecasts are Provided in Terms of Value (USD).
Segmentation Overview
| Software |
| Services |
| Cloud-Based |
| On-Premises |
| Network Monitoring |
| Fault and Event Management |
| Quality-of-Service Management |
| Service-Level Management |
| Capacity Planning and Optimization |
| Other Applications |
| Radio Access Network |
| Core Network |
| Transport Network |
| Fixed Access Network |
| Edge and Cloud Infrastructure |
| Enterprise and Private Network |
| Large Enterprises |
| Small and Medium-Sized Enterprises |
| Telecommunications Operators |
| Internet Service Providers |
| Managed Service Providers |
| Neutral Hosts and Tower Companies |
| Private Network Operators |
| North America | United States |
| Canada | |
| Mexico | |
| South America | Brazil |
| Argentina | |
| Rest of South America | |
| Europe | Germany |
| United Kingdom | |
| France | |
| Italy | |
| Spain | |
| Russia | |
| Rest of Europe | |
| Asia-Pacific | China |
| Japan | |
| India | |
| South Korea | |
| Australia | |
| Rest of Asia-Pacific | |
| Middle East | Saudi Arabia |
| United Arab Emirates | |
| Turkey | |
| Rest of Middle East | |
| Africa | South Africa |
| Egypt | |
| Rest of Africa |
| By Component | Software | |
| Services | ||
| By Deployment Mode | Cloud-Based | |
| On-Premises | ||
| By Application | Network Monitoring | |
| Fault and Event Management | ||
| Quality-of-Service Management | ||
| Service-Level Management | ||
| Capacity Planning and Optimization | ||
| Other Applications | ||
| By Network Domain | Radio Access Network | |
| Core Network | ||
| Transport Network | ||
| Fixed Access Network | ||
| Edge and Cloud Infrastructure | ||
| Enterprise and Private Network | ||
| By Organization Size | Large Enterprises | |
| Small and Medium-Sized Enterprises | ||
| End User | Telecommunications Operators | |
| Internet Service Providers | ||
| Managed Service Providers | ||
| Neutral Hosts and Tower Companies | ||
| Private Network Operators | ||
| By Geography | North America | United States |
| Canada | ||
| Mexico | ||
| South America | Brazil | |
| Argentina | ||
| Rest of South America | ||
| Europe | Germany | |
| United Kingdom | ||
| France | ||
| Italy | ||
| Spain | ||
| Russia | ||
| Rest of Europe | ||
| Asia-Pacific | China | |
| Japan | ||
| India | ||
| South Korea | ||
| Australia | ||
| Rest of Asia-Pacific | ||
| Middle East | Saudi Arabia | |
| United Arab Emirates | ||
| Turkey | ||
| Rest of Middle East | ||
| Africa | South Africa | |
| Egypt | ||
| Rest of Africa | ||
Key Questions Answered in the Report
What is the size of the Telecom performance management software market?
The Telecom performance management software market was USD 4.92 billion in 2025 and is forecast to reach USD 8.96 billion by 2031 at a 10.78% CAGR.
What is driving demand for telecom performance management software?
5G Standalone deployments, network slicing, cloud-native OSS adoption, and AI-driven automation are increasing demand for reliable network telemetry and assurance.
Which deployment model leads telecom performance management software adoption?
Cloud-based deployment held 63.78% of revenue in 2025 and is projected to grow at an 11.82% CAGR through 2031.
Which application has the strongest growth outlook?
Capacity planning and optimization is projected to grow at a 12.08% CAGR through 2031 as operators allocate resources across slices, edge nodes, and cloud workloads.
Which region grows fastest through 2031?
Asia-Pacific is projected to grow at a 12.42% CAGR through 2031, supported by 5G deployments in China and India and cloud-native initiatives in Japan and South Korea.
Who are the key providers of telecom performance management software?
Ericsson, Nokia, Huawei, RADCOM, Infovista, NETSCOUT, VIAVI, Amdocs, and Mycom are among the providers cited in the analysis.