
Tapioca Syrup Market Size and Share
Market Overview
| Study Period | 2022 - 2032 |
|---|---|
| Market Size (2027) | USD 360.26 Million |
| Market Size (2032) | USD 484.85 Million |
| Growth Rate (2027 - 2032) | 6.12 % |
| Fastest Growing Market | Asia-Pacific |
| Largest Market | North America |
| Market Concentration | Low |
Major Players *Disclaimer: Major Players sorted in no particular order Image © Mordor Intelligence. Reuse requires attribution under CC BY 4.0. | |
Tapioca Syrup Market Analysis by Mordor Intelligence
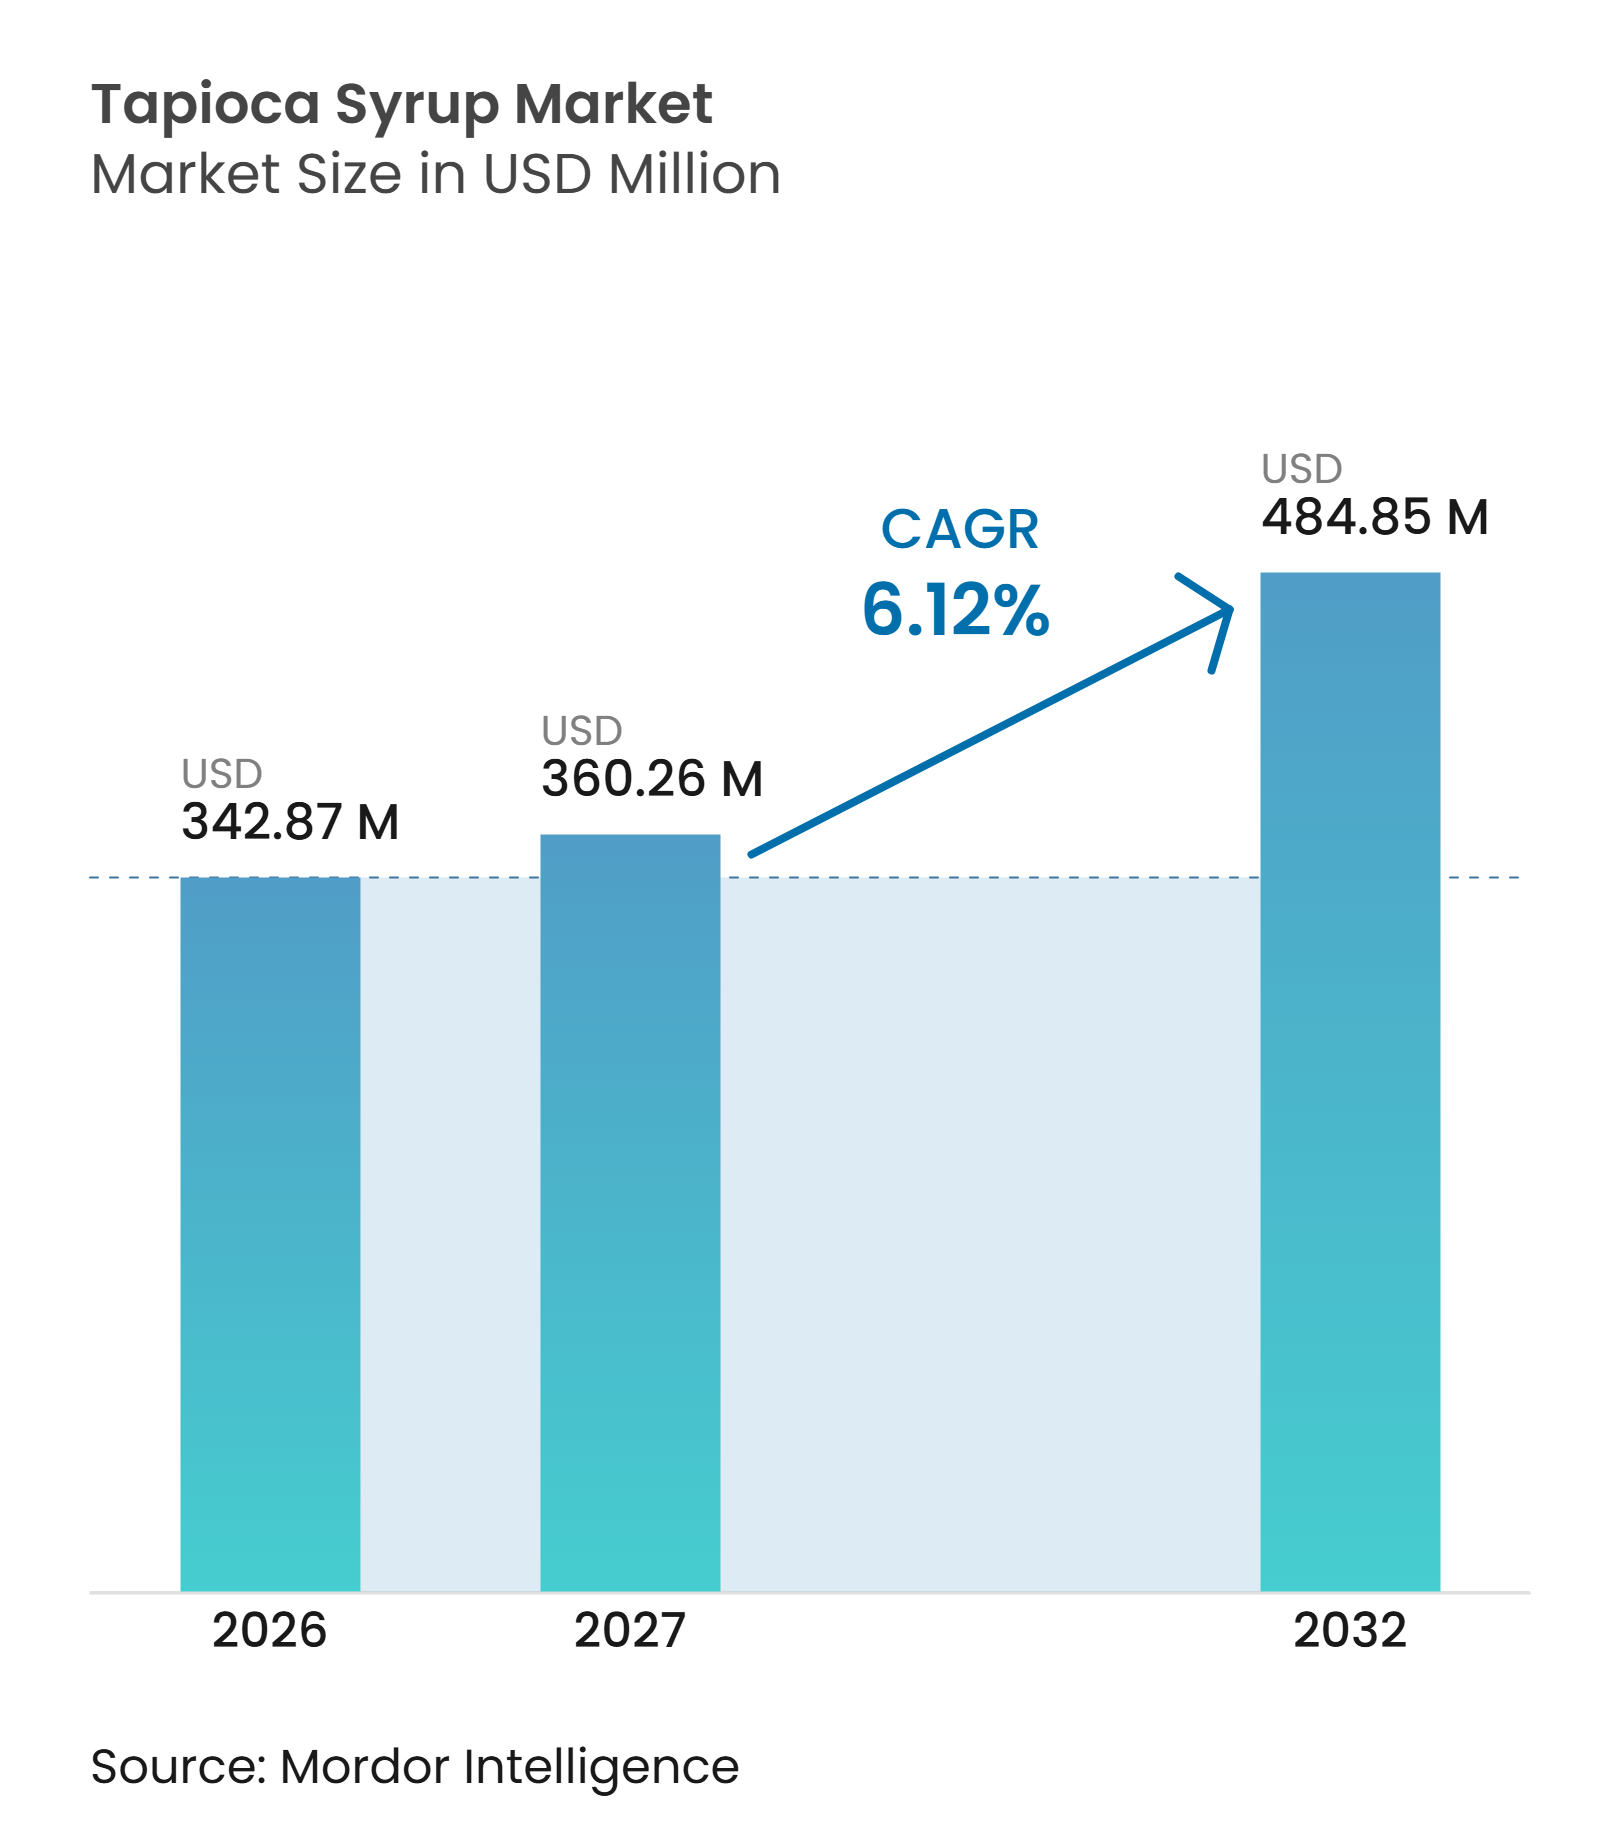
The tapioca syrup market size was valued at USD 342.87 million in 2026 and is estimated to grow from USD 360.26 million in 2027 to reach USD 484.85 million by 2032, at a CAGR of 6.12% during the forecast period (2027-2032). The Tapioca Syrup Market is driven by food manufacturers seeking plant-based, Non-Genetically Modified Organism (GMO), and allergen-free alternatives to corn-derived sweeteners, particularly for finished products that require simple, recognizable ingredient lists. Tapioca syrup delivers sweetness, binding, moisture retention, and browning properties, enabling formulators to use a single ingredient across multiple product formats while tailoring textures to specific requirements. The opportunity is strongest among brands simplifying ingredient lists without compromising texture or shelf life, as products must continue to meet consumer expectations for taste and consistency. However, supply conditions remain a key constraint, as cassava sourcing is concentrated in Southeast Asia and recent weather disruptions have increased procurement risks for starch processors and their customers.
Key Report Takeaways
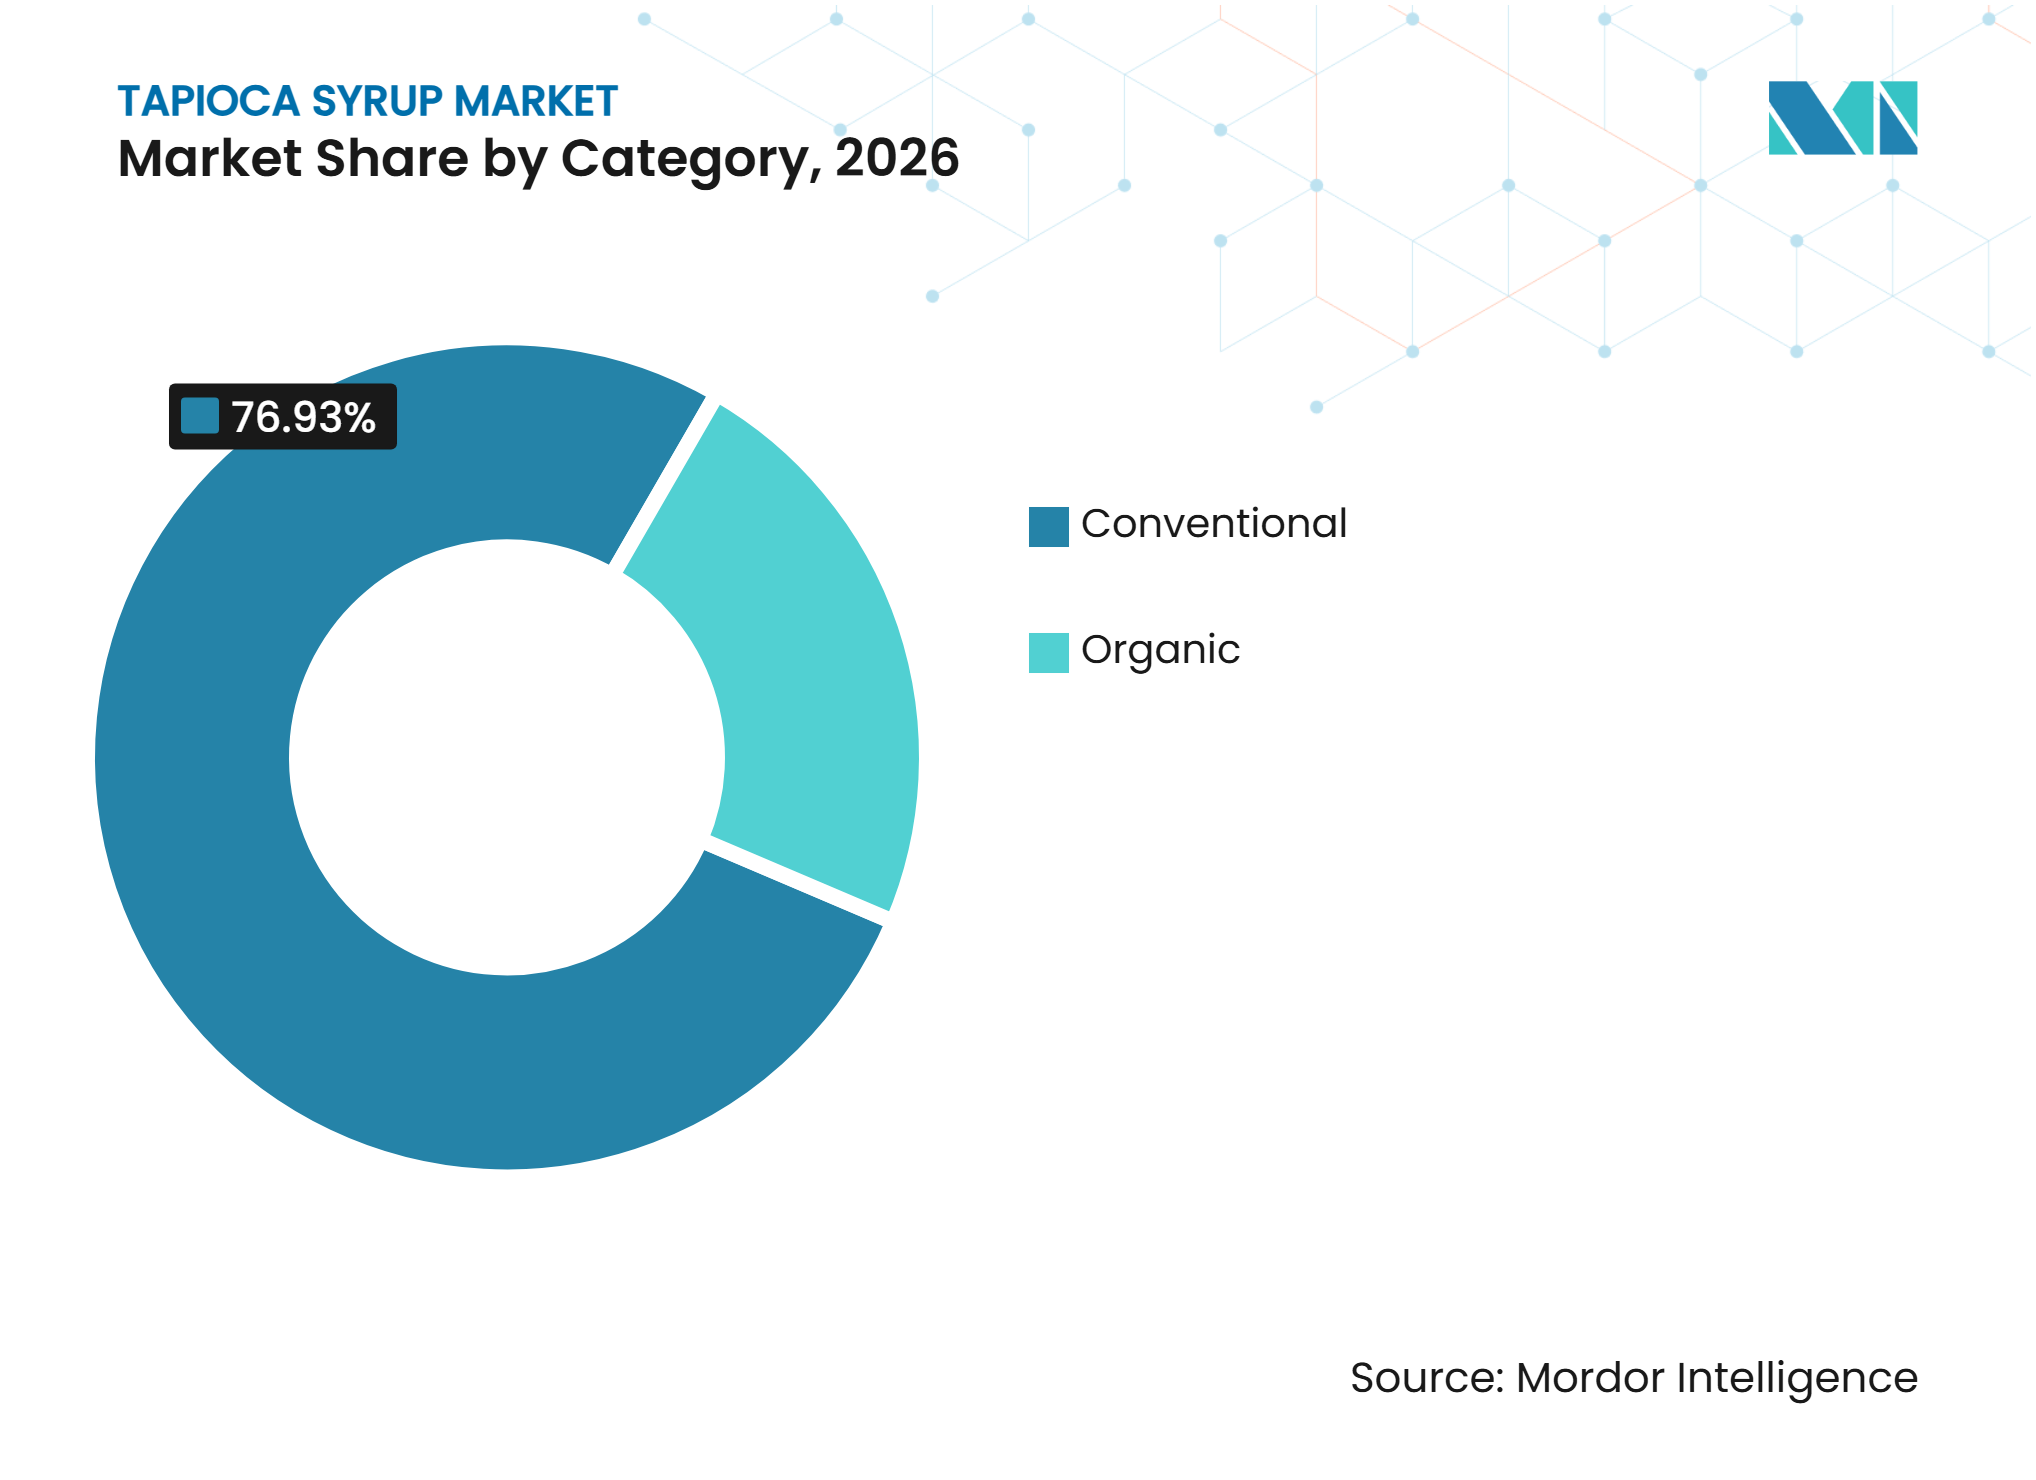
- By category, conventional dominated the tapioca syrup market with a share of 76.93% in 2026, while organic is anticipated to register the fastest CAGR of 8.40% during 2027-2032.
- By DE (Dextrose Equivalent) level, medium DE (40-60) dominated the market with a share of 55.31% in 2026, while high DE (above 60) is anticipated to register the fastest CAGR of 7.18% during 2027-2032.
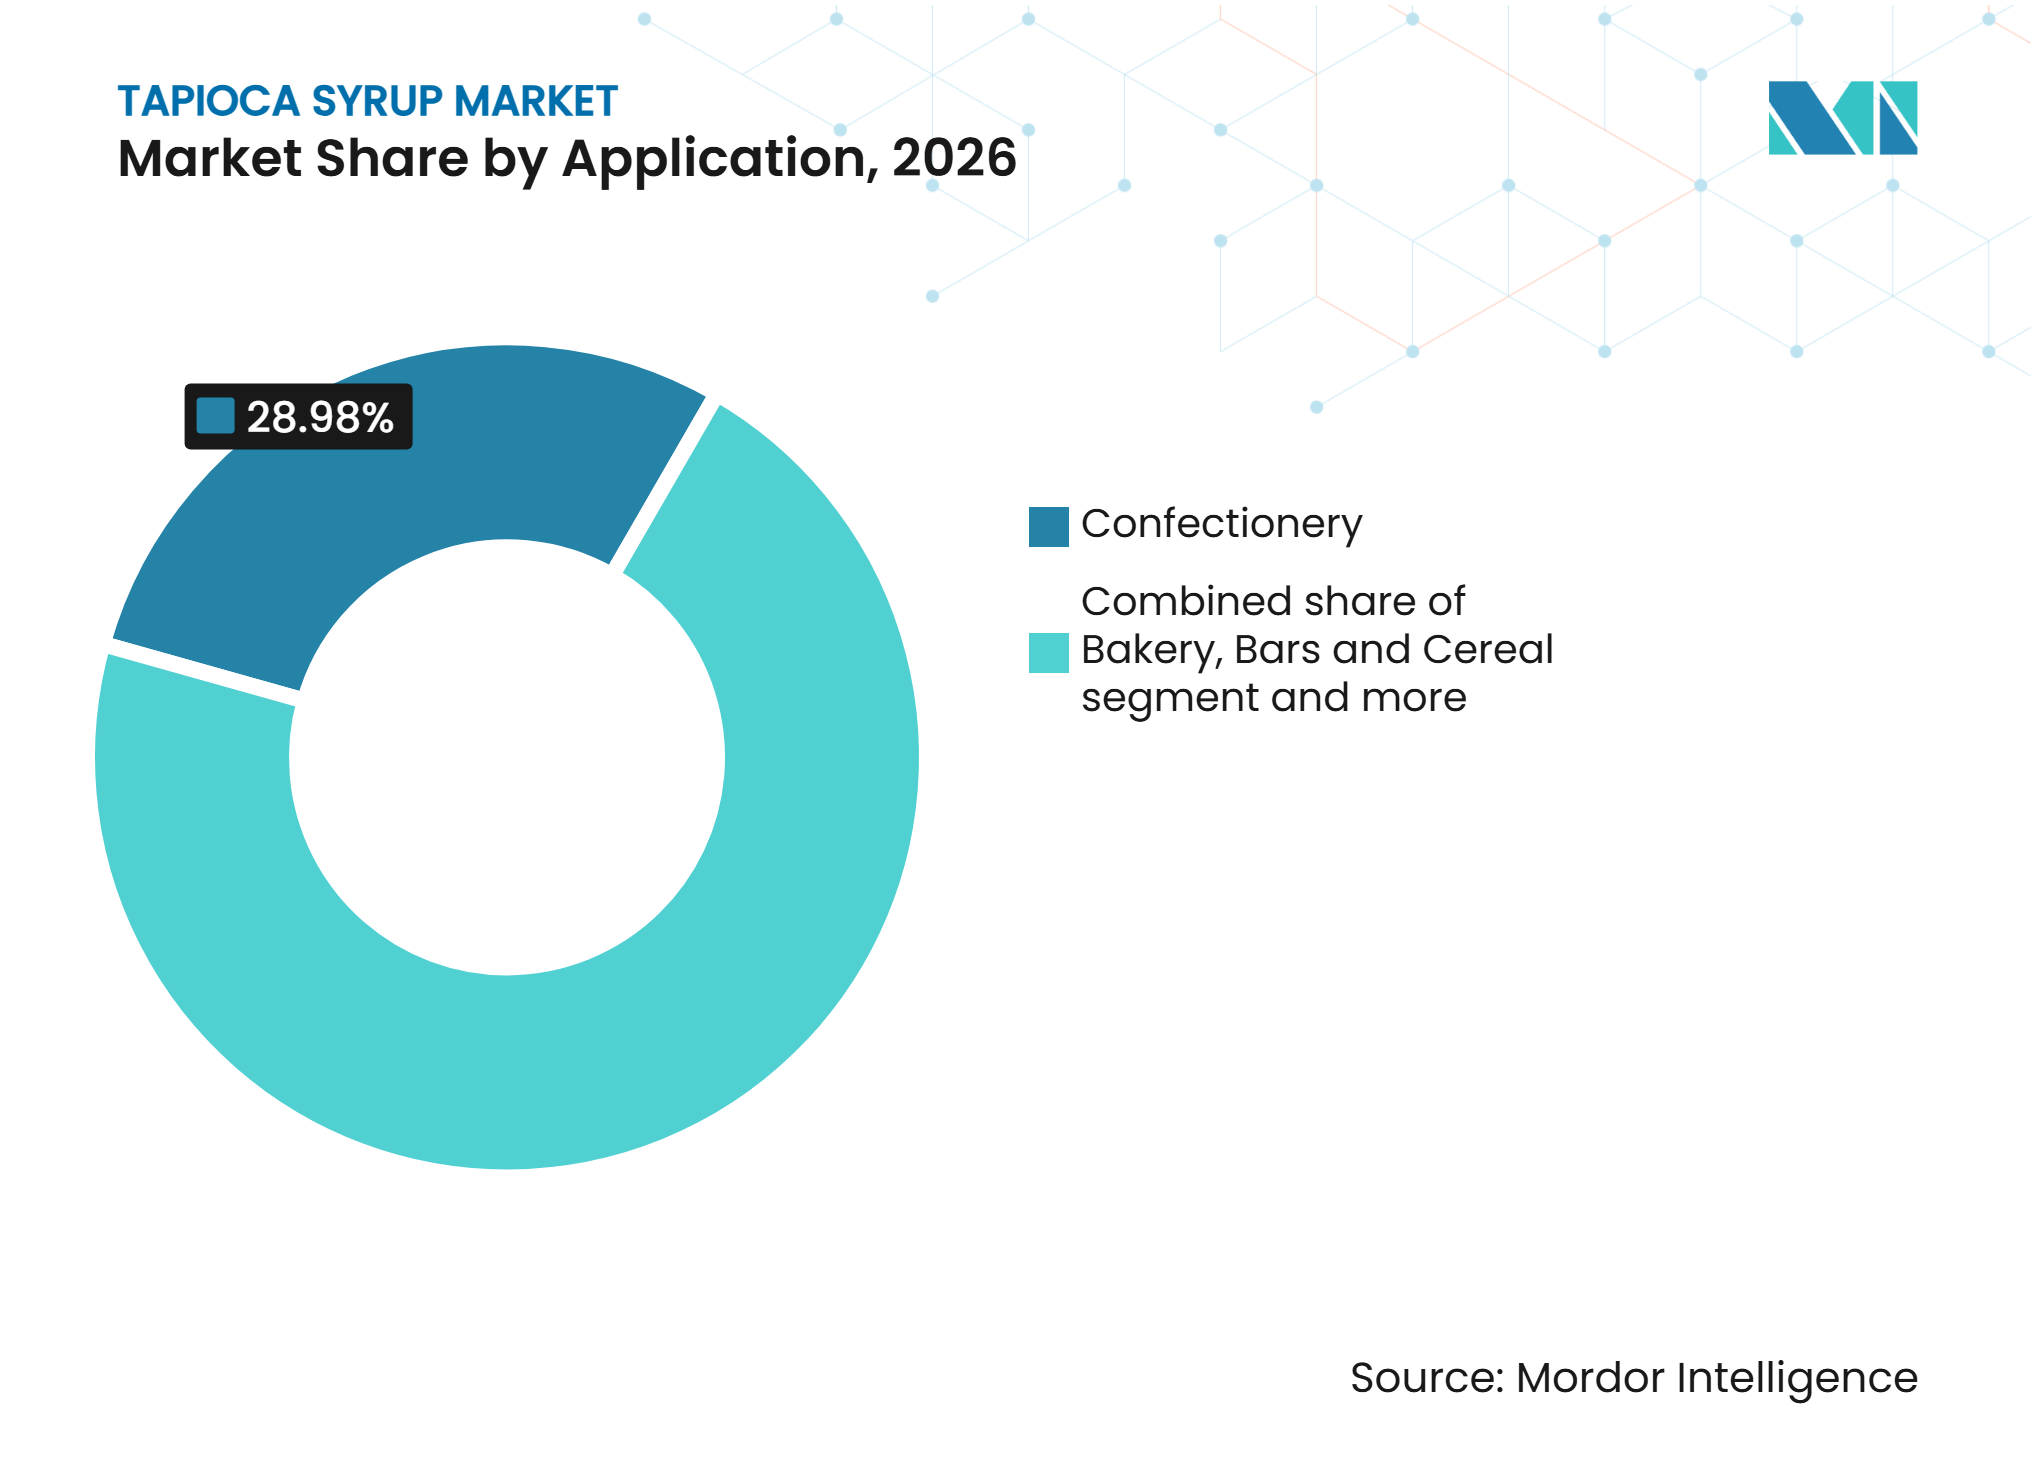
- By application, confectionery dominated the market with a share of 28.98% in 2026, while bars and cereal applications are anticipated to register the fastest CAGR of 7.48% during 2027-2032.
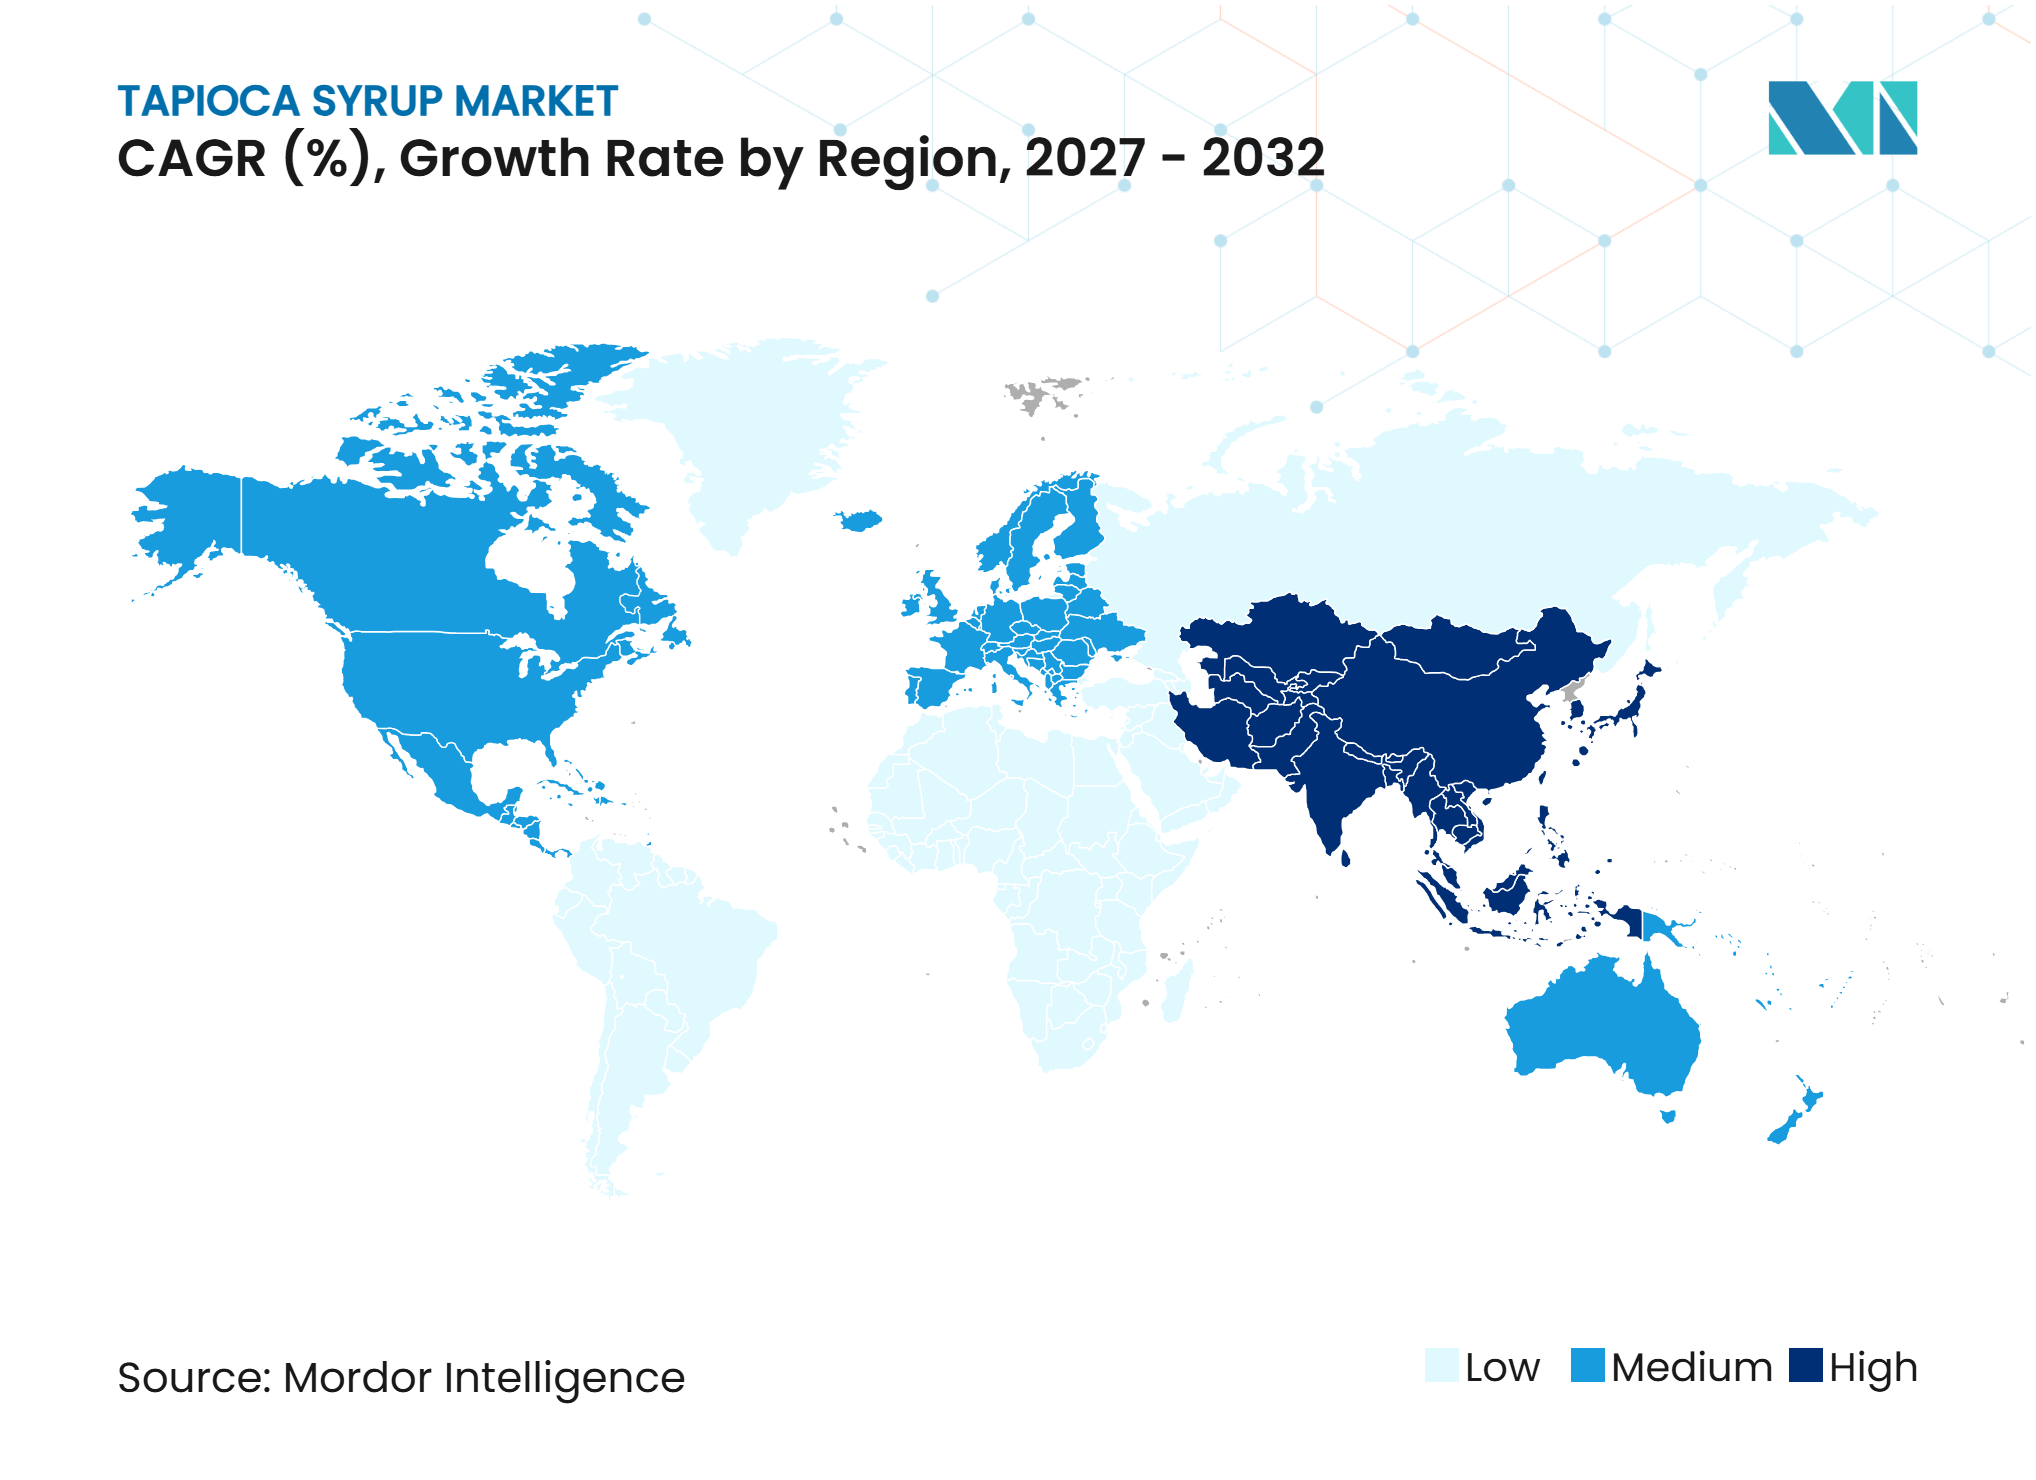
- By geography, North America dominated the tapioca syrup market with a share of 35.42% in 2026, while Asia-Pacific is anticipated to register the fastest CAGR of 7.93% during 2027-2032.
Note: Market numbers in this report are based on Mordor Intelligence's proprietary estimation framework, which combines nine months of actuals with Q4 projections for base year 2026.
Market Trends and Insights
Drivers Impact Analysis of Tapioca Syrup Market*
| Driver | (~) % Impact on CAGR Forecast | Geographic Relevance | Impact Timeline |
|---|---|---|---|
| Demand for Clean-Label and Naturally Derived Sweeteners | +2.0% | Global, with greater intensity in North America, Western Europe, and urban Asia-Pacific | Medium term (2-4 years) |
| Expansion of gluten-free food and bakery products | +1.2% | North America and Europe, with spillover to Asia-Pacific and Middle East and Africa | Medium term (2-4 years) |
| Increasing adoption of plant-based and vegan food products | +0.8% | North America, Europe, and Asia-Pacific urban centers | Long term (≥ 4 years) |
| Rising demand for confectionery, gummies and snack bars | +0.7% | Global, with strong concentration in North America and China | Short term (≤ 2 years) |
| Increasing utilisation of multifunctional ingredients in food processing | +0.5% | Global, led by North America, Europe, and Asia-Pacific | Long term (≥ 4 years) |
| Consumption of functional beverages and dairy alternatives | +0.4% | Asia-Pacific, North America, and Europe | Long term (≥ 4 years) |
| Source: Mordor Intelligence | |||
Demand for Clean-Label and Naturally Derived Sweeteners
The Tapioca Syrup Market benefits from sustained consumer attention to ingredient lists in packaged foods. Manufacturers produce tapioca syrup through the enzymatic hydrolysis of cassava starch, enabling plant-based, non-GMO, and clean-label positioning while maintaining a product’s intended ingredient profile. Its neutral flavor allows manufacturers to replace corn-derived sweeteners without significantly altering the intended taste profile or flavor balance of finished food products. Tapioca syrup also provides binding, moisture-control, and browning properties, which can reduce the number of ingredients required in a formulation and simplify product development. Organic certification offers an additional premium-positioning opportunity for suppliers that can demonstrate traceability from cassava sourcing through processing and delivery.
Expansion of Gluten-Free Food and Bakery Products
The growing demand for gluten-free food and bakery products supports tapioca syrup consumption, as manufacturers increasingly use gluten-free-compatible ingredients in bread, cakes, cookies, biscuits, and other baked goods. Derived from cassava starch, tapioca syrup provides sweetness, moisture retention, and binding properties, making it suitable for formulations that use alternative flours in place of conventional wheat flour. In January 2026, the United States Food and Drug Administration (FDA), under the Department of Health and Human Services, highlighted that approximately 3 million people in the United States have celiac disease and initiated a request for information to improve gluten ingredient disclosure and prevent cross-contact in packaged foods[1]. The ongoing regulatory focus on gluten safety reinforces the need for compliant gluten-free food formulations, creating opportunities for tapioca syrup suppliers serving specialty bakery and processed food manufacturers.
Increasing Adoption of Plant-Based and Vegan Food Products
The growing adoption of plant-based and vegan food products is creating opportunities for tapioca syrup manufacturers, as food processors seek plant-derived ingredients to develop dairy alternatives, vegan confectionery, snack bars, and beverages. Derived from cassava roots, tapioca syrup offers sweetness, binding, and moisture-retention properties that support plant-based formulations. According to the Good Food Institute's June 2026 report, plant-based food sales in the United States increased in 2025, with 60% of households purchasing plant-based food products during the year[2]. This growth creates opportunities for tapioca syrup suppliers to serve manufacturers of plant-based bars, bakery products, and other specialty food applications.
Rising Demand for Confectionery, Gummies, and Snack Bars
Gummies, candies, and nutrition bars use tapioca syrup for binding, anti-crystallization, and moisture management. In gelatin- and pectin-based gummies, tapioca syrup supports chewiness, reduces the need for certain synthetic stabilizers, and helps brands maintain consistent product texture. Bars and cereal products also require binding ingredients that support organic and allergen-free claims while withstanding standard processing conditions. Food processors also use tapioca syrup in beverages and dairy alternatives, where body and mouthfeel are important and the syrup’s neutral flavor is advantageous. Therefore, the tapioca syrup market benefits from the ingredient’s ability to address texture, sweetness, labeling requirements, and processing needs across multiple product formats.
Restraints Impact Analysis of Tapioca Syrup Market*
| Restraint | (~) % Impact on CAGR Forecast | Geographic Relevance | Impact Timeline |
|---|---|---|---|
| Cassava root and tapioca starch procurement price volatility | -1.1% | Global, with acute exposure in Asia-Pacific and downstream North American manufacturers | Short term (≤ 2 years) |
| Competition from alternative sweeteners | -0.8% | North America and Europe, with secondary exposure in Asia-Pacific | Long term (≥ 4 years) |
| Limited consumer awareness and market recognition | -0.4% | Emerging markets in South America, Middle East and Africa, and rural Asia-Pacific | Medium term (2-4 years) |
| Health concerns associated with added sugar consumption | -0.3% | Global, particularly North America and Western Europe | Long term (≥ 4 years) |
| Source: Mordor Intelligence | |||
Cassava Root and Tapioca Starch Procurement Price Volatility
Variations in cassava root quality and starch content create procurement challenges for tapioca syrup manufacturers, as raw material suitability directly affects starch extraction efficiency and finished syrup consistency. In November 2025, Thailand's National Economic and Social Development Council (NESDC) reported that cassava farmers in flood-affected areas experienced root deterioration, resulting in smaller harvested roots with lower starch content[3]. These quality inconsistencies can complicate raw material sourcing, reduce processing suitability, and make it difficult for manufacturers to maintain consistent tapioca syrup specifications. Consequently, manufacturers may need to strengthen raw material inspection, diversify sourcing networks, and adopt stricter supplier quality-assurance measures, adding to procurement and operational complexities.
Competition from Alternative Sweeteners
Tapioca syrup faces competition from high-intensity sweeteners, fiber systems, and other sugar-reduction solutions. Stevia-derived ingredients and sweet proteins enable manufacturers to reduce sugar content in beverages and confectionery products while offering lower caloric content than traditional syrups. However, these alternatives do not provide the bulk, binding, and textural functionality that tapioca syrup offers in applications requiring physical structure. Manufacturers increasingly combine high-intensity sweeteners with fiber systems to reduce tapioca syrup usage in selected low-sugar formulations. This substitution trend may reduce tapioca syrup inclusion rates and heighten competitive pressure on suppliers targeting health-conscious food and beverage manufacturers.
*Our forecasts treat driver/restraint impacts as directional, not additive. The impact forecasts reflect baseline growth, mix effects, and variable interactions.
Tapioca Syrup Market Segment Analysis
By Category:
Organic Premiumization Accelerates Amid Conventional ScaleConventional tapioca syrup accounted for 76.93% of tapioca syrup demand in 2026. Mainstream food manufacturers use it across bakery, confectionery, and beverage applications due to familiar specifications and widespread availability. Large-volume buyers also value its functional consistency and cost efficiency. Established cassava-processing networks in Southeast Asia support the segment’s scale, while broad distributor availability makes conventional grades the default choice for many high-volume reformulation programs.
Organic tapioca syrup is projected to grow at a CAGR of 8.40% from 2027 to 2032, outpacing overall market demand. Certification enables manufacturers to support certified-organic claims on finished-product labels. Premium snack bars, plant-based protein foods, and specialty confectionery represent key applications for these grades, where ingredient origin can influence brand positioning. Traceability and organic documentation may enable producers to target higher-value customer accounts and maintain access to customers with formal supplier-assurance requirements. Therefore, the tapioca syrup market is likely to combine broad conventional volume with faster growth in certified specialty grades.


By DE Level:
Functional Differentiation Drives Segment DynamicsMedium DE (40-60 )accounted for 55.31% of tapioca syrup demand in 2026. This range balances sweetness, viscosity, and body across bakery, beverage, and dairy applications. It provides fermentable sugars that support browning and helps retain moisture in finished foods. Its moderate sweetness also gives formulators greater flexibility than higher-DE grades. These characteristics make it suitable for products requiring multiple functions from a single syrup. Medium-DE grades are expected to remain a core choice across diverse food applications.
High DE (Above 60) is forecast to grow at a CAGR of 7.18% through 2032. It is used in confectionery and gummy applications because its performance more closely resembles that of high-fructose corn syrup. This enables manufacturers to maintain sweetness and texture while removing high-fructose corn syrup from ingredient lists without adopting an entirely unfamiliar processing system. Consequently, high-DE grades may benefit from reformulation activity in candy and snack applications, where manufacturers closely manage product consistency. The tapioca syrup market for higher-functionality grades is supported by applications in which technical performance outweighs commodity pricing.
By Application:
Confectionery Anchors Volume While Bars and Cereal Set the PaceConfectionery accounted for 28.98% of the tapioca syrup market size in 2026. Manufacturers use tapioca syrup in gummies and baked confections to control crystallization, improve binding, and retain moisture. These properties are particularly important in gelatin- and pectin-based products, where chewiness and product stability must be maintained during production, distribution, and normal shelf life. In Europe, its gluten-free origin can help manufacturers reduce allergen management complexity when replacing wheat-derived syrups. This application base gives confectionery a durable role in demand and links the tapioca syrup market to established, high-volume food formats.
The bars and cereal segment is projected to grow at a CAGR of 7.48% from 2027 to 2032. The segment benefits from demand for clean-label nutrition bars, granola clusters, and protein snacks that require effective binding across diverse ingredient combinations. Organic and allergen-free positioning further supports the use of cassava-derived ingredients in this category, particularly among brands seeking simple label language. Bakery remains a substantial application, as tapioca syrup can enhance moisture retention, browning, and shelf life in gluten-free and specialty products. Beverages, dairy alternatives, sauces, dressings, and processed meals also generate steady demand across a broad range of food processing applications. Therefore, the tapioca syrup market benefits from both high confectionery volumes and the faster adoption of snack-oriented formats.


Geography Analysis
North America
North America accounted for 35.42% of the tapioca syrup market share in 2026. In the United States, food companies increasingly treat clean-label reformulation as a standard product development activity rather than a niche initiative. Consumer preference for plant-based, and allergen-free ingredients supports demand, particularly for packaged products with clearly communicated claims. Canada contributes through premium packaged food products that emphasize ingredient transparency. Mexico presents a developing opportunity as processed food consumption increases and manufacturers expand their ingredient options. Food safety systems and verified supplier documentation remain key purchasing requirements for food companies operating across multiple product categories.
Asia-Pacific
Asia-Pacific is projected to expand at a CAGR of 7.93% during 2027-2032. The region serves as a major cassava processing hub and an increasingly important market for packaged and functional foods. In China, demand is growing for confectionery, snack foods, and specialized food ingredients that use cassava-based ingredients to provide sweetness and texture. India, Indonesia, and the Philippines offer additional opportunities as local food processing capabilities expand and premium product formats gain visibility. The China–Laos Railway corridor has also altered regional supply options by improving direct access between Laos and China. This development may reshape established trade patterns among Thailand, Vietnam, Laos, and China. Manufacturers operating in the region must manage evolving sourcing economics while meeting food safety and traceability requirements.
Europe, South America, and Middle East and Africa
Europe remains an important demand center for natural, traceable, and sustainably sourced food ingredients. Germany, the United Kingdom, France, and Italy drive demand through their large packaged food markets and continued interest in product reformulation. Nutri-Score adoption in parts of Europe also encourages manufacturers to explore lower-sugar formulations. Suppliers can benefit from the regional demand base by combining functional performance with clear documentation. In South America, Brazil, Argentina, and Peru lead the market, where rising urban consumption supports the development of premium packaged food products. The United Arab Emirates, Saudi Arabia, and South Africa serve as relevant entry points for suppliers capable of meeting international manufacturing standards. These regions represent a long-term source of demand rather than a replacement for the scale of North America or Asia-Pacific.
Competitive Landscape
Market Concentration
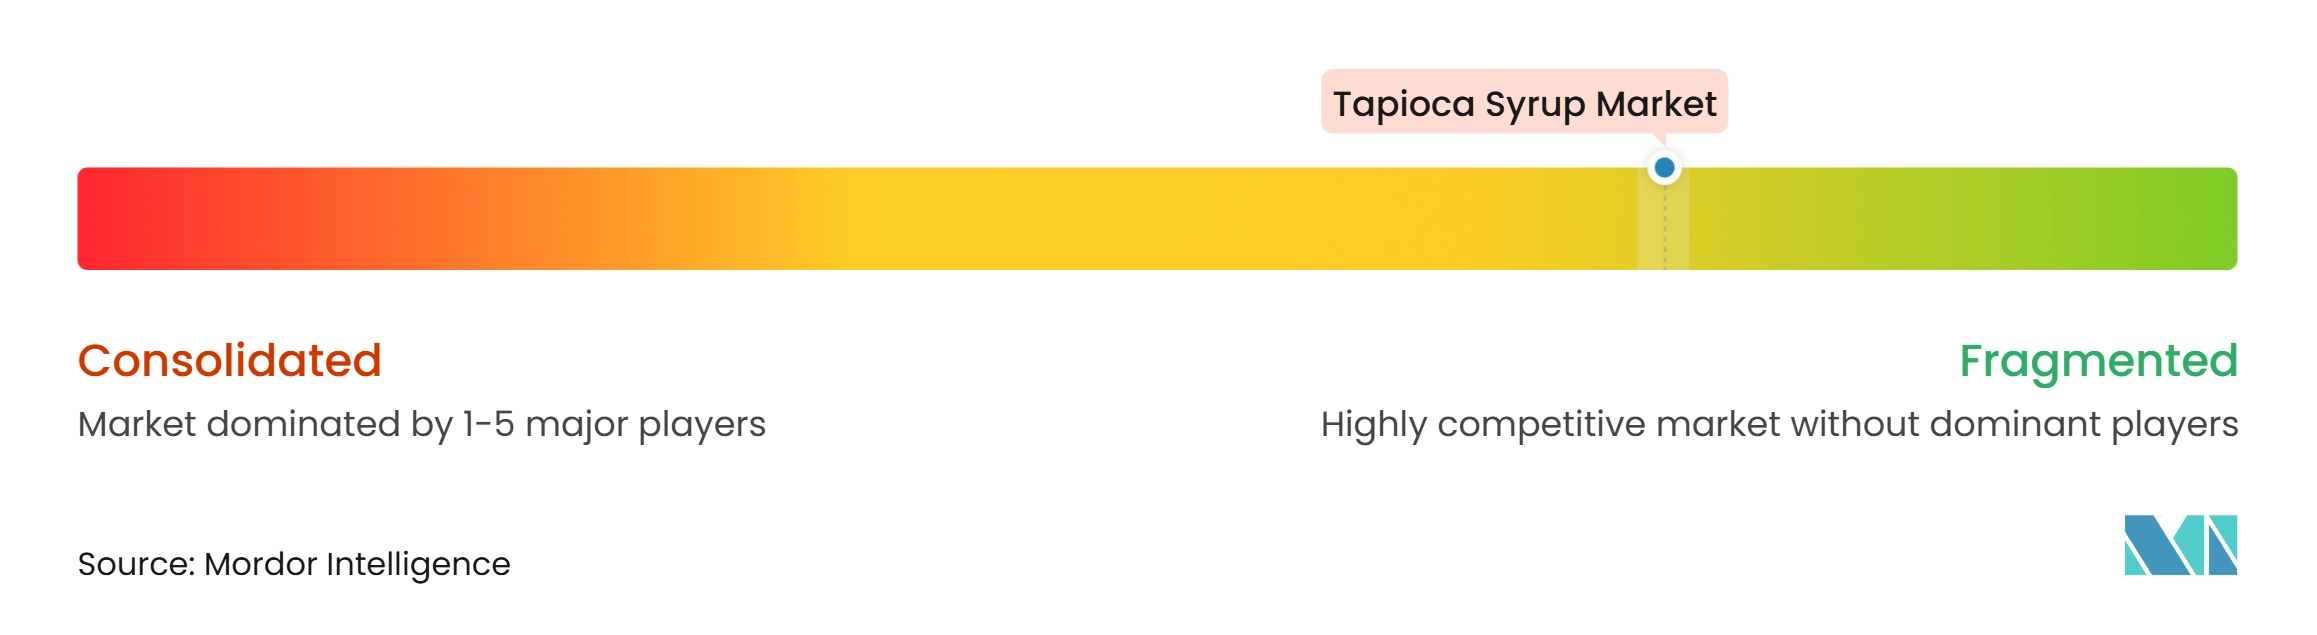
The tapioca syrup market is fragmented and has competition among multinational ingredient manufacturers, specialized sweetener suppliers, and regional tapioca processors. Companies compete based on product quality, the availability of organic and conventional ingredients, DE-grade variations, application suitability, sourcing capabilities, and supply chain reliability. Key participants in the tapioca syrup industry landscape include Cargill, Ingredion, Malt Products Corporation, Briess Industries, and Ciranda. Their market positions vary according to product specialization, ingredient portfolios, manufacturing capabilities, and relationships with food and beverage manufacturers.
Leading companies strengthen their market positions through production investments, product diversification, and specialized tapioca syrup formulations. Malt Products Corporation offers its TapRite™ portfolio in DE grades ranging from 27 to 63, including organic and non-GMO options. Briess Industries provides BriesSweet™ tapioca syrups in 28 DE, 42 DE, and 63 DE formulations. These initiatives enable manufacturers to differentiate their offerings through product functionality, certification options, and application-specific ingredient solutions.
Smaller and specialized suppliers compete through organic certification, customized DE grades, and application-specific ingredient solutions. Ciranda offers organic TapiOK® tapioca syrup products for confectionery, cereal bars, bakery products, beverages, and nutritional bars. Malt Products Corporation further differentiates itself through its integrated production facility and sourcing relationships with cassava farmers in Thailand and Laos. These strategies enable specialized suppliers to serve manufacturers seeking formulation flexibility, ingredient traceability, and differentiated sweetening solutions. Consequently, competitive positioning in the market increasingly depends on product specialization, certification capabilities, sourcing reliability, and the ability to meet specific food processing requirements.
Tapioca Syrup Industry Leaders
-
Cargill, Incorporated
-
Ingredion Incorporated
-
Malt Products Corporation
-
Archer Daniels Midland Company
-
Roquette Frères
- *Disclaimer: Major Players sorted in no particular order
Tapioca Syrup Market Companies Covered in this Report
- Cargill, Incorporated
- Ingredion Incorporated
- Malt Products Corporation
- Ciranda, Inc.
- Thai Wah Public Company Limited
- Archer Daniels Midland Company
- Tate & Lyle PLC
- Roquette Frères
- AGRANA Beteiligungs-AG
- Briess Malt and Ingredients Co.
- Sunrise International
- Marigold
- KB Ingredients
- Pure Life
- GluCorp
- Shafi Gluco Chem
- Sweet Additions
- Vedan Enterprise Corporation
- WGC Co., Ltd.
- Capital Glucose Co., Ltd.
Recent Industry Developments in Tapioca Syrup Market
- March 2026: Briess Industries published its updated 2026 product list, featuring the BriesSweet™ tapioca syrup range, including 28 DE, 42 DE, and 63 DE formulations. The portfolio also includes organic and conventional options, as well as organic tapioca syrup solids.
- November 2025: Shafi Gluco Chem introduced its TapiLow syrup. The product is a low-sugar, tapioca-based sweetener made from organic tapioca roots. It contains up to 70% less sugar than conventional syrups while maintaining sweetness, texture, and functionality.
- June 2025: The joint venture between AGRANA Stärke GmbH and Ingredion Germany GmbH received clearance from European antitrust authorities. The parties invested EUR 35 million to expand AGRANA’s starch production facility in Țăndărei, Romania. Construction began in June 2025, with production expected to commence within 2.5 years.
Global Tapioca Syrup Market Report Scope
Tapioca syrup is a plant-based liquid sweetener produced by enzymatically converting starch extracted from cassava roots into sugars.
The tapioca syrup market is segmented by category, DE (Dextrose Equivalent) level, and application. By category, the market is segmented into organic and conventional. By DE level, the market is segmented into low DE (below 40), medium DE (40–60), and high DE (above 60). By application, the market is segmented into bakery, confectionery, beverages, dairy and dairy alternatives, bars and cereal, and other food applications. The market forecasts are provided in terms of value (USD).
Segmentation Overview
| Organic |
| Conventional |
| Low DE (Below 40) |
| Medium DE (40–60) |
| High DE (Above 60) |
| Bakery |
| Confectionery |
| Beverages |
| Dairy and Dairy Alternatives |
| Bars and Cereal |
| Other Food Applications |
| North America | United States |
| Canada | |
| Mexico | |
| Rest of North America | |
| Europe | Germany |
| United Kingdom | |
| Italy | |
| France | |
| Spain | |
| Netherlands | |
| Rest of Europe | |
| Asia-Pacific | China |
| India | |
| Japan | |
| Australia | |
| Indonesia | |
| Rest of Asia-Pacific | |
| South America | Brazil |
| Argentina | |
| Peru | |
| Rest of South America | |
| Middle East and Africa | South Africa |
| Saudi Arabia | |
| Rest of Middle East and Africa |
| By Category | Organic | |
| Conventional | ||
| By DE (Dextrose Equivalent) Level | Low DE (Below 40) | |
| Medium DE (40–60) | ||
| High DE (Above 60) | ||
| By Application | Bakery | |
| Confectionery | ||
| Beverages | ||
| Dairy and Dairy Alternatives | ||
| Bars and Cereal | ||
| Other Food Applications | ||
| By Geography | North America | United States |
| Canada | ||
| Mexico | ||
| Rest of North America | ||
| Europe | Germany | |
| United Kingdom | ||
| Italy | ||
| France | ||
| Spain | ||
| Netherlands | ||
| Rest of Europe | ||
| Asia-Pacific | China | |
| India | ||
| Japan | ||
| Australia | ||
| Indonesia | ||
| Rest of Asia-Pacific | ||
| South America | Brazil | |
| Argentina | ||
| Peru | ||
| Rest of South America | ||
| Middle East and Africa | South Africa | |
| Saudi Arabia | ||
| Rest of Middle East and Africa | ||
Key Questions Answered in the Report
What is the current size and future growth outlook of the tapioca syrup market?
The tapioca syrup market was valued at USD 342.87 million in 2026 and is projected to grow from USD 360.26 million in 2027 to USD 484.85 million by 2032, registering a CAGR of 6.12% during 2027-2032.
Which category segment held the largest share of the tapioca syrup market in 2026?
The Conventional segment dominated the market in 2026, accounting for 76.93% of total revenue.
Which DE (Dextrose Equivalent) level segment accounted for the largest market share in 2026?
The Medium DE (40-60) segment held the largest market share in 2026, accounting for 55.31% of market.
Which application segment led the tapioca syrup market in 2026?
The Confectionery application segment held the leading position in 2026, capturing 28.98% of the market.
Which region dominated tapioca syrup market in 2026?
North America was the largest regional market in 2026, accounting for 35.42% of market share.