
Tank Trucking Market Size and Share
Market Overview
| Study Period | 2021 - 2032 |
|---|---|
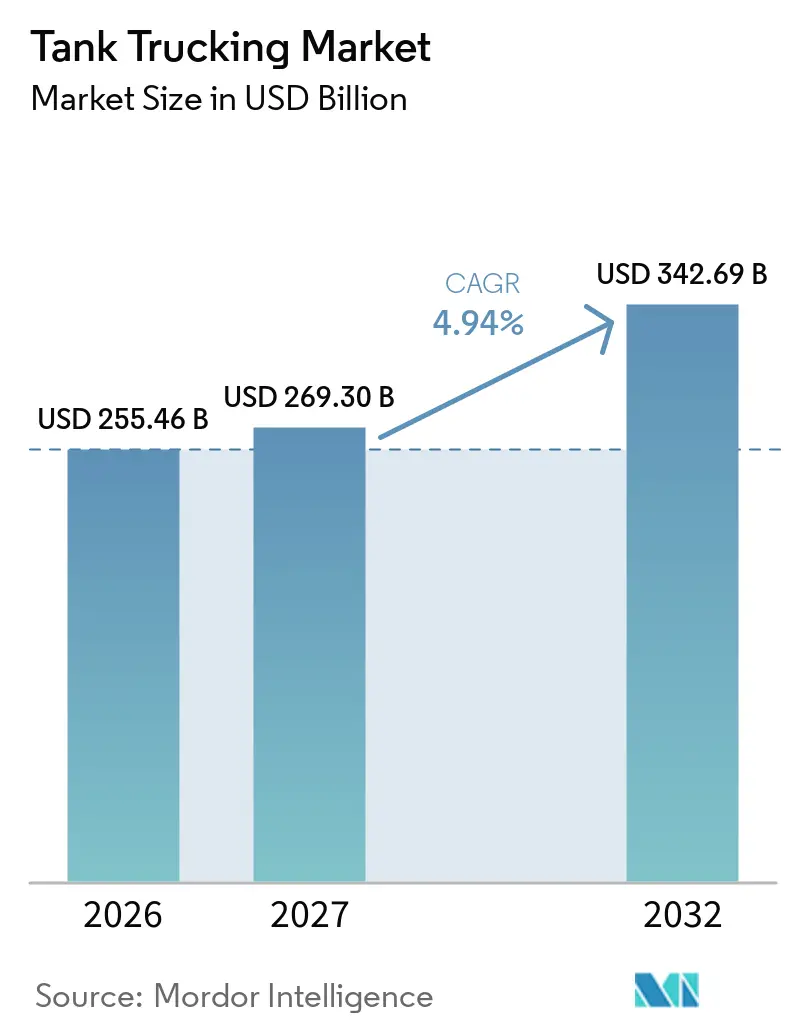
| Market Size (2027) | USD 269.30 Billion |
| Market Size (2032) | USD 342.69 Billion |
| Growth Rate (2027 - 2032) | 4.94 % |
| Fastest Growing Market | Asia-Pacific |
| Largest Market | Asia-Pacific |
| Market Concentration | Medium |
Major Players *Disclaimer: Major Players sorted in no particular order Image © Mordor Intelligence. Reuse requires attribution under CC BY 4.0. | |
Tank Trucking Market Analysis by Mordor Intelligence
The tank trucking market size is valued at USD 255.46 billion in 2026 and is estimated to grow from USD 269.3 billion in 2027 to reach USD 342.69 billion by 2032, at a CAGR of 4.94% during the forecast period (2027-2032).
Re-routed energy commodity flows, the transfer of captive bulk fleets to specialist carriers, and expanding industrial-gas distribution support demand across the tank trucking market. Chemical trade, food supply-chain compliance, and renewable-fuel distribution each require specialized equipment and certified operating practices. These needs raise the value of dedicated assets, cleaning capability, driver qualifications, and dense terminal networks. Larger carriers are strengthening their position through acquisitions, digital fleet tools, and managed transportation services. Compliance costs, a limited pool of qualified drivers, urban restrictions, tariffs, and geopolitical disruption continue to shape investment decisions in the tank trucking market.
Key Report Takeaways
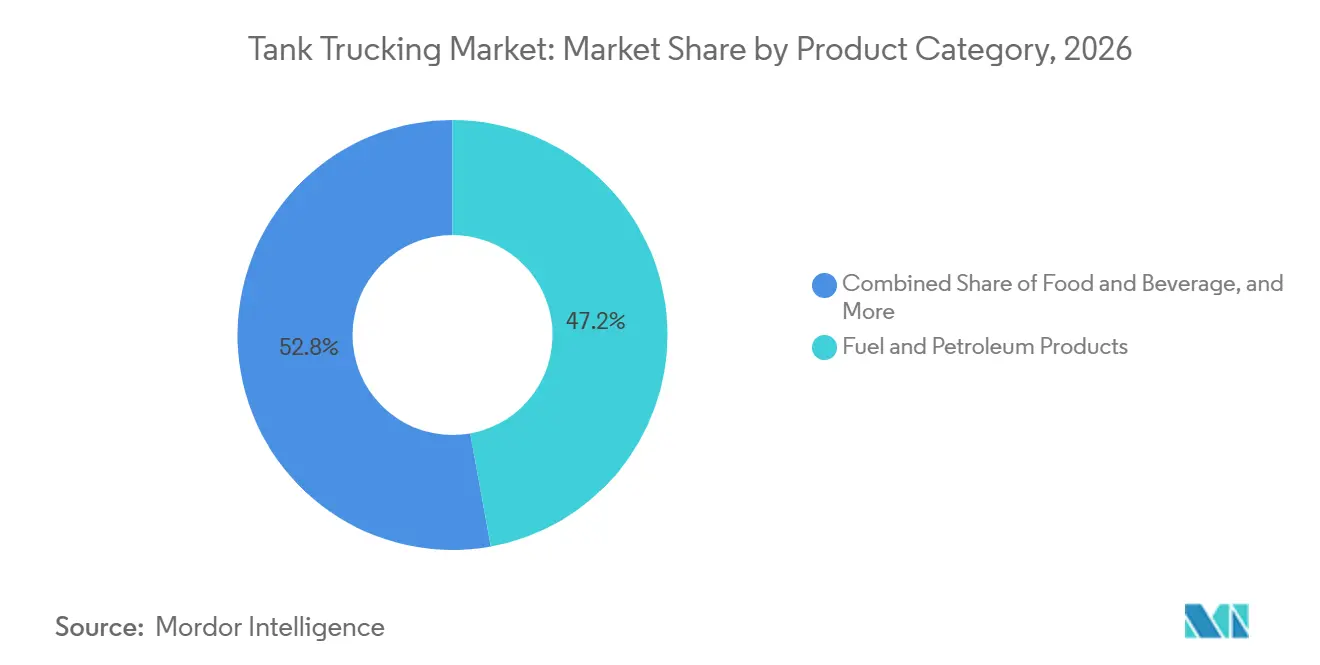
- By product category, fuel and petroleum products held a 47.16% share of the tank trucking market size in 2026, while food and beverage recorded the highest projected CAGR at 5.85% through 2032.
- By capacity, heavy-duty trucks held 52.20% of the tank trucking market size in 2026, while light-duty trucks recorded the highest projected CAGR at 5.43% through 2032.
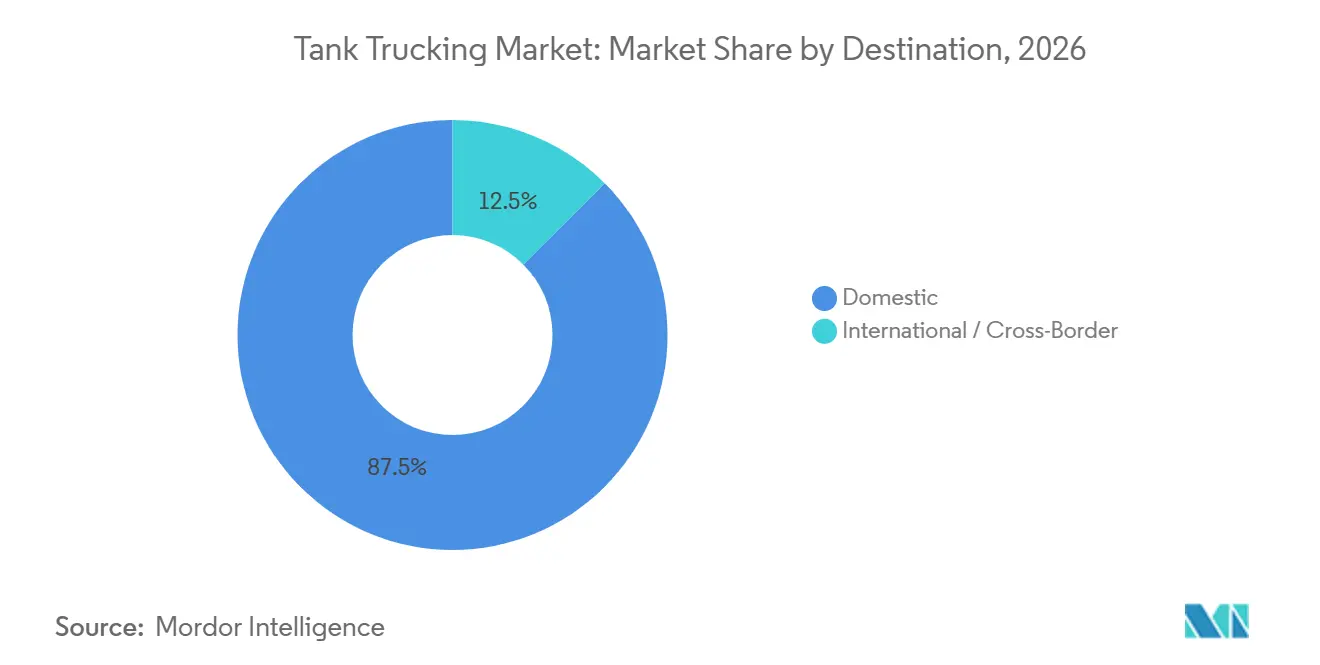
- By destination, domestic routes held 87.48% of the tank trucking market share in 2026, while international and cross-border movements recorded the highest projected CAGR at 6.16% through 2032.
- By distance, short-haul operations held 61.91% of the tank trucking market share in 2026, while long-haul operations recorded the highest projected CAGR at 5.24% through 2032.
- By geography, Asia-Pacific held 41.27% of the tank trucking market share in 2026 and recorded the highest projected CAGR at 6.20% through 2032.
Note: Market numbers in this report are based on Mordor Intelligence's proprietary estimation framework, which combines nine months of actuals with Q4 projections for base year 2026.
Global Tank Trucking Market Trends and Insights
Drivers Impact Analysis*
| Driver | (~) % Impact on CAGR Forecast | Geographic Relevance | Impact Timeline |
|---|---|---|---|
| Expansion of Chemical and Petrochemical Production | +1.2% | Global, concentrated in Asia-Pacific and the North American Gulf Coast | Long term (≥ 4 years) |
| Growth in Food-Grade Liquid Supply Chains | +0.9% | North America and Asia-Pacific, with spillover to the Middle East and Africa and South America | Medium term (2-4 years) |
| Expansion of Renewable Fuel and Biofuel Distribution | +0.7% | North America and Europe, with early gains in Southeast Asia | Medium term (2-4 years) |
| Rising Industrial Gas and LNG Distribution Requirements | +0.6% | Asia-Pacific, North America, and Northern Europe | Long term (≥ 4 years) |
| Digital Fleet Management and Telematics Adoption | +0.5% | North America and Europe, with spillover to Asia-Pacific | Short term (≤ 2 years) |
| Outsourcing of Dedicated Bulk Transportation | +0.4% | Global, with early concentration in North America | Medium term (2-4 years) |
| Source: Mordor Intelligence | |||
Expansion of Chemical and Petrochemical Production
Chemical production is shifting toward new manufacturing and trade corridors, creating additional road movements for liquids that cannot be served at the required frequency or batch size by pipelines and rail. Petrochemical capacity additions in China have created export surpluses that redirect feedstock shipments toward India and Southeast Asia. This movement lengthens distribution routes and supports new work for specialized carriers in the tank trucking market. India's Petroleum, Chemicals, and Petrochemicals Investment Region clusters are adding road-based logistics requirements around industrial locations where pipeline development takes longer to complete.[1] The United States Gulf Coast continues to support short-cycle chemical routes between refineries, terminals, and industrial customers. Dedicated tanks for hydrogen peroxide, acrylic acid, and caustic soda can support durable customer relationships because the equipment and operating protocols are cargo-specific.
Growth in Food-Grade Liquid Supply Chains
Food and beverage is the fastest-growing product category, as food manufacturers and retail buyers increasingly require dedicated fleets with clean-in-place certification, allergen-control records, and temperature monitoring. These requirements favor stainless-steel tanks and raise the cost of entry for general-purpose liquid carriers. Processed dairy, edible oils, liquid sweeteners, and ready-to-drink beverages are extending distribution chains from production facilities to regional warehouses across Southeast Asia and Latin America. Heniff consolidated its North American food-grade operations into the Heniff Food Grade network in February 2025, bringing multiple acquisitions together under one certified brand with approximately 2,000 tractors and 100 locations. The consolidation shows the value placed on a consistent compliance offering by customers with rigorous handling standards.
Expansion of Renewable Fuel and Biofuel Distribution
Renewable fuel distribution adds a distinct set of tank-trucking requirements because product handling, tank materials, and loading arrangements differ from standard petroleum service. The California Energy Commission funded the Fontana Renewable Fuels Terminal Expansion, which is increasing biodiesel and renewable diesel throughput from 10 million gallons per year to 88 million gallons per year by 2027.[2] The additional throughput supports dedicated, continuous truck-loading operations. Early investment in compliant biodiesel and gas equipment can reduce direct price competition on specialized routes. This pattern expands the addressable work for operators that can manage product segregation and safety requirements.
Rising Industrial Gas and LNG Distribution Requirements
Industrial gas and LNG distribution are opening new lanes for tank trucking market participants serving facilities without pipeline connections. The International Energy Agency projects USD 50 billion in global investment in small-scale LNG projects between 2025 and 2030. Such projects require road-based delivery to remote industrial users and smaller consumption points. The growth of these facilities strengthens demand for equipment, drivers, and operating processes designed for cryogenic cargo.
Restraints Impact Analysis*
| Restraint | (~) % Impact on CAGR Forecast | Geographic Relevance | Impact Timeline |
|---|---|---|---|
| Hazardous-Material Compliance Costs | -0.5% | Global, with the strongest regulatory influence in North America and the European Union | Medium term (2-4 years) |
| Shortage of Licensed Tank-Truck Drivers | -0.4% | North America, with spillover to Europe and Asia-Pacific | Short term (≤ 2 years) |
| Tank Segregation and Cleaning Bottlenecks | -0.3% | North America and Europe | Medium term (2-4 years) |
| Urban Access Restrictions for Bulk-Liquid Vehicles | -0.2% | Europe and major metropolitan areas globally | Long term (≥ 4 years) |
| Source: Mordor Intelligence | |||
Hazardous-Material Compliance Costs
Hazardous-material compliance remains a capital-intensive cost for carriers, even where focused rule changes offer relief. The Pipeline and Hazardous Materials Safety Administration found that marking-related compliance costs had reached USD 800 per vehicle before its February 2026 rule change. The agency stated that the rule creates USD 145.3 million in annualized savings for more than 23,000 small trucking companies. Chemical, gas, and corrosive-liquid carriers still bear inspection, training, registration, and equipment costs under federal hazardous-material rules.[3] Inspection failures can bring penalties of up to USD 8,000 per violation and can disrupt customer deliveries. These requirements place greater pressure on small regional fleets and can encourage consolidation within the tank trucking market.
Shortage of Licensed Tank-Truck Drivers
The availability of qualified tank-truck drivers is more constrained than the broader driver pool because hazardous-material and tank endorsements require additional testing and security review. A tank driver needs both a Hazardous Materials endorsement and a Tank Vehicle endorsement before taking on regulated loads. The hazardous-material endorsement also requires a Transportation Security Administration security threat assessment. The full path from commercial driver training to hazardous-material tank deployment can take 6 to 12 months. Federal action on non-domiciled commercial drivers' licenses may further affect the eligible driver pool.[4] This limited pipeline makes rapid capacity additions difficult when demand rises in the tank trucking market.
*Our forecasts treat driver/restraint impacts as directional, not additive. The impact forecasts reflect baseline growth, mix effects, and variable interactions.
Segment Analysis
By Product Category: Petroleum Dominance Persists as Food-Grade Cargo Accelerates
Fuel and petroleum products held 47.16% of the tank trucking market share in 2026. They remain central to last-mile delivery for retail stations, airports, and industrial users that do not have direct pipeline access. The segment serves both refined fuels and crude petroleum movements. Crude petroleum hauling is concentrated around North American shale basins and Middle Eastern export corridors, connecting wellheads, storage points, and terminals through high-use routes. Chemicals and dangerous goods require single-commodity tanks, cargo-tank inspections, and carrier-specific hazardous-material protocols. These specialized requirements can support stronger retention where customers need reliable, compliant handling. Water and wastewater transport is gaining relevance in water-stressed locations in the Middle East and Asia-Pacific. Municipal modernization and industrial process-water needs are supporting new fleet specializations.
Food and beverage is projected to expand at a 5.85% CAGR from 2027 to 2032 within the tank trucking industry. Formalized processed-food supply chains in Southeast Asia, Latin America, and the Middle East are extending the need for dedicated liquid transport. Stainless-steel tanks with verified cleaning, allergen separation, and temperature records help carriers meet customer requirements. Heniff's February 2025 food-grade network unification brought acquired operations under a common certified operating model. The network combined approximately 2,000 tractors and 100 locations. Agricultural chemicals, lubricants, and specialty industrial fluids also require increasingly differentiated tank configurations. Customers are favoring carriers that can match equipment and cleaning processes to each cargo type. This raises the importance of specialized assets across the tank trucking market.

By Capacity: Heavy Duty Commands Revenue as Light Duty Adapts to Evolving Urban Demand
Heavy-duty trucks accounted for 52.20% of the tank trucking market size in 2026. Their position reflects the cost advantage of carrying the highest practical payload per journey. Petroleum and chemical terminals in the United States Gulf Coast, Middle Eastern export locations, and Asia-Pacific petrochemical clusters are designed around articulated tanker operations. This configuration supports interregional and export-linked movements. Medium-duty equipment serves regional distribution, including food-grade deliveries where weight limits and turning constraints matter. These trucks provide a balance between payload and access in locations that cannot support the largest combinations. The mix of vehicle capacities allows carriers to align equipment with terminal design, road rules, and delivery needs.
Light-duty capacity is the fastest-growing category at a 5.43% CAGR from 2027 to 2032 in the tank trucking industry. Urban chemical and food-grade deliveries require shorter vehicles in dense metropolitan areas and factory compounds. Smaller batch deliveries to Mexican border manufacturing locations are adding demand for light- and medium-duty service. HOYER strengthened its Mexico City ISO tank and trucking operations in 2025, supporting activity linked to regional manufacturing corridors. Smart-trailer technology can give smaller fleets access to location, tire, brake, and load information. These capabilities can improve equipment visibility for fleets that lack the scale of the largest operators. Equipment providers and carriers are using digital fleet-management systems to improve routing and maintenance decisions. The result is broader use of light-duty assets in the tank trucking market where urban access is important.
By Destination: Domestic Corridors Anchor Revenue as Cross-Border Trade Opens Growth Lanes
Domestic routes accounted for 87.48% of the tank trucking market size in 2026. Intra-country petroleum and chemical movements form the core of carrier revenue because refineries, terminals, production sites, and customers are linked through established domestic corridors. Dedicated-fleet contracts provide stable work across these routes. Domestic food-grade distribution is also expanding in Asia-Pacific as urban centers become more distant from processing facilities. Longer delivery distances can raise revenue per trip on existing routes. Managed transportation providers serve this part of the tank trucking market by coordinating shipper relationships and converting private fleets. Their integrated approach can provide consistency through changing freight conditions. Domestic work, therefore, remains the foundation for fleet utilization.
International and cross-border movements are projected to expand at a 6.16% CAGR from 2027 to 2032. North American nearshoring is adding chemical and industrial-gas movements between the United States and Mexico. Carriers are positioning equipment around the Texas-Mexico border to serve Gulf Coast production sites and Mexican manufacturing facilities. In Southeast Asia, trade between Thailand, Vietnam, and Malaysia is creating cross-border demand for petrochemical and food-grade cargo. Producers are increasingly serving several national markets from a single production location. Customs documentation, multi-jurisdiction driver credentials, and bilateral agreements create operational complexity. Carriers that can manage this work can secure a differentiated role in the tank trucking market. These requirements also create a barrier for operators focused solely on domestic routes.
By Distance: Short Haul Drives Volume as Long Haul Extends Distribution Radii
Short-haul operations accounted for 61.91% of the tank trucking market share in 2026. These movements connect petrochemical complexes, refineries, food-processing facilities, and terminals within compact industrial areas. High-frequency routes allow tank trucks to make several loaded trips within a shift. The United States Gulf Coast activity includes ammonia, refinery feedstocks, and refined fuel movements along terminal-to-customer circuits. The short-cycle model supports high equipment utilization where loading and unloading operations are efficient. Carriers with dense local networks can develop strong customer ties through dependable daily service. Tank segregation and cleaning capacity are critical because delays can interrupt the rapid rotation of equipment. This keeps short-haul work at the center of the tank trucking market.
Long-haul operations are projected to advance at a 5.24% CAGR from 2027 to 2032. Biofuel production sites and retail distribution networks are often separated by long distances. Industrial-gas lanes also connect coastal LNG terminals with inland users that lack pipeline access. Route optimization and telematics can help carriers reduce empty miles and improve driver scheduling. Kenan Advantage Group expanded a private fleet conversion program into 3 new markets in January 2026, including Kansas City, Pueblo, and Alamosa. The move reflects the appeal of outsourced specialist transportation on routes that require operational consistency. Longer routes need careful planning around driver hours, cleaning availability, and delivery windows. These conditions broaden the operational scope of the tank trucking market.
Geography Analysis
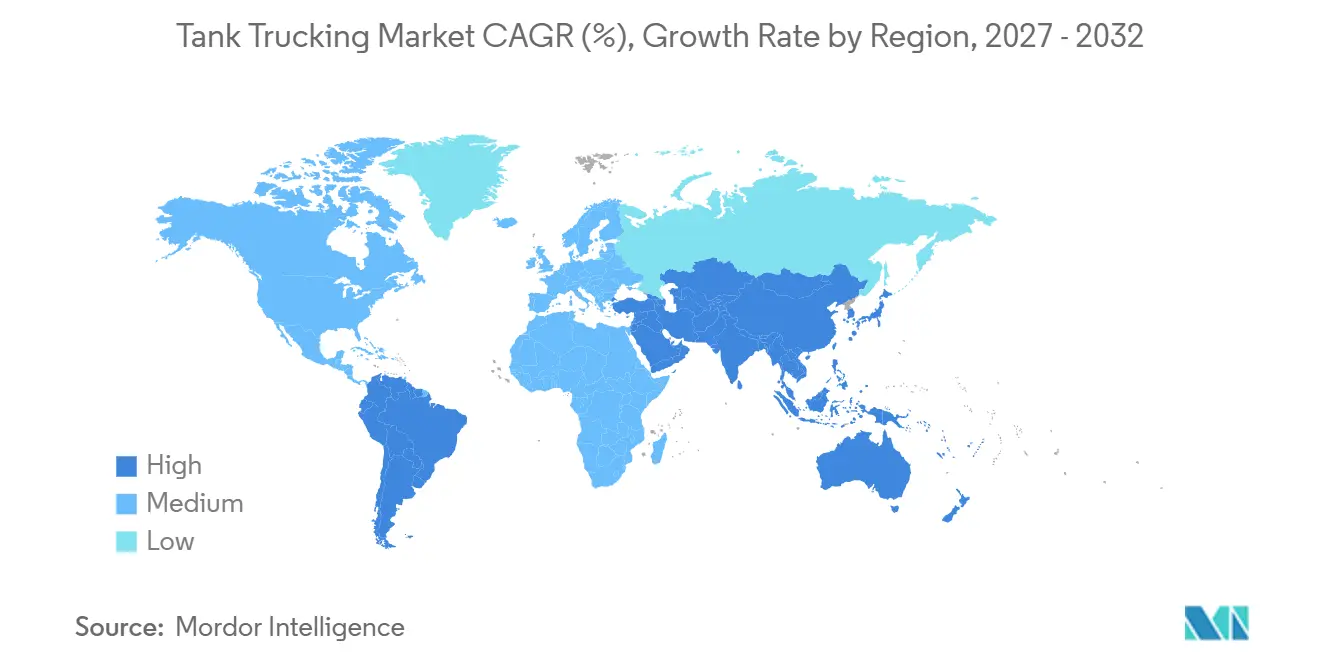
Asia-Pacific held 41.27% of revenue in 2026 and registered a 6.20% CAGR from 2027 to 2032. China’s chemical output supports extensive road distribution alongside rail and pipelines. India’s industrial clusters add requirements for road-based chemical movements. Japan, South Korea, and Southeast Asia add LNG, petrochemical, and food-grade demand. North America is the second-largest regional area, supported by the United States Gulf Coast petrochemical base and trade with Mexico.
Europe has a mature chemical-logistics network, but urban-access rules are reshaping local distribution. Since January 2025, 18 Dutch cities, including Amsterdam, Rotterdam, and Utrecht, have put zero-emission freight zones in place for vehicles above 3.5 tons. Operators with older diesel tankers face fleet-renewal decisions and may need to redesign urban delivery patterns. Research found that low-emission zones reduce particulate matter and nitrogen oxide emissions by 20% to 34%. The Middle East and Africa offer potential through Saudi industrial development, Qatar’s LNG infrastructure, and Nigeria’s petroleum distribution needs.
South America is smaller, but its cargo profile creates specific opportunities for the tank trucking market. Brazil’s ethanol distribution supports domestic tanker activity, while Chile and Argentina require food-grade assets for edible oils and agricultural liquids. Peru and Colombia are adding chemical and fuel distribution needs as mining and industrial processing develop. HOYER acquired INTER-TANK in Chile and opened a Bogota office in February 2025, broadening services across ISO tanks, flexitanks, gases, intermediate bulk containers, and trucking.
Competitive Landscape
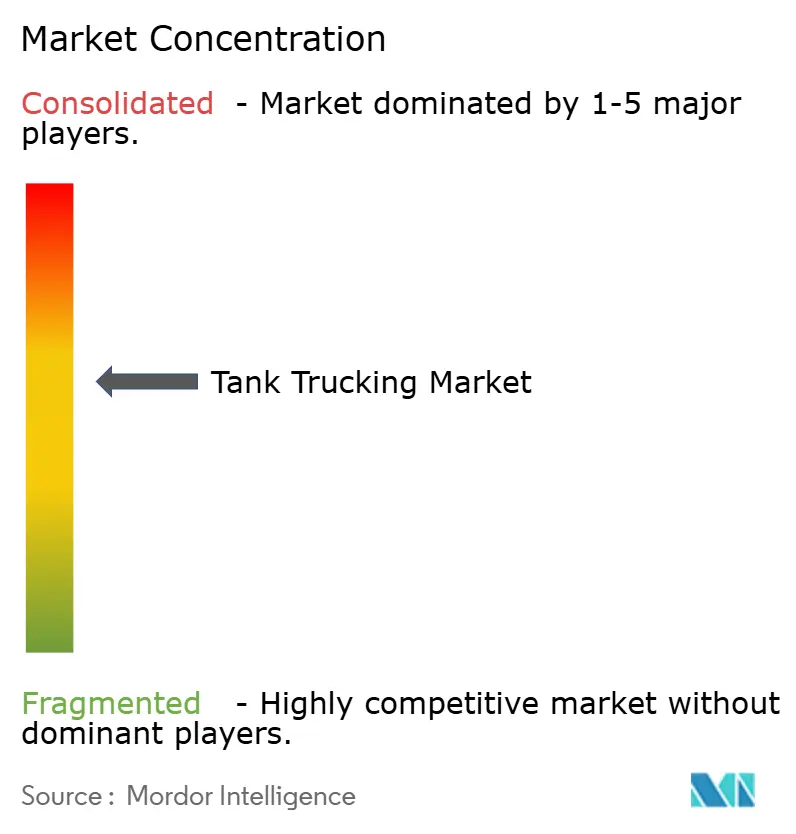
The tank trucking market is moderately concentrated among the carriers and operators. Service reach and specialized capability are important sources of competition in the tank trucking market. Leading carriers have advantages in hazardous-material certification, terminal coverage, tank-cleaning networks, and specialized equipment. Kenan Advantage Group reported USD 2.43 billion in revenue in 2026, while Quality Carriers reported USD 816 million and Quantix Supply Chain Solutions reported approximately USD 469 million. Trimac acquired Service Transport Company in October 2025, adding 16 locations, 4 tank-wash facilities, 290 tractors, 750 trailers, and 300 specialist chemical-transport drivers.
Cross-border chemical logistics, food-grade tank-cleaning networks, and industrial-gas deliveries without pipeline access remain important areas of opportunity. Operators that combine asset-backed trucking with freight brokerage and managed transportation can reduce their exposure to changing transport rates. Digital fleet-management platforms support route planning, predictive maintenance, and lower detention time. A PHMSA final rule published in January 2026 authorized video cameras for cargo-tank motor-vehicle inspections. Digital freight-matching services are increasing price visibility in commodity petroleum and chemical lanes, encouraging technology partnerships and transportation-management-system upgrades.
Trimac acquired California Freight in August 2026, adding 8 terminals, a brokerage operation, and a 400,000 ft² warehouse for West Coast food-grade distribution. Quantix added partnerships with MC Tank Lines and Leahy Transport in January 2026, extending its liquid-carrier network to more than 70 North American locations. HOYER acquired Dantra Group in Northern Europe during 2025 HOYER GROUP. Smaller carriers retain a role where local knowledge, dedicated customer service, and cargo qualifications are decisive in the tank trucking market.
Tank Trucking Industry Leaders
-
Kenan Advantage Group
-
Quality Carriers
-
Quantix Supply Chain Solutions
-
United Petroleum Transports
-
Trimac Transportation
- *Disclaimer: Major Players sorted in no particular order
Recent Industry Developments
- September 2026: Trimac opened a new full-service ISO tank depot in the Houston, Texas area, adding cleaning, maintenance, storage, and drayage capabilities to strengthen its Gulf Coast bulk liquid and chemical logistics presence.
- August 2026: Trimac acquired California Freight, a bulk food-grade logistics operator in California's Central Valley, adding 8 terminals, a brokerage operation, and a 400,000 ft² warehouse.
- January 2026: Quantix announced strategic partnerships with MC Tank Lines and Leahy Transport, expanding its bulk liquid carrier network to more than 70 locations across North America. The partnerships strengthen Quantix's ability to deliver flexible and scalable chemical logistics solutions to its industrial customer base.
- January 2026: KAG completed a private fleet conversion agreement with an existing global energy services customer, extending its dedicated transportation management program into 3 new markets, Kansas City, Missouri, and Pueblo and Alamosa, Colorado, reflecting the growing preference among energy companies to outsource fleet operations to specialist carriers.
Global Tank Trucking Market Report Scope
| Crude Petroleum |
| Fuel and Petroleum Products |
| Chemicals and Dangerous Goods |
| Food and Beverage |
| Water and Wastewater |
| Other Product Categories |
| Light Duty |
| Medium Duty |
| Heavy Duty |
| Domestic |
| International / Cross-Border |
| Long Haul |
| Short Haul |
| North America | United States |
| Canada | |
| Mexico | |
| South America | Brazil |
| Argentina | |
| Peru | |
| Chile | |
| Rest of South America | |
| Europe | Germany |
| United Kingdom | |
| France | |
| Italy | |
| Spain | |
| Russia | |
| Nordics (Denmark, Finland, Iceland, Norway, and Sweden) | |
| Rest of Europe | |
| Asia-Pacific | China |
| India | |
| Japan | |
| South Korea | |
| Australia | |
| Southeast Asia (ASEAN) | |
| Rest of Asia-Pacific | |
| Middle East and Africa | Saudi Arabia |
| United Arab Emirates | |
| Qatar | |
| South Africa | |
| Nigeria | |
| Egypt | |
| Rest of Middle East and Africa |
| By Product Category | Crude Petroleum | |
| Fuel and Petroleum Products | ||
| Chemicals and Dangerous Goods | ||
| Food and Beverage | ||
| Water and Wastewater | ||
| Other Product Categories | ||
| By Capacity | Light Duty | |
| Medium Duty | ||
| Heavy Duty | ||
| By Destination | Domestic | |
| International / Cross-Border | ||
| By Distance | Long Haul | |
| Short Haul | ||
| By Geography | North America | United States |
| Canada | ||
| Mexico | ||
| South America | Brazil | |
| Argentina | ||
| Peru | ||
| Chile | ||
| Rest of South America | ||
| Europe | Germany | |
| United Kingdom | ||
| France | ||
| Italy | ||
| Spain | ||
| Russia | ||
| Nordics (Denmark, Finland, Iceland, Norway, and Sweden) | ||
| Rest of Europe | ||
| Asia-Pacific | China | |
| India | ||
| Japan | ||
| South Korea | ||
| Australia | ||
| Southeast Asia (ASEAN) | ||
| Rest of Asia-Pacific | ||
| Middle East and Africa | Saudi Arabia | |
| United Arab Emirates | ||
| Qatar | ||
| South Africa | ||
| Nigeria | ||
| Egypt | ||
| Rest of Middle East and Africa | ||
Key Questions Answered in the Report
What is the projected value of tank trucking by 2032?
The tank trucking market is projected to reach USD 342.69 billion by 2032, from USD 269.3 billion in 2027.
What is driving demand for specialized liquid transport?
Chemical production, food-grade compliance, renewable fuels, and industrial-gas distribution are expanding the need for specialized equipment and certified operations.
Which cargo category is growing fastest through 2032?
Food and beverage is the fastest-growing product category, with a projected 5.85% CAGR from 2027 to 2032.
Why are domestic routes important for liquid carriers?
Domestic routes held 87.48% of revenues in 2026 because petroleum and chemical distribution depends on established national corridors.
Which region leads global tank trucking activity?
Asia-Pacific held 41.27% of global revenue in 2026 and is projected to expand at a 6.20% CAGR through 2032.
What operational challenges affect tanker fleets?
Hazardous-material compliance, qualified-driver availability, tank cleaning, and urban-access rules can constrain capacity and raise operating costs.