
Sustainable IT Hardware Market Size and Share
Market Overview
| Study Period | 2020 - 2031 |
|---|---|
| Market Size (2026) | USD 25.32 Billion |
| Market Size (2031) | USD 37.55 Billion |
| Growth Rate (2026 - 2031) | 8.20 % |
| Fastest Growing Market | Asia Pacific |
| Largest Market | North America |
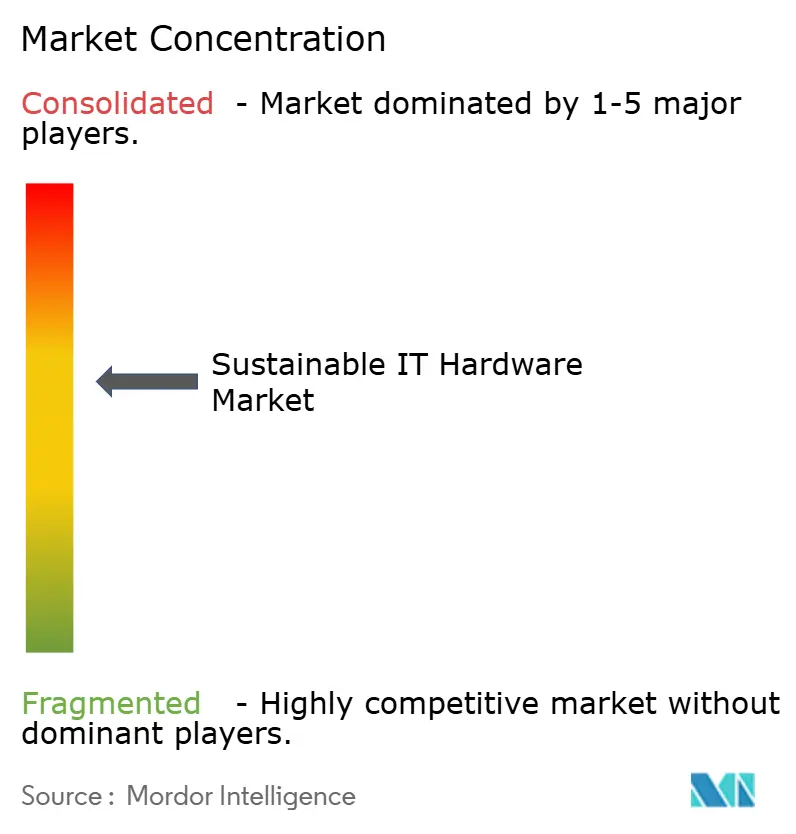
| Market Concentration | Medium |
Major Players *Disclaimer: Major Players sorted in no particular order Image © Mordor Intelligence. Reuse requires attribution under CC BY 4.0. | |
Sustainable IT Hardware Market Analysis by Mordor Intelligence
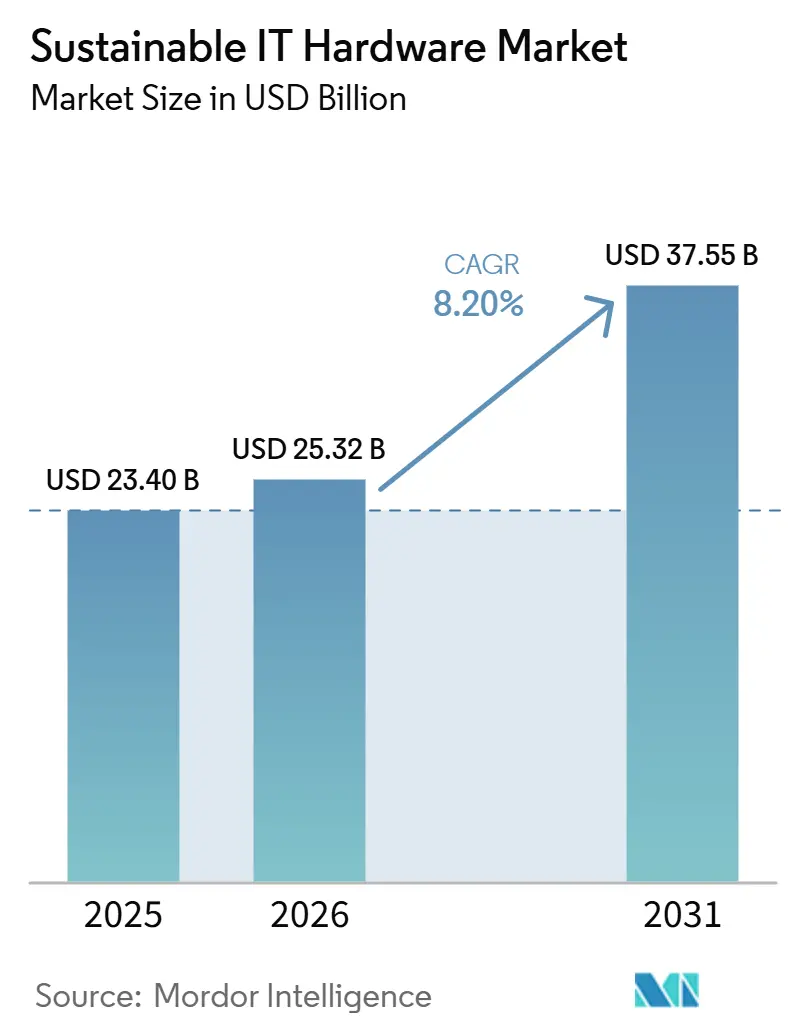
The sustainable IT hardware market size is expected to increase from USD 23.4 billion in 2025 to USD 25.32 billion in 2026 and reach USD 37.55 billion by 2031, growing at a CAGR of 8.20% over 2026-2031. Rising e-waste and carbon-reporting mandates, expanding hyperscale data-center footprints, and board-level environmental, social, and governance (ESG) procurement policies are converging to accelerate capital flows toward energy-efficient, repairable, and recyclable devices. Vendors are redesigning servers, storage, and networking gear around liquid cooling, wide-bandgap power components, and modular form factors to cut operational emissions and simplify disassembly. In parallel, service contracts such as device-as-a-service and certified asset-recovery programs are shifting spending from one-off purchases to outcome-based models, enabling enterprises to audit lifecycle impacts and avoid up-front capital outlays.
Key Report Takeaways
- By product type, servers led with 37.6% revenue share of the sustainable IT hardware market in 2025; the category is projected to expand at a 10.9% CAGR through 2031.
- By component, hardware accounted for 61.9% of the sustainable IT hardware market in 2025, while services are advancing at a 9.4% CAGR through 2031.
- By end-user industry, data centers accounted for 40.80% of the sustainable IT hardware market in 2025, while telecom and IT are advancing at a 11.2% CAGR through 2031.
- By lifecycle phase, operation and usage accounted for 47.20% of the sustainable IT hardware market in 2025, while end-of-life and recycling are advancing at a 11.8% CAGR through 2031.
- By geography, North America accounted for 53.8% of the sustainable IT hardware market in 2025; Asia-Pacific is the fastest rising region at a 12.2% CAGR to 2031.
Note: Market size and forecast figures in this report are generated using Mordor Intelligence’s proprietary estimation framework, updated with the latest available data and insights as of January 2026.
Market Trends and Insights
Drivers Impact Analysis of Sustainable IT Hardware Market*
| Driver | (~) % Impact on CAGR Forecast | Geographic Relevance | Impact Timeline |
|---|---|---|---|
| Stringent E-Waste and Carbon Regulations Globally | +2.1% | Global, early enforcement in EU and California | Medium term (2-4 years) |
| Enterprise ESG and Net-Zero Procurement Mandates | +1.8% | North America and Europe, expanding to Asia-Pacific | Short term (≤ 2 years) |
| Rapid Expansion of Hyperscale and Edge Data Centers | +1.5% | North America, Asia-Pacific, Middle East | Medium term (2-4 years) |
| Growing Demand for Energy-Efficient High-Density AI Servers | +1.3% | Global, concentrated in North America and China | Short term (≤ 2 years) |
| Emergence of Circular Economy IT-as-a-Service Models | +0.9% | Europe and North America, pilots in Asia-Pacific | Long term (≥ 4 years) |
| Advancements in Low-Voltage Silicon Carbide and GaN Power Components | +0.6% | Global, led by Taiwan, Japan and United States | Long term (≥ 4 years) |
| Source: Mordor Intelligence | |||
Stringent E-Waste and Carbon Regulations Globally
Amendments to the European Union’s WEEE Directive in 2024 lifted collection targets to 70% and introduced financial penalties for manufacturers that fail to fund take-back schemes, prompting design teams to prioritize easy-to-disassemble chassis and standardized fasteners.[1]Official Journal of the European Union, “Directive (EU) 2024/884 Amending Directive 2012/19/EU,” eur-lex.europa.eu China’s updated recovery rules require suppliers of enterprise-grade storage arrays to set up provincial collection networks by 2026, accelerating investment in reverse logistics hubs. California’s Senate Bill 244 mandates 30% post-consumer recycled content in all IT equipment sold in the state by 2028, driving demand for certified recycled plastics and low-carbon aluminum.
Enterprise ESG and Net-Zero Procurement Mandates
A 2024 Carbon Disclosure Project survey found that 68% of Fortune 500 firms embedded lifecycle-emission thresholds into server and storage requests for proposals, up from 41% in 2022.[2]Carbon Disclosure Project, “Global Supply Chain Report 2024,” cdp.net Microsoft’s 2025 Supplier Code of Conduct now requires product-level lifecycle assessments aligned with ISO 14040 and evidence of annual embodied-carbon reductions per teraflop or terabyte. Google disclosed that 82% of its 2024 server purchases met EPEAT Climate+ criteria, lifting industry demand for renewable-powered manufacturing and verified offset schemes.
Rapid Expansion of Hyperscale and Edge Data Centers
Amazon Web Services brought online 15 availability zones in 2024, adding 2.5 gigawatts of IT load and committing USD 12.7 billion for additional capacity in 2025.[3]U.S. Securities and Exchange Commission, “SEC Adopts Rules to Enhance and Standardize Climate-Related Disclosures for Investors,” sec.gov Microsoft announced a USD 10 billion data-center build-out across India with facilities designed for LEED Gold certification and onsite solar covering 40% of daytime demand. The ITU-T L.1333 specification caps power-usage effectiveness at 1.30 for edge sites below 500 kilowatts, pushing liquid-cooling adoption at the network edge.[4]International Telecommunication Union, “ITU-T L.1333,” itu.int
Growing Demand for Energy-Efficient High-Density AI Servers
NVIDIA’s HGX H200 introduces cold-plate liquid cooling to handle 10.2 kilowatts per server, while AMD’s MI300X chiplet architecture lowers idle power 28% relative to monolithic accelerators. Supermicro’s 2025 earnings reveal 140% year-over-year growth in liquid-cooled shipments, reflecting hyperscaler moves to maintain sub-1.20 power-usage effectiveness. ENERGY STAR Version 4.0 imposes new idle-state power caps that favor multi-die processors with dynamic voltage scaling, accelerating refresh cycles.
Restraints Impact Analysis of Sustainable IT Hardware Market*
| Restraint | (~) % Impact on CAGR Forecast | Geographic Relevance | Impact Timeline |
|---|---|---|---|
| High Upfront Cost of Sustainable Hardware and Cooling Retrofits | -1.2% | Global, acute in SME and emerging-market segments | Short term (≤ 2 years) |
| Supply Chain Volatility for Low-Carbon Components | -0.9% | Global, concentrated in rare-earth and conflict-mineral sourcing | Medium term (2-4 years) |
| Lack of Standardized Sustainability Metrics Across Regions | -0.5% | Global, fragmented between EU, North America and Asia-Pacific | Long term (≥ 4 years) |
| Scarcity of Skilled Labor for Circular Logistics | -0.3% | Europe and North America | Long term (≥ 4 years) |
| Source: Mordor Intelligence | |||
High Upfront Cost of Sustainable Hardware and Cooling Retrofits
Liquid-cooled racks cost 40%-60% more to install than air-cooled equivalents because of coolant distribution units, leak sensors, and facility piping upgrades, extending payback periods beyond three years in regions where electricity prices remain below USD 0.08 per kWh. ENERGY STAR-certified storage arrays carry 12%-18% higher list prices driven by low-power NAND, advanced error correction, and verification fees, offsetting efficiency savings in low-utilization environments.
Supply Chain Volatility for Low-Carbon Components
Tantalum capacitor prices spiked 22% between January 2024 and March 2025 as automakers and aerospace firms competed for certified conflict-free ore, adding cost pressure to server power stages. Low-carbon aluminum trades at USD 400-600 per metric ton above conventional ingot, lifting the bill-of-materials for chassis and heat sinks by up to 12%. China controls roughly 70% of global rare-earth-refining capacity, and export quota adjustments can trigger spot-price jumps exceeding 30% within a single quarter, forcing manufacturers to expand safety stock.
*Our forecasts treat driver/restraint impacts as directional, not additive. The impact forecasts reflect baseline growth, mix effects, and variable interactions.
Sustainable IT Hardware Market Segment Analysis
By Product Type:
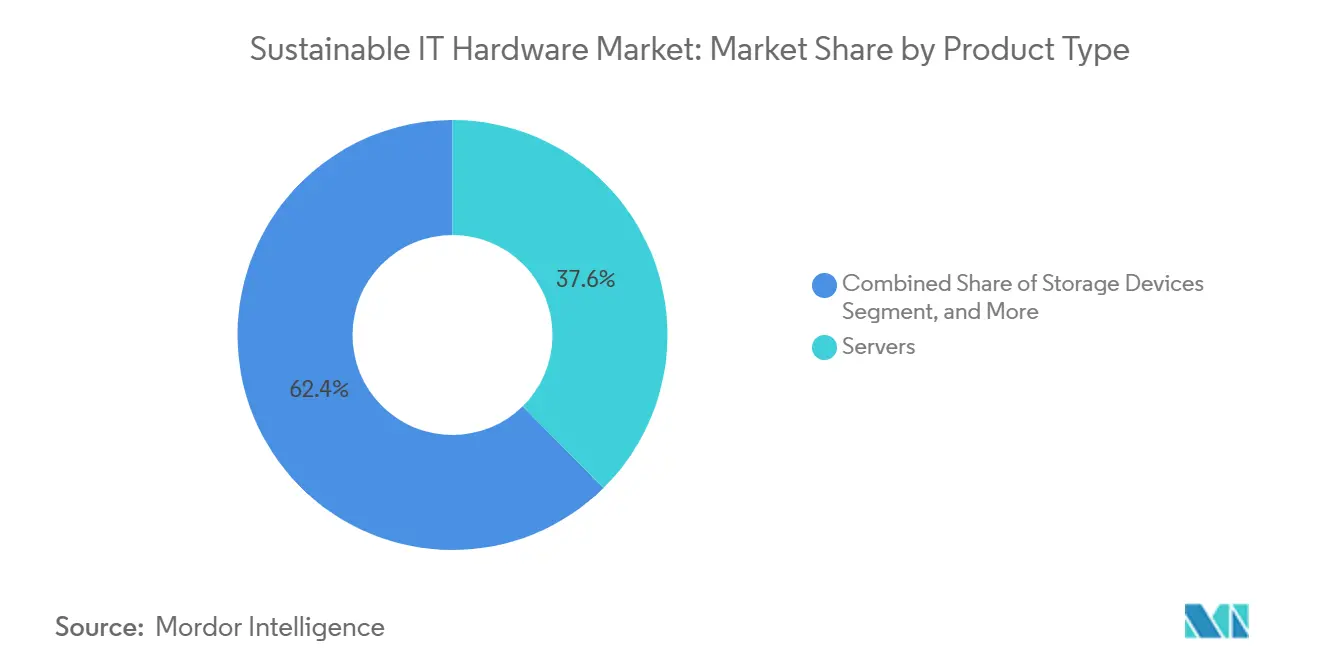
Servers Lead Density and Efficiency GainsServers accounted for 37.6% of 2025 revenue and are forecast to grow at a 10.9% CAGR, the highest among categories, as hyperscale clouds adopt liquid-cooled chassis optimized for generative-AI inference workloads. This uptake supports the sustainable IT hardware market size for servers, enabling operators to double compute density and defer new building permits. Chiplet-based x86 and ARM processors integrate silicon-carbide power modules that cut conversion losses up to 25%, aligning with corporate net-zero roadmaps. Storage vendors pivot to NVMe-over-Fabrics and computational drives like Seagate’s Exos CORVAULT, which extends mean-time-to-data-loss past 3.5 million hours while lowering energy per I/O cycle. Networking equipment benefits from 800 Gbps switch silicon that delivers 35% better watts per gigabit, sustaining sustainable IT hardware market share gains as AI cluster fabrics expand.
Peripherals, PCs, and power equipment are experiencing steady growth, driven by advancements in technologies such as USB Power Delivery 3.1, sleep-mode sensors, and predictive UPS analytics. These innovations are essential to meet the stricter ENERGY STAR Version 9.0 thresholds, which emphasize energy efficiency and sustainability. For instance, Vertiv’s machine-learning UPS algorithms have proven effective in delaying battery replacements by up to 20% over a ten-year period. This not only reduces operational costs but also significantly curtails lifecycle emissions, contributing to environmental sustainability. Furthermore, these advancements collectively support circular procurement practices by ensuring that commodity metals are preserved and reintroduced into manufacturing processes, thereby promoting a more sustainable and resource-efficient production cycle.



By Component:
Services Gain Share Through Lifecycle ManagementHardware delivered 61.9% of sustainable IT hardware market revenue in 2025, though services are expanding at a 9.4% CAGR as enterprises outsource carbon accounting, asset tracking and refurbishment. This dynamic underpins a rising sustainable IT hardware market share for managed services, especially among global banks and retailers that lack in-house disposal capacity. Schneider Electric’s EcoStruxure IT shifted workloads to off-peak windows, cutting one Fortune 100 firm’s data-center power by 14% in 2024. HPE GreenLake Sustainability Services publishes quarterly reports on avoided emissions and water savings, aligning with Scope 3 requirements for purchased goods. Logistics specialists such as Iron Mountain recovered 18,500 metric tons of steel and precious metals from 2.3 million IT units in 2024, reinforcing closed-loop supply chains.
Software spending mirrors hardware refresh cycles, with AI workload-placement engines and digital twins enabling operators to model thermodynamics and electricity grids in real time. These advanced technologies allow businesses to optimize energy consumption, reduce operational inefficiencies, and enhance overall system performance. By leveraging AI-driven insights, operators can predict and mitigate potential issues, ensuring seamless operations and minimizing downtime. Additionally, these orchestration layers reduce stranded capacity, enabling more efficient resource utilization. This trend drives incremental demand for subscription licenses that bundle essential features such as security, energy management, and lifecycle dashboards, offering a comprehensive solution for modern operational challenges.
By End-User Industry:
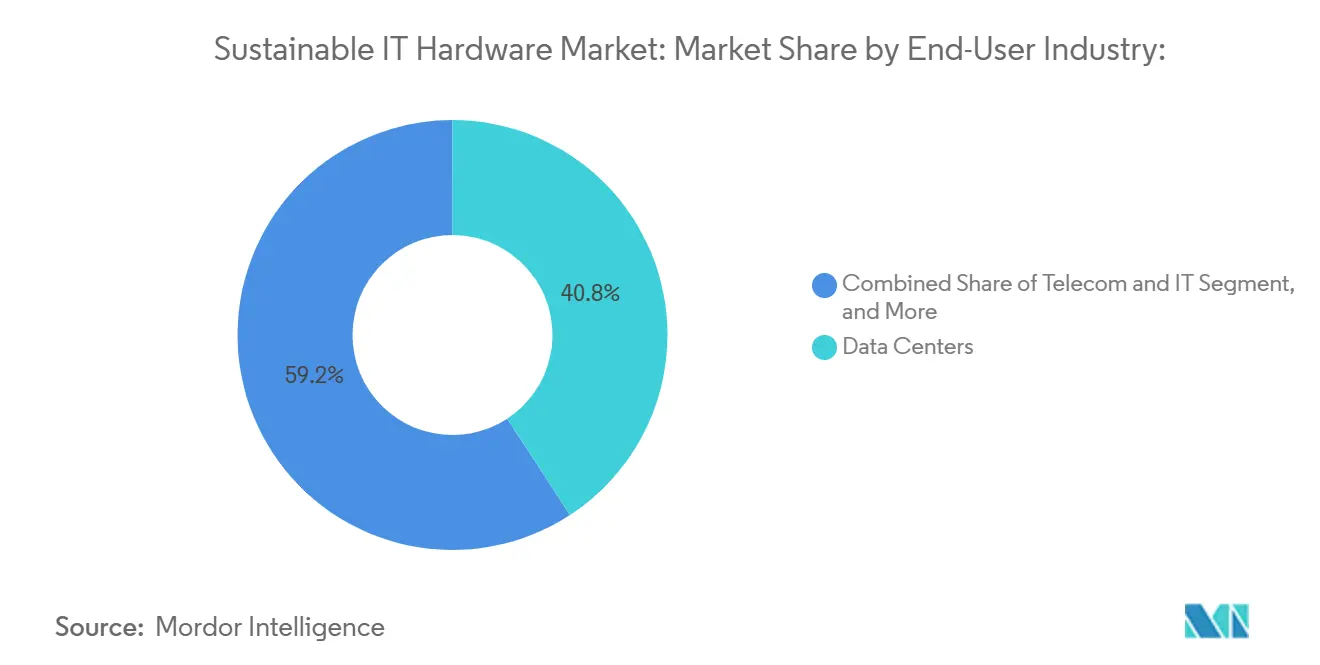
Telecom and IT Outpace Traditional VerticalsData centers represented 40.8% of 2025 spend, but telecom and IT posted the fastest expansion at 11.2% CAGR as carriers roll out network slicing and edge compute sites conforming to ITU efficiency caps. Verizon disclosed 1,200 edge nodes equipped with ENERGY STAR-certified gear that cut per-site power 22% versus legacy units, bolstering the sustainable IT hardware market size among operators. Large enterprises refresh infrastructure to claim utility rebates and satisfy board-level ESG mandates, with 54% planning to replace at least 30% of server fleets by 2026.
SMEs increasingly prefer device-as-a-service (DaaS) bundles as a means to avoid significant upfront capital expenditures, allowing them to manage costs more effectively while accessing the latest technology. On the other hand, public-sector buyers are placing greater emphasis on sustainability by enforcing EPEAT (Electronic Product Environmental Assessment Tool) ratings and recycled-content thresholds to ensure environmentally responsible procurement. Additionally, the U.S. General Services Administration (GSA) has mandated ISO 14025 environmental declarations for IT Schedule 70 contracts. This requirement pushes suppliers to adopt more transparent practices, including detailed bill-of-materials reporting, which aligns with the growing demand for accountability and sustainability in IT procurement processes.
By Lifecycle Phase:
End-of-Life Recycling AcceleratesOperation and usage absorbed 47.2% of the 2025 value because of electricity and maintenance outlays, but end-of-life recycling is rising at an 11.8% CAGR, the highest among phases, supported by EU producer-responsibility rules and U.S. landfill bans. This trend elevates the sustainable IT hardware market size for recycling services as hydrometallurgical processes recover rare-earth elements and gold with high purity. The increasing focus on sustainability has driven companies to adopt advanced recycling technologies, ensuring compliance with stringent regulations. Additionally, the growing awareness among consumers and businesses about environmental impacts has further accelerated the demand for efficient recycling solutions. These factors collectively contribute to the expansion of the recycling phase within the sustainable IT hardware market.
Dell reclaimed 11,200 metric tons of plastics and metals in fiscal 2024, while HP raised recycled plastic content in commercial PCs to 12%. Digital product passports mandated under the EU Ecodesign Regulation embed QR codes that streamline disassembly and material triage. These passports enhance transparency and traceability, enabling efficient recycling and reuse of materials. Companies are increasingly leveraging such innovations to meet regulatory requirements and improve their sustainability credentials. Furthermore, the integration of digital tools in recycling processes is expected to drive operational efficiency and reduce costs, making sustainable practices more accessible to businesses of all sizes.
Geography Analysis
North America Sustainable IT Hardware Market
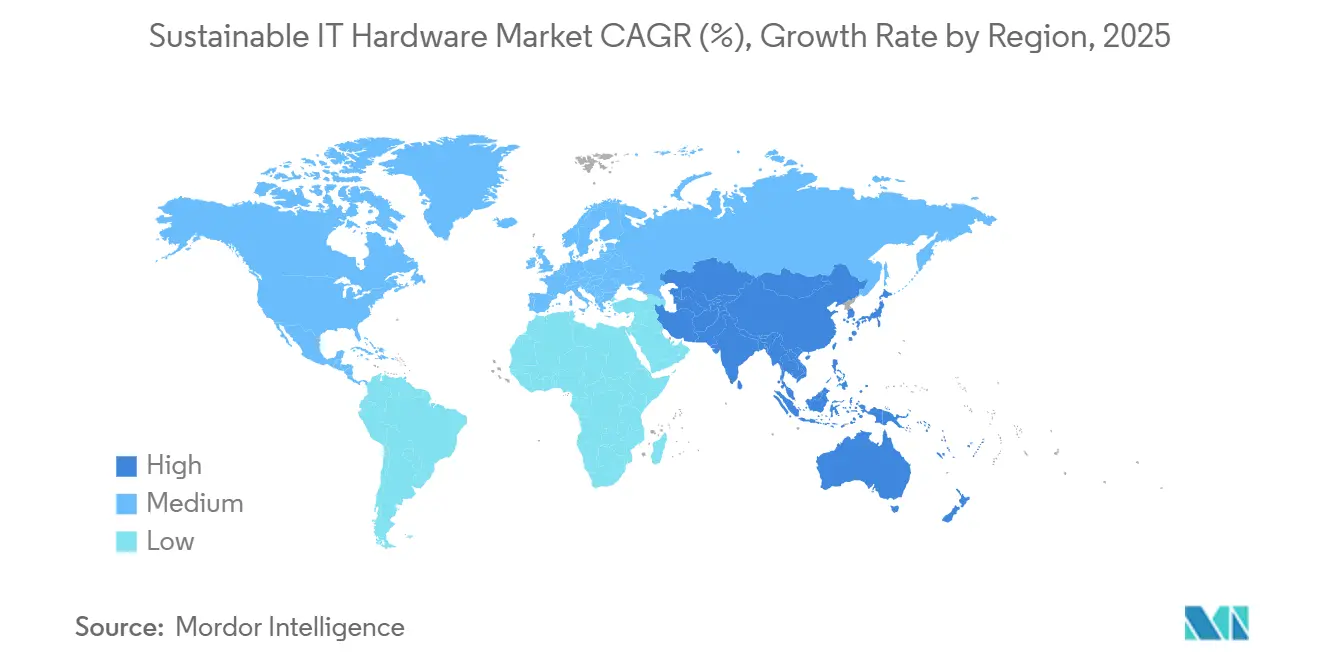
North America captured 53.8% of 2025 revenue, powered by hyperscale clouds, stringent ENERGY STAR standards, and new U.S. Securities and Exchange Commission climate-disclosure rules that force large filers to audit Scope 3 emissions from IT assets. Federal agencies and 29 states require EPEAT-Silver or higher ratings, pushing vendors to publish product-level carbon footprints. Canada’s Greening Government Strategy mandates net-zero operations by 2030, further boosting procurement of high-efficiency servers and laptops.
APAC and Europe Sustainable IT Hardware Market
Asia-Pacific is the fastest-growing region at a 12.2% CAGR through 2031. India’s INR 170 billion (USD 2.04 billion) incentive for domestic server manufacturing and renewable-powered factories strengthens local supply chains. Japan’s Green Transformation League funds pilots to recycle rare-earth magnets, while South Korea’s K-Circular Economy Act sets mandatory recycled-content thresholds and tracks devices from sale to dismantling. Hyperscalers in Singapore and Indonesia deploy liquid-cooled AI clusters to manage tropical heat without evaporative cooling, sustaining sustainable IT hardware market share across Southeast Asia. Europe ranks second, boosted by the Ecodesign for Sustainable Products Regulation and grants to retrofit data centers with waste-heat recovery.
EMEA Sustainable IT Hardware Market
Germany budgets EUR 500 million (USD 560 million) for facilities that supply district-heating networks, driving demand for liquid-cooled racks with 60°C outlet temperatures that enable efficient heat reuse. The United Kingdom’s draft rules compel data centers above 500 kilowatts to publish monthly power-usage and water-usage metrics, accelerating metering upgrades. The Middle East builds AI-ready campuses in Saudi Arabia and the UAE as part of diversification agendas, with anchor tenants demanding renewable-energy purchase agreements and digital passports. Africa’s growth centers on South Africa, where Teraco’s 20-megawatt solar data center in Johannesburg sets a regional template for sustainable compute in markets with intermittent grids.

Competitive Landscape
The sustainable IT hardware market is moderately concentrated: Lenovo, HP, Dell Technologies, Hewlett Packard Enterprise, and Cisco dominate a significant portion of global revenue. These companies leverage their integrated supply chains to offer bundled solutions that combine high-efficiency hardware with advanced carbon analytics and certified disposal services. This approach not only enhances operational efficiency but also strengthens customer retention by addressing sustainability concerns. Additionally, there has been a notable increase in patent activity related to wide-bandgap power conversion and liquid-cooling technologies. This trend reflects the industry's shift toward energy-dense designs capable of meeting the growing demands of AI workloads while maintaining energy efficiency.
Leading firms are prioritizing innovations such as modular chassis, tool-less sleds, and digital product passports to meet recyclability standards and reduce downtime during maintenance or upgrades. These advancements are critical in ensuring that IT hardware aligns with sustainability goals without compromising performance. For instance, Dell has implemented a closed-loop aluminum sourcing strategy, while HP has introduced initiatives focused on utilizing ocean-bound plastics. These efforts not only reduce environmental impact but also serve as key differentiators in a competitive market. Similarly, Cisco has partnered with Vertiv to co-develop rack-scale cooling and power distribution solutions. This collaboration integrates optics, switching, and thermal management into a unified system, further enhancing efficiency and sustainability.
Emerging disruptors in the market are adopting software-defined infrastructure to disaggregate compute, storage, and networking into flexible resource pools managed by AI-driven workload engines. This approach enables more efficient resource utilization and scalability, addressing the dynamic needs of modern IT environments. NVIDIA, for example, has developed a network-plus-GPU stack that facilitates tightly coupled AI supernodes, significantly reducing data movement and associated energy consumption. Meanwhile, Pure Storage offers innovative flash-array subscriptions that include energy-efficiency guarantees and detailed sustainability dashboards. These offerings challenge traditional hybrid-disk arrays by providing superior operational cost savings and meeting environmental, social, and governance (ESG) metrics, positioning these disruptors as strong competitors in the market.
Sustainable IT Hardware Industry Leaders
Lenovo Group Limited
HP Inc.
Dell Technologies Inc.
Cisco Systems Inc.
International Business Machines Corporation
- *Disclaimer: Major Players sorted in no particular order
Sustainable IT Hardware Market Companies Covered in this Report
- Lenovo Group Limited
- HP Inc.
- Dell Technologies Inc.
- International Business Machines Corporation
- Cisco Systems Inc.
- Huawei Technologies Co., Ltd.
- Inspur Electronic Information Industry Co., Ltd.
- Super Micro Computer, Inc.
- Fujitsu Limited
- NEC Corporation
- Hewlett Packard Enterprise Company
- Schneider Electric SE
- Vertiv Holdings Co.
- Eaton Corporation plc
- Delta Electronics, Inc.
- Seagate Technology Holdings plc
- Western Digital Corporation
- Pure Storage, Inc.
- Advanced Micro Devices, Inc.
- NVIDIA Corporation

Recent Industry Developments in Sustainable IT Hardware Market
- March 2026: Dell Technologies announced a USD 1.2 billion liquid-cooling plant in Austin, Texas, slated to produce 50,000 units annually by Q4 2027, powered 60% by onsite solar.
- February 2026: NVIDIA and Supermicro partnered to deliver AI servers integrating NVIDIA Blackwell GPUs into Supermicro’s liquid-cooled 20-kilowatt racks, piloted across 12 hyperscale sites.
- January 2026: Schneider Electric completed the USD 285 million acquisition of Motivair Corporation, gaining rear-door heat-exchanger expertise for high-density AI deployments.
- December 2025: Hewlett Packard Enterprise launched the liquid-cooled HPE Cray EX255a supercomputer platform, cutting facility water consumption 40% versus evaporative systems.


Global Sustainable IT Hardware Market Report Scope
The Sustainable IT Hardware Market is the segment of the IT hardware industry focused on designing, manufacturing, and managing devices with reduced environmental impact throughout their lifecycle. It includes energy-efficient equipment, modular and repairable designs, and hardware built with recyclable or responsibly sourced materials. The market also encompasses circular practices such as refurbishment, reuse, and responsible disposal. It is driven by regulatory requirements, enterprise ESG goals, and the need to lower carbon footprint and e-waste.
The Sustainable IT Hardware Market Report is Segmented by Product Type (Servers, Storage Devices, Networking Equipment, Personal Computers and Workstations, Peripherals and Accessories, and UPS and Power Distribution Units), Component (Hardware, Software, and Services), End-User Industry (Data Centers, Large Enterprises, Small and Medium Enterprises, Government and Public Sector, Healthcare, BFSI, Telecom and IT, and Other End User Industries), Lifecycle Phase (Procurement and Manufacturing, Operation and Usage, Maintenance and Upgrades, and End-of-Life and Recycling), and Geography (North America, Europe, Asia-Pacific, Middle East, Africa, and South America). The Market Forecasts are Provided in Terms of Value (USD).
| Servers |
| Storage Devices |
| Networking Equipment |
| Personal Computers and Workstations |
| Peripherals and Accessories |
| UPS and Power Distribution Units |
| Hardware |
| Software |
| Services |
| Data Centers |
| Large Enterprises |
| Small and Medium Enterprises |
| Government and Public Sector |
| Healthcare |
| BFSI |
| Telecom and IT |
| Other End-User Industries |
| Procurement and Manufacturing |
| Operation and Usage |
| Maintenance and Upgrades |
| End-of-Life and Recycling |
| North America | United States |
| Canada | |
| Mexico | |
| Europe | Germany |
| United Kingdom | |
| France | |
| Russia | |
| Rest of Europe | |
| Asia-Pacific | China |
| Japan | |
| India | |
| South Korea | |
| Rest of Asia Pacific | |
| Middle East | Saudi Arabia |
| United Arab Emirates | |
| Rest of Middle East | |
| Africa | South Africa |
| Nigeria | |
| Rest of Africa | |
| South America | Brazil |
| Argentina | |
| Rest of South America |
| By Product Type | Servers | |
| Storage Devices | ||
| Networking Equipment | ||
| Personal Computers and Workstations | ||
| Peripherals and Accessories | ||
| UPS and Power Distribution Units | ||
| By Component | Hardware | |
| Software | ||
| Services | ||
| By End-User Industry | Data Centers | |
| Large Enterprises | ||
| Small and Medium Enterprises | ||
| Government and Public Sector | ||
| Healthcare | ||
| BFSI | ||
| Telecom and IT | ||
| Other End-User Industries | ||
| By Lifecycle Phase | Procurement and Manufacturing | |
| Operation and Usage | ||
| Maintenance and Upgrades | ||
| End-of-Life and Recycling | ||
| By Geography | North America | United States |
| Canada | ||
| Mexico | ||
| Europe | Germany | |
| United Kingdom | ||
| France | ||
| Russia | ||
| Rest of Europe | ||
| Asia-Pacific | China | |
| Japan | ||
| India | ||
| South Korea | ||
| Rest of Asia Pacific | ||
| Middle East | Saudi Arabia | |
| United Arab Emirates | ||
| Rest of Middle East | ||
| Africa | South Africa | |
| Nigeria | ||
| Rest of Africa | ||
| South America | Brazil | |
| Argentina | ||
| Rest of South America | ||


Key Questions Answered in the Report
What is the current value of the sustainable IT hardware market?
It stands at USD 25.32 billion in 2026 and is projected to reach USD 37.55 billion by 2031.
How fast is server spending growing within this space?
Servers are advancing at a 10.9% CAGR between 2026-2031, the fastest among product categories.
Which region is expanding most rapidly?
Asia-Pacific is forecast to grow at a 12.2% CAGR, fueled by manufacturing incentives and green data-center investments.
Why are services gaining traction?
Enterprises outsource asset recovery, carbon accounting and device-as-a-service contracts, driving a 9.4% CAGR for services through 2031.
How do liquid-cooled AI servers cut emissions?
They improve power density and thermal efficiency, enabling power-usage effectiveness below 1.20 and reducing facility electricity demand.
What regulations are shaping procurement?
The EU Ecodesign Regulation, U.S. SEC climate-disclosure rules and state-level recycled-content mandates are embedding ESG criteria into hardware purchasing.
Page last updated on:


 Your data is secure and never sold or shared.


