Static VAR Compensator Market Size and Share
Market Overview
| Study Period | 2019 - 2030 |
|---|---|
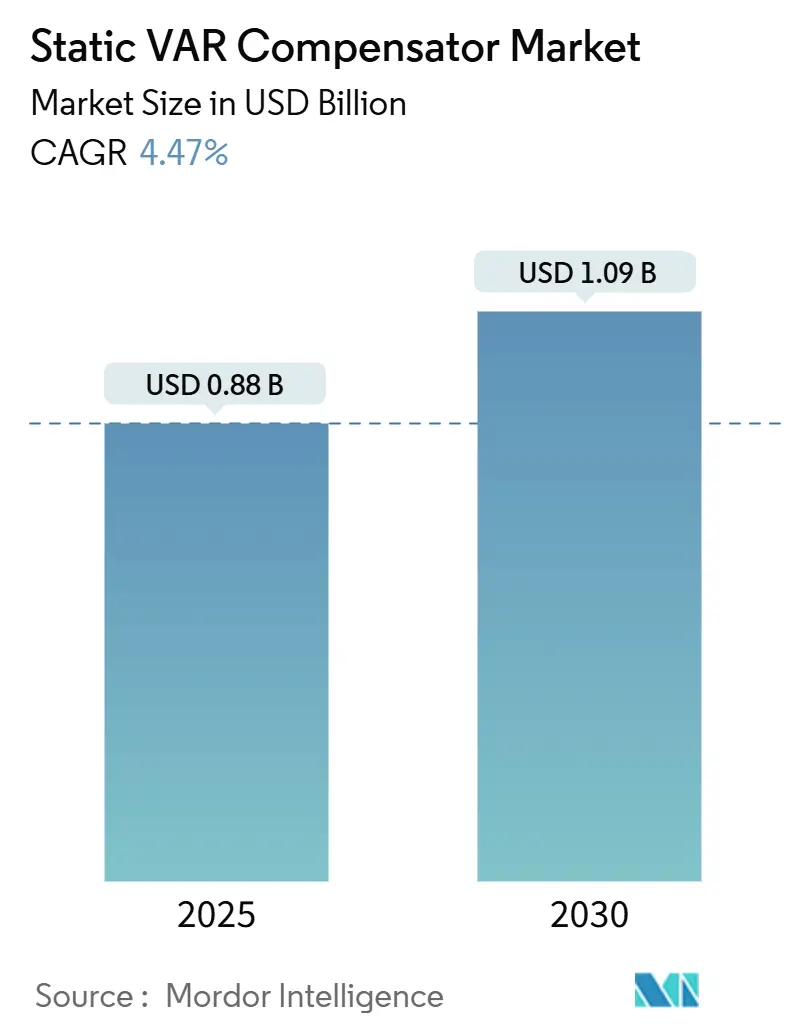
| Market Size (2025) | USD 0.88 Billion |
| Market Size (2030) | USD 1.09 Billion |
| Growth Rate (2025 - 2030) | 4.47% CAGR |
| Fastest Growing Market | Asia Pacific |
| Largest Market | Asia Pacific |
| Market Concentration | Medium |
Major Players *Disclaimer: Major Players sorted in no particular order Image © Mordor Intelligence. Reuse requires attribution under CC BY 4.0. | |
Static VAR Compensator Market Analysis by Mordor Intelligence
Static VAR compensator market size reached USD 0.88 billion in 2025 and will expand to USD 1.09 billion by 2030, reflecting a 4.47% CAGR. Investment is shifting from rapid capacity additions to grid-stability projects as utilities contend with variable renewable generation, aging transmission assets, and stricter power-quality codes. Growing preference for hybrid SVC-STATCOM solutions illustrates how the Static VAR compensator market now values both cost efficiency and rapid dynamic response. Manufacturers gain a margin by integrating digital control, predictive maintenance analytics, and remote diagnostics —features that shorten outage durations and increase asset utilization. Meanwhile, policy incentives for renewable energy encourage end users to adopt sophisticated reactive-power equipment that can stabilize voltage during output fluctuations, thereby sustaining a predictable demand pipeline for suppliers.
Key Report Takeaways
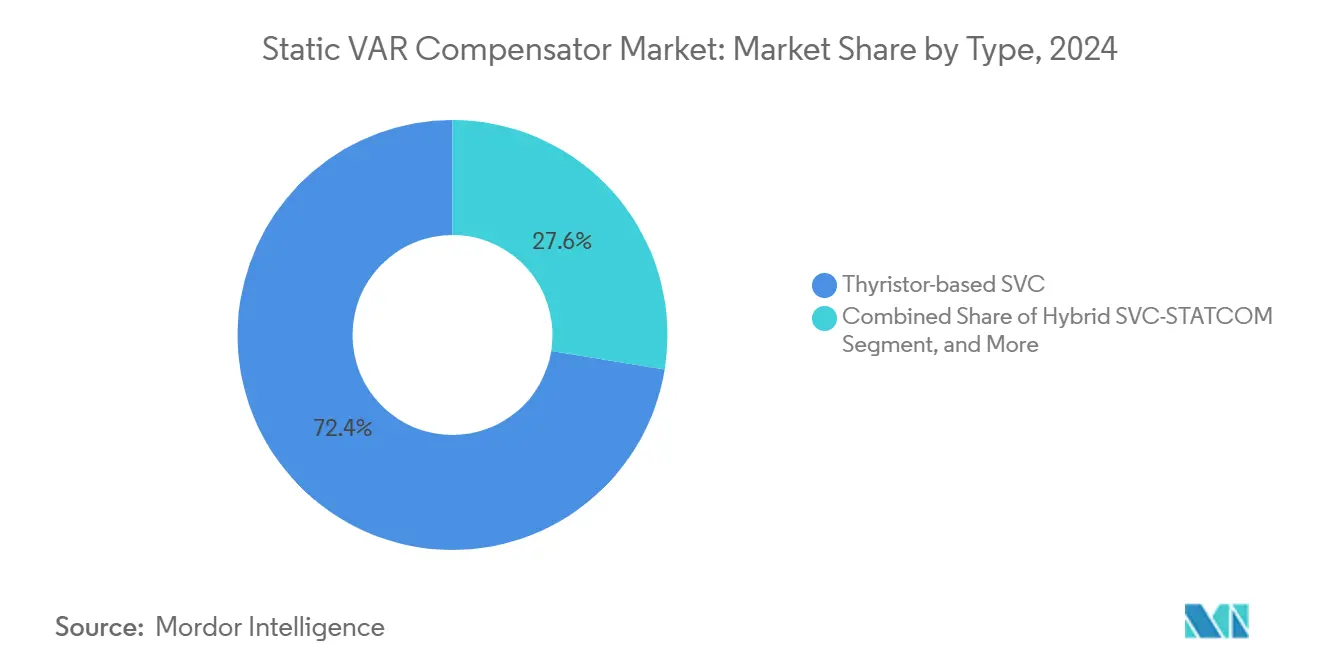
- By type, thyristor-based SVC systems led with 72.43% revenue share in 2024, while hybrid SVC-STATCOM solutions are projected to grow at a 5.78% CAGR through 2030.
- By voltage rating, installations above 69 kV accounted for 44.89% of the Static VAR compensator market size in 2024 and are expected to advance at a 5.89% CAGR to 2030.
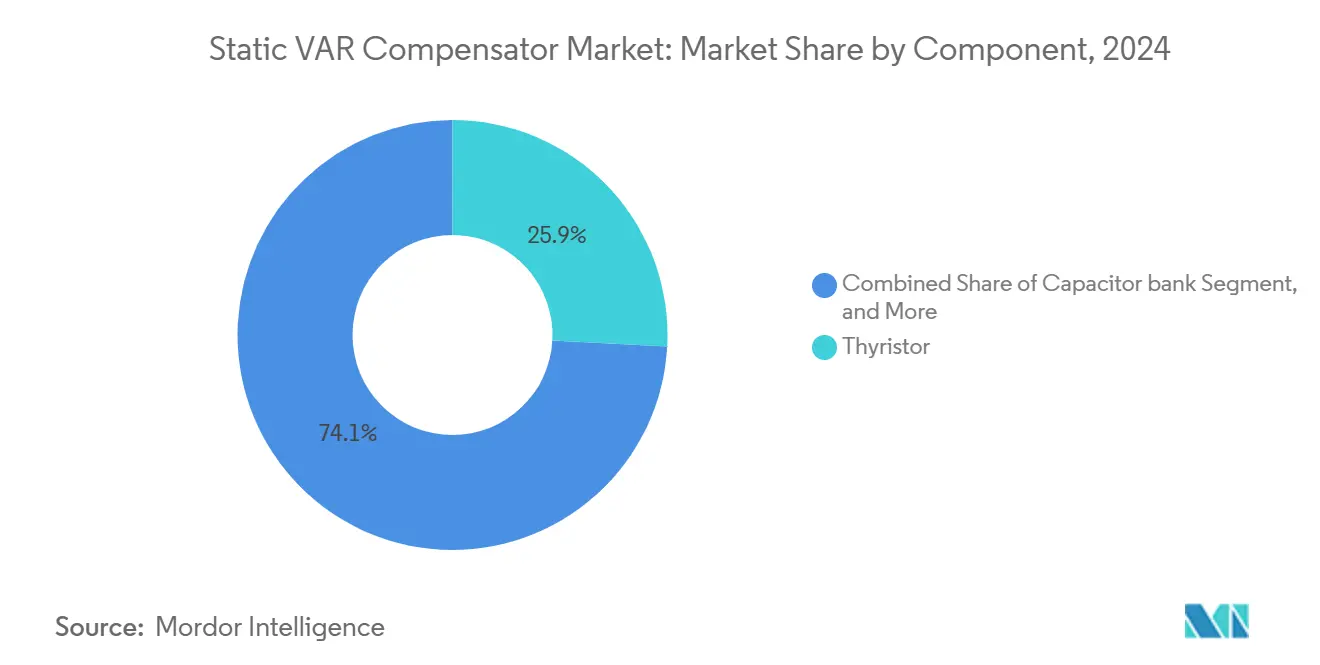
- By component, thyristor packages held a 25.86% share in 2024, whereas GIS switchgear is poised for the fastest growth of 4.76% CAGR over the forecast period.
- By end-use industry, electric utilities dominated with a 65.78% market share in 2024, while railways and electric traction applications are expected to register the highest 4.68% CAGR through 2030.
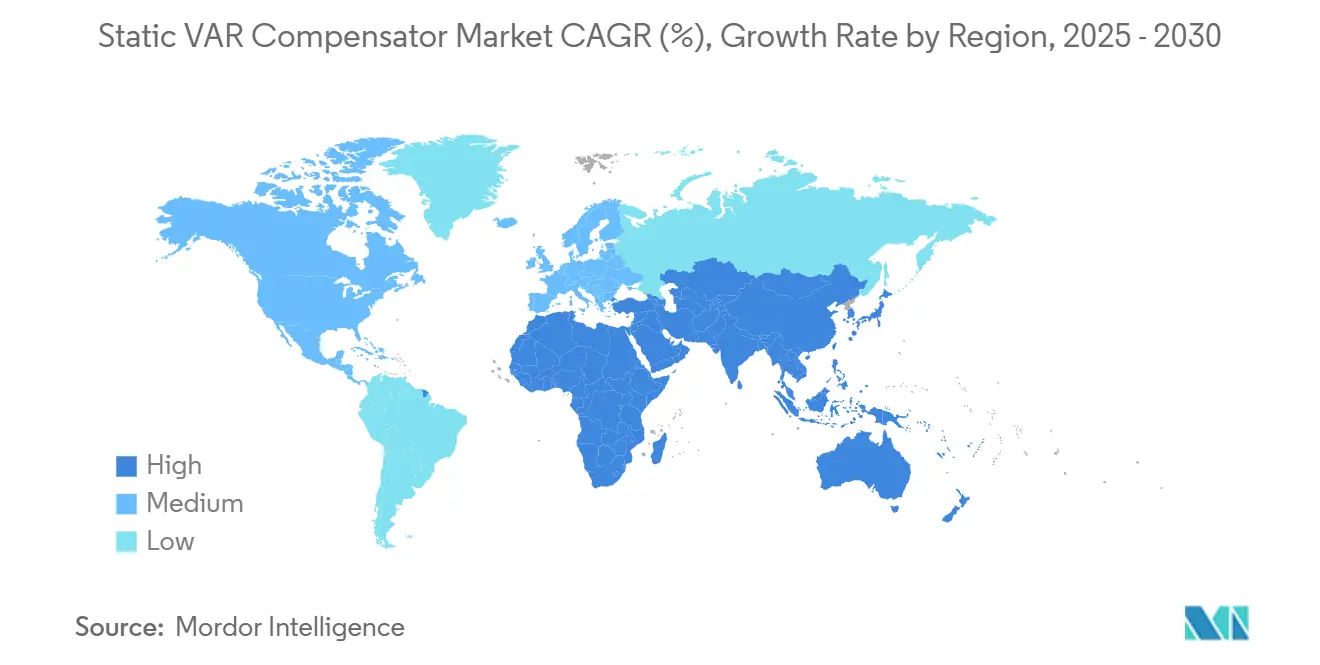
- By geography, Asia-Pacific captured 34.52% of global revenue in 2024 and is forecast to record the strongest regional growth at a 4.98% CAGR to 2030.
Global Static VAR Compensator Market Trends and Insights
Drivers Impact Analysis*
| Driver | (~) % Impact on CAGR Forecast | Geographic Relevance | Impact Timeline |
|---|---|---|---|
| Rising renewable-energy grid integration | +1.8% | Global, with concentration in Asia-Pacific and Europe | Medium term (2-4 years) |
| Transmission and distribution network modernization | +1.2% | Global, spill-over from developed to emerging markets | Long term (≥ 4 years) |
| Industrial demand for power-quality enhancement | +0.9% | Asia-Pacific core, North America manufacturing belt | Short term (≤ 2 years) |
| Expansion of datacenters and hyperscale ICT campuses | +0.7% | North America, Europe, Asia-Pacific urban centers | Medium term (2-4 years) |
| Build-out of ultra-fast EV charging corridors | +0.5% | Europe, North America, China leading adoption | Medium term (2-4 years) |
| AI-enabled digital control and remote diagnostics | +0.4% | Global, technology-advanced markets first | Long term (≥ 4 years) |
| Source: Mordor Intelligence | |||
Rising Renewable-Energy Grid Integration
Utilities deploying wind and solar energy must compensate for fluctuating reactive power needs as synchronous generators retire. TransnetBW’s Enhanced STATCOM stations illustrate how advanced SVC technology stabilizes 380 kV corridors that serve 11 million consumers. [1]Hitachi Energy, “Hitachi Energy and TransnetBW make German grid fit for future,” hitachienergy.com Static VAR compensator market participants now bundle voltage ride-through, frequency support, and harmonic filtering into a single enclosure, reducing site engineering time. Grid codes in Europe, India, and parts of the United States are increasingly requiring dynamic support devices at utility-scale renewable plants, thereby anchoring a pipeline of retrofit opportunities. Because penetration above 30% renewable share heightens the risk of voltage oscillation, grid operators schedule multiyear procurement rounds that provide suppliers with predictable volume visibility. As hydrogen-ready power parks and offshore wind hubs come online after 2026, they will drive additional demand for modular hybrid SVC-STATCOM units.
Transmission and Distribution Network Modernization
Aging conductors, heavier urban loads, and bidirectional power flows spur utilities to modernize substations with flexible AC transmission devices. Static VAR compensator market projects frequently bundle line reactors, phase-shifting transformers, and SVCs to defer costly corridor expansions, a benefit that regulators reward in rate cases. Advanced digital controls enable operators to monitor reactive reserves in real-time, reducing the number of dispatchable peaking plants required for voltage support. In the Philippines and Vietnam, multiyear grid reinforcement programs specify modular skid-mounted SVCs that can be redeployed as load centers shift. North American utilities pair SVC retrofits with breaker-and-a-half bay upgrades, thereby lifting transfer capability across key 230 kV and 500 kV interfaces. Over the forecast period, the Static VAR compensator market will remain closely tied to large-scale reconductoring, series compensation, and grid automation budgets.
Industrial Demand for Power-Quality Enhancement
Arc-furnace steel plants, copper mines, and semiconductor fabs all suffer productivity losses when voltage flicker, phase imbalance, or sag exceeds equipment tolerance. SVC retrofits at steel mills in Europe have reduced electrode wear by 15% and boosted melt-shop throughput. [2]T&D World Staff, “GE Vernova Collaborates with TECO to Enhance Taiwan's Power Grid,” tdworld.com Static VAR compensator market suppliers now promote containerized “industry power-quality” packages that integrate harmonic filters, thyristor-controlled reactors, and fast-response VSC modules. Because production downtime can cost USD 0.5 million per hour at large chip fabs, payback periods often fall below 2 years, supporting CFO approval even in tight capital cycles. Asia-Pacific manufacturers view power-quality upgrades as ESG investments because they cut grid losses and CO₂ per ton of output. In Latin America, mining operators on weak grids deploy SVCs to stabilize shovel and crusher loads, reducing relay trips that halt ore flow.
Expansion of Datacenters and Hyperscale ICT Campuses
Each 100 MW hyperscale facility absorbs sudden load ramps when AI clusters spin up, straining distribution feeders. The static VAR compensator market demand emerges at the sub-transmission level, where operators must uphold IEEE 519 harmonic limits. Leading cloud providers embed ±150 Mvar SVC designs into their technical specifications to ensure power-factor penalties remain below utility thresholds. Because land constraints favor multi-story server halls, operators want compact GIS-based SVC yards that minimize footprint. Remote diagnostic suites enable campus engineers to monitor the harmonic spectrum and reactive demand, aligning with uptime service-level agreements. As 400 Gbps optical interconnects drive higher rack densities through 2027, dynamic voltage support becomes mandatory, elevating SVC penetration into the ICT segment.
Restraints Impact Analysis*
| Restraint | (~) % Impact on CAGR Forecast | Geographic Relevance | Impact Timeline |
|---|---|---|---|
| High upfront capital expenditure | -0.8% | Global, particularly emerging markets | Short term (≤ 2 years) |
| Competition from STATCOM and synchronous condensers | -0.6% | Developed markets with advanced grid infrastructure | Medium term (2-4 years) |
| Supply-chain volatility in power-semiconductor devices | -0.4% | Global, concentrated impact in Asia-Pacific manufacturing | Short term (≤ 2 years) |
| Shortage of skilled O&M personnel for advanced FACTS | -0.3% | Emerging markets, rural grid applications | Long term (≥ 4 years) |
| Source: Mordor Intelligence | |||
High Upfront Capital Expenditure
Turnkey utility-scale SVC projects, including civil works and protection relays, range from USD 50,000 to USD 8 million, a hurdle for smaller distribution companies. When installations consume up to 20% of a substation budget, boards often delay approval until voltage instability threatens regulatory fines. Financing becomes more challenging in emerging economies, where currency volatility increases the cost of imported equipment. Vendors now market leasing and performance-contract models to spread capital pain, yet underwriting risk remains high for first-loss financiers. Multilateral development banks partially fill gaps, but slow procurement cycles still postpone deployments, trimming near-term growth in the Static VAR compensator market.
Competition from STATCOM and Synchronous Condensers
Full STATCOMs offer sub-5 millisecond response times and superior low-voltage ride-through capabilities, features prized as inverter-based resources proliferate. Component cost declines and modular factory assembly close the historical price gap, eroding SVC’s value proposition in high-performance niches. Meanwhile, synchronous condensers regain favor for inertia contribution, especially on islanded grids. Grid planners in Australia and the United Kingdom now model combinations of STATCOM plus rotating machines, sidelining new SVC orders in some tenders. [3]IEEE Conference Publication, “Design and Implementation of a 12-Pulse TCR-Based SVC for Voltage Regulation,” ieeexplore.ieee.org As a result, the Static VAR compensator market growth could decelerate in mature regions unless hybrid offerings sustain a compelling cost-to-performance ratio.
*Our forecasts treat driver/restraint impacts as directional, not additive. The impact forecasts reflect baseline growth, mix effects, and variable interactions.
Segment Analysis
By Type: Hybrid Solutions Challenge Thyristor Dominance
Thyristor-based installations accounted for 72.43 of % Static VAR compensator market share in 2024, underpinned by three decades of proven field reliability. Hybrid SVC-STATCOM solutions, however, will register a 5.78% CAGR because they merge the cost advantage of phase-controlled reactors with the fast transients of voltage-source converters. In the Asia-Pacific region, tender documents are increasingly specifying hybrid architectures for 220 kV nodes that tie wind clusters to backbone grids. Suppliers tout 30% lower capex than pure STATCOM while meeting the same flicker and harmonic limits.
Utility engineers cite smoother dynamic response and smaller filter footprint as reasons to retire legacy thyristor banks in favor of hybrid retrofits. Factory-built power-electronic cartridges allow step-wise upgrades, extending asset life. Manufacturers also integrate digital twins for predictive health scoring, lowering unplanned outages. These features keep the Static VAR compensator market attractive even against standalone STATCOM bids.


By Voltage Rating: High-Voltage Dominance Reflects Transmission Focus
Systems rated above 69 kV accounted for 44.89% of the Static VAR compensator market size in 2024 and are expected to lead growth with a 5.89% CAGR, driven by transmission reinforcement plans in China, India, and the Middle East. Bulk corridors can gain up to 10% additional power-transfer capacity when dynamic compensation stabilizes voltage under contingency, thereby delaying the need for expensive new lines.
Medium-voltage packages serve industrial campuses and suburban substations but face growing competition from distributed inverters with embedded VAR support. Low-voltage products cater to high-tech manufacturing and naval shipyards, where sensitive loads require precise voltage regulation. Vendors leverage common component platforms across voltage classes, achieving scale economies and ensuring the Static VAR compensator market retains healthy margins despite regional price pressure.
By Component: GIS Switchgear Emerges as Growth Leader
Thyristors accounted for 25.86% of the revenue in 2024, yet GIS switchgear is expected to grow the fastest at a 4.76% CAGR, as sealed SF₆-free designs reduce maintenance intervals and mitigate weather-related failures. Integrated current-sensing lets operators detect harmonic flow without auxiliary CTs, trimming installation time.
Power-electronic device assemblies benefit from wide-bandgap semiconductors that increase switching frequency, thereby reducing filter size. Meanwhile, reactor and capacitor suppliers innovate with advanced epoxy impregnation to achieve higher thermal limits, thereby extending service life. The shift toward smart protection relays and IEC 61850 networking opens up service revenue streams, sustaining overall profitability within the Static VAR compensator market.
By End-Use Industry: Railways Drive Application Diversification
Electric utilities controlled 65.78% of revenue in 2024, consistent with their statutory mandate to maintain voltage stability. Railways and electric traction will log a 4.68% CAGR as high-speed networks in India, Spain, and Egypt demand rapid VAR support when regenerative braking dumps power back to the grid. Chinese OEMs already offer turnkey ±25 kV traction SVC skids integrating three-phase balancing and flicker suppression.
Renewable power plants utilize SVCs to meet grid-code ride-through requirements, while steelmakers reduce electrode costs and extend transformer life. Data-center operators specify 0.99 lag-lead power factor clauses that effectively require dynamic compensation, opening a new revenue seam. Collectively, these trends widen the addressable Static VAR compensator market beyond its historic utility core.
Geography Analysis
The Asia-Pacific region commanded a 34.52% share in 2024 and is expected to compound at a 4.98% rate through 2030, supported by China’s USD 20 billion annual transmission budget and India’s green corridor programs. Chinese firms benefit from scale, shipping modular SVC bays priced 15% below European averages yet meeting the same IEC-61000 harmonic standards. State Grid projects alone consumed more than 2,500 MVAr during 2024 upgrades, sustaining domestic order books.
North America primarily adds SVCs to integrate 30 GW of annual wind and solar installations. U.S. transmission developers include ±200 MVAR banks in corridor-upgrade filings to satisfy NERC voltage stability criteria. Canada retrofits 500 kV Pacific intertie nodes to improve cross-border energy trade. Europe pursues hybrid SVC-STATCOM at 400 kV substations to unlock offshore wind, with Germany’s TransnetBW contract exemplifying the trend. Tight space constraints and SF₆ phase-out policies push the region toward GIS-based designs.
The Middle East and Africa invest in stabilizing remote mining microgrids and desalination plants prone to motor-starting transients. Gulf utilities utilize air-conditioned enclosures rated for 55 °C ambient temperatures, ensuring optimal performance under desert conditions. South America lags due to fiscal austerity, but pockets of growth appear where solar and copper mining converge in Chile and Peru. Collectively, regional diversification secures multi-channel growth for the Static VAR compensator market even as individual geographies cycle through capex peaks.

Competitive Landscape
The Static VAR compensator market is moderately concentrated. Five global players-Hitachi Energy, GE Vernova, Siemens Energy, NR Electric, and NARI Technology-command more than 70% of annual revenue through bundled FACTS portfolios and EPC capabilities. Vendors differentiate via hybrid topologies, digital twin integration, and turnkey financing packages. Hitachi Energy’s SVC Light Enhanced combines supercapacitors for active power injection, winning German tenders. GE Vernova co-locates SVC manufacturing with HVDC valve assembly in Chennai, cutting lead time for Indian bids.
Chinese suppliers scale aggressively, leveraging domestic projects to refine modular cabinets that meet IEC and IEEE certifications, then targeting export markets in Africa and Latin America. Western incumbents counter by offering 20-year service agreements with remote diagnostic centers that guarantee 99% availability. Component specialists like Merus Power and American Superconductor carve niches in industrial retrofits, supplying compact racks for 60 kV steel-mill feeders.
Flexible HVDC corridors pose a threat to standalone SVC orders at converter nodes because VSC-HVDC stations inherently regulate voltage. Suppliers respond by bundling SVCs with STATCOM and static synchronous series compensators, presenting utilities with a unified voltage-control platform. Continuous standards engagement within IEEE and CIGRÉ helps market leaders shape grid-code language that aligns with hybrid solutions, reinforcing their edge.
Static VAR Compensator Industry Leaders
ABB Ltd.
Hitachi Energy Ltd.
Siemens Energy AG
General Electric Company
Mitsubishi Electric Corporation
- *Disclaimer: Major Players sorted in no particular order

Recent Industry Developments
- March 2025: Multiple utility-scale SVC installations commenced across India's transmission network as part of the country's grid modernization program, with systems designed to support renewable energy integration targets and improve power quality for industrial loads in manufacturing corridors.
- February 2025: Advanced hybrid SVC-STATCOM systems entered commercial operation in European transmission networks, demonstrating enhanced response times under 5 milliseconds and improved harmonic performance compared to traditional thyristor-based systems.
- January 2025: Chinese manufacturers expanded SVC production capacity to meet growing domestic demand, with multiple facilities increasing output of digital control systems and modular SVC architectures for both domestic and export markets.
- January 2025: Railway electrification projects in Asia-Pacific deployed specialized SVC systems for traction power quality management, addressing voltage fluctuation challenges from regenerative braking systems and variable load conditions in high-speed rail applications.


Global Static VAR Compensator Market Report Scope
| Thyristor-based SVC |
| Magnetically Controlled Reactor (MCR)-based SVC |
| Hybrid SVC-STATCOM |
| Low Voltage (≤1 kV) |
| Medium Voltage (1–69 kV) |
| High Voltage (>69 kV) |
| Thyristor |
| Power-electronic device packages |
| Reactor |
| Capacitor bank |
| Harmonic filter |
| GIS switchgear |
| Control and protection system |
| Other Component |
| Electric utilities |
| Renewable power plants (wind / solar) |
| Railways and electric traction |
| Steel and metal processing |
| Mining and minerals |
| Oil and gas facilities |
| Datacenters and ICT |
| Other End-use Industry |
| North America | United States | |
| Canada | ||
| Mexico | ||
| Europe | Germany | |
| United Kingdom | ||
| France | ||
| Russia | ||
| Rest of Europe | ||
| Asia-Pacific | China | |
| Japan | ||
| India | ||
| South Korea | ||
| Australia | ||
| Rest of Asia-Pacific | ||
| Middle East and Africa | Middle East | Saudi Arabia |
| United Arab Emirates | ||
| Rest of Middle East | ||
| Africa | South Africa | |
| Egypt | ||
| Rest of Africa | ||
| South America | Brazil | |
| Argentina | ||
| Rest of South America | ||
| By Type | Thyristor-based SVC | ||
| Magnetically Controlled Reactor (MCR)-based SVC | |||
| Hybrid SVC-STATCOM | |||
| By Voltage Rating | Low Voltage (≤1 kV) | ||
| Medium Voltage (1–69 kV) | |||
| High Voltage (>69 kV) | |||
| By Component | Thyristor | ||
| Power-electronic device packages | |||
| Reactor | |||
| Capacitor bank | |||
| Harmonic filter | |||
| GIS switchgear | |||
| Control and protection system | |||
| Other Component | |||
| By End-use Industry | Electric utilities | ||
| Renewable power plants (wind / solar) | |||
| Railways and electric traction | |||
| Steel and metal processing | |||
| Mining and minerals | |||
| Oil and gas facilities | |||
| Datacenters and ICT | |||
| Other End-use Industry | |||
| By Geography | North America | United States | |
| Canada | |||
| Mexico | |||
| Europe | Germany | ||
| United Kingdom | |||
| France | |||
| Russia | |||
| Rest of Europe | |||
| Asia-Pacific | China | ||
| Japan | |||
| India | |||
| South Korea | |||
| Australia | |||
| Rest of Asia-Pacific | |||
| Middle East and Africa | Middle East | Saudi Arabia | |
| United Arab Emirates | |||
| Rest of Middle East | |||
| Africa | South Africa | ||
| Egypt | |||
| Rest of Africa | |||
| South America | Brazil | ||
| Argentina | |||
| Rest of South America | |||


Key Questions Answered in the Report
How large is the global Static VAR compensator market in 2025?
Market value reached USD 0.88 billion in 2025 and is forecast to hit USD 1.09 billion by 2030.
Which region generates the most demand?
Asia-Pacific contributes 34.52% of global revenue and also shows the fastest 4.98% CAGR through 2030.
What application will grow the quickest?
Railways and electric traction post a 4.68% CAGR thanks to rapid electrification of high-speed lines and metros.
Why are hybrid SVC-STATCOM systems gaining traction?
They blend the cost advantage of thyristor banks with the fast dynamic response of voltage-source converters, meeting new grid-code requirements.
How does high voltage adoption affect growth?
Installations above 69 kV lead expansion at 5.89% CAGR because transmission upgrades rely on bulk VAR support.
What is the main restraint facing new projects?
What is the main restraint facing new projects?
Page last updated on:


