Market Overview
| Study Period | 2021 - 2031 |
|---|---|
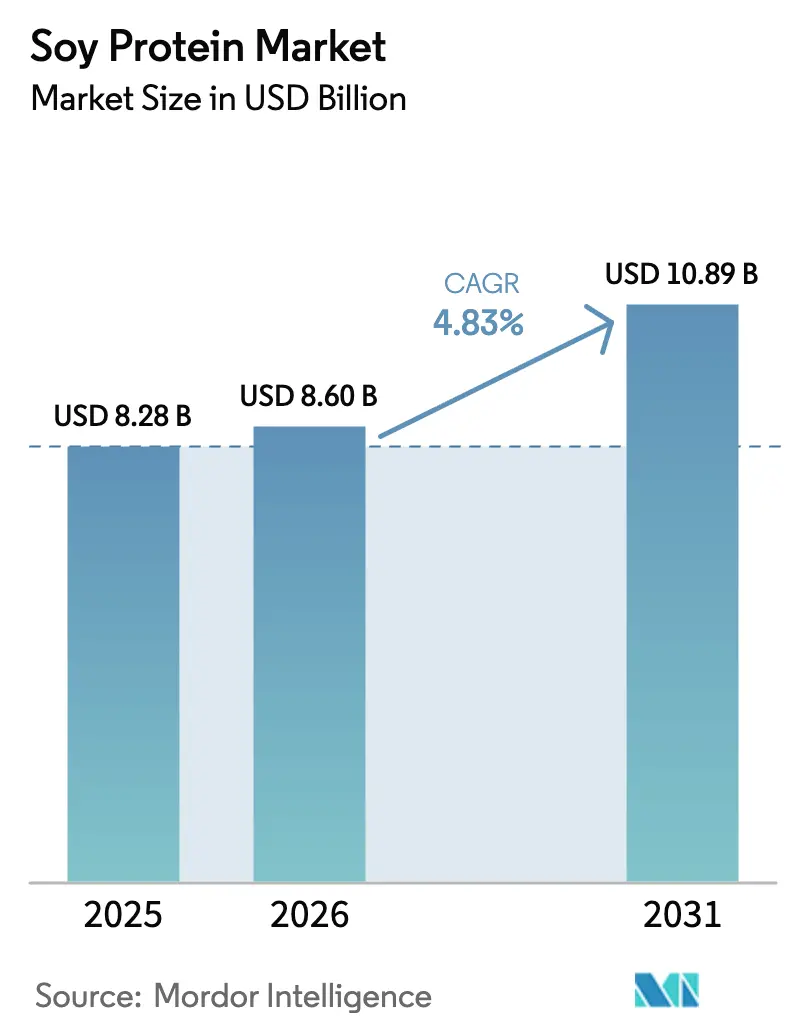
| Market Size (2026) | USD 8.60 Billion |
| Market Size (2031) | USD 10.89 Billion |
| Growth Rate (2026 - 2031) | 4.83% CAGR |
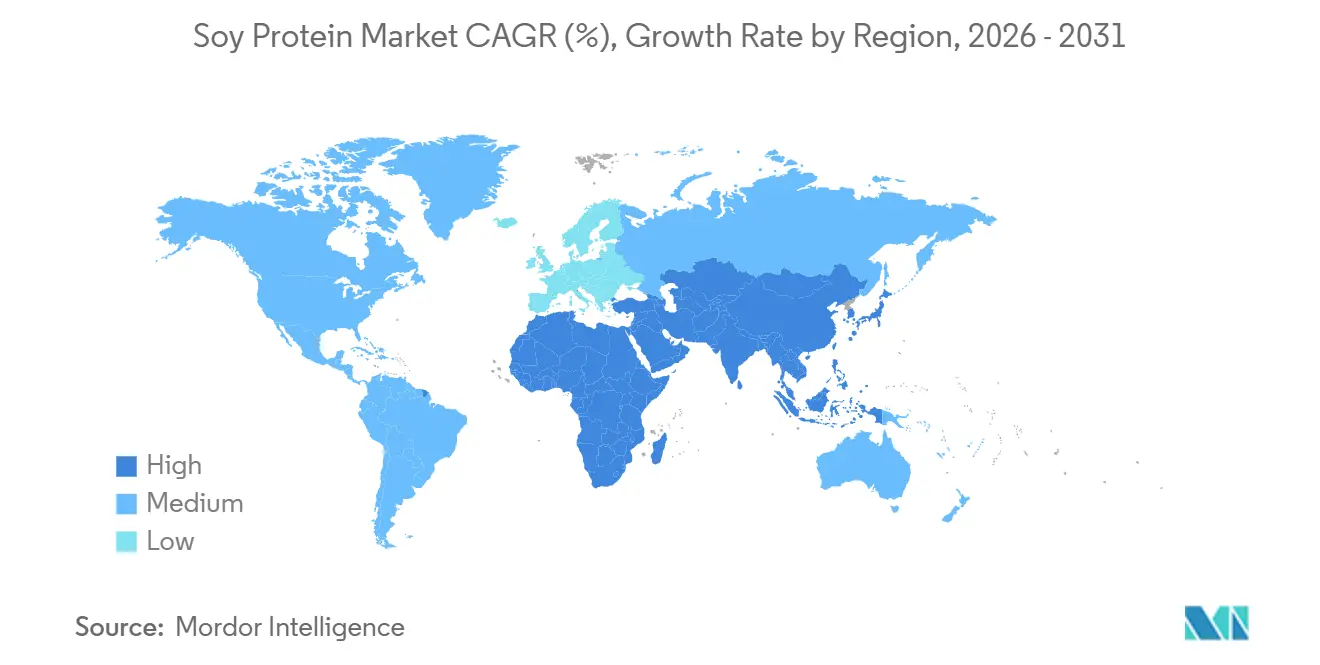
| Fastest Growing Market | Asia Pacific |
| Largest Market | North America |
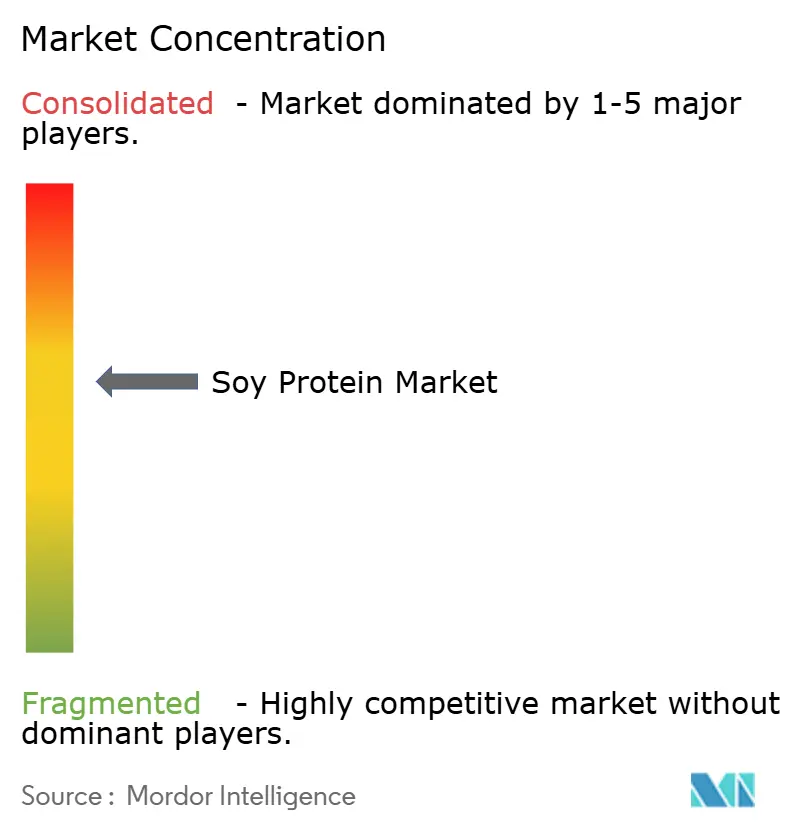
| Market Concentration | Medium |
Major Players *Disclaimer: Major Players sorted in no particular order Image © Mordor Intelligence. Reuse requires attribution under CC BY 4.0. | |
Soy Protein Market Analysis by Mordor Intelligence
The soy protein market size was valued at USD 8.28 billion in 2025 and is estimated to grow from USD 8.60 billion in 2026 to reach USD 10.89 billion by 2031, at a CAGR of 4.83% during the forecast period (2026-2031). This growth is driven by consistent demand for plant-based nutrition, clean-label requirements from retailers, and the cost advantage of soy compared to emerging protein sources. Soy protein isolates maintained their position as the volume leader due to their 90% protein purity, neutral flavor, and versatile functionality, enabling formulators to achieve protein targets with minimal impact on texture. Hydrolyzed soy protein is experiencing the fastest growth, driven by demand from sports nutrition and medical brands seeking rapid-absorption peptides. Regionally, North America accounts for one-third of global demand, supported by its vertically integrated crushing capacity, while the Asia-Pacific region leads in volume growth, driven by fortification programs in China and India.
Key Report Takeaways
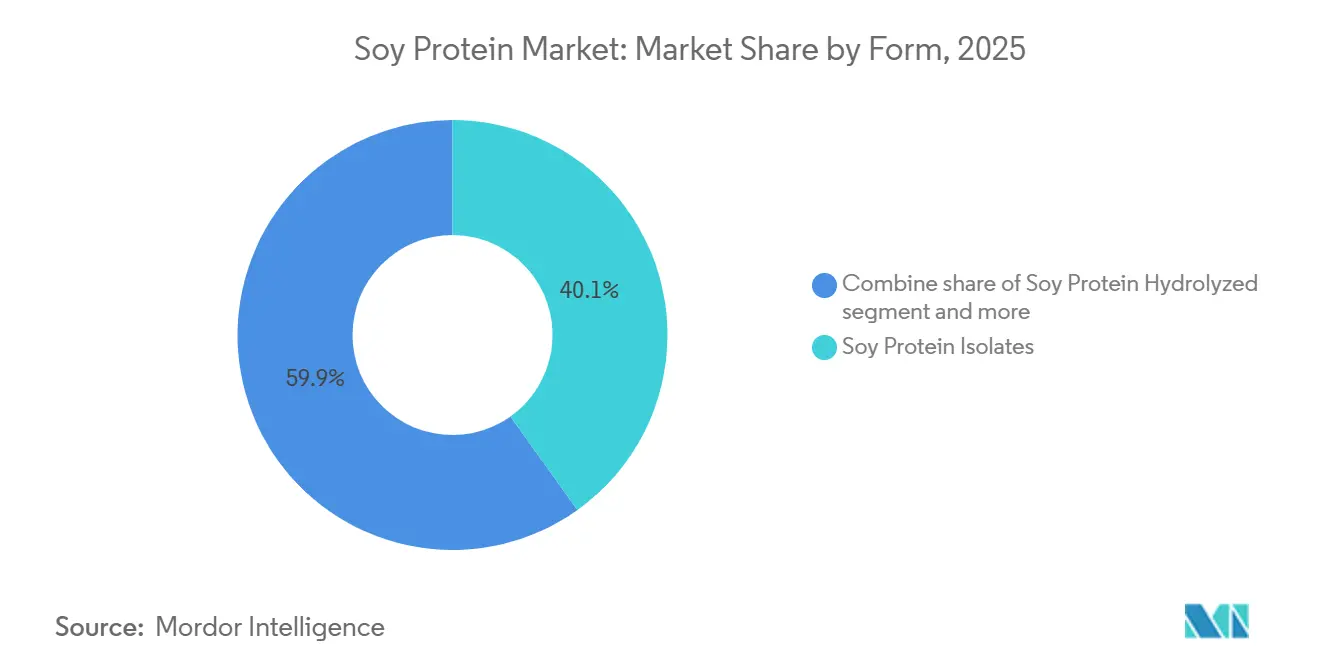
- By form, soy protein isolates are expected to account for 40.13% of the soy protein market share in 2025, while hydrolyzed soy protein is projected to grow at a CAGR of 6.04% through 2031.
- By category, conventional grades are anticipated to represent 79.34% of the soy protein market size in 2025, whereas organic grades are forecast to grow at a CAGR of 5.74% between 2026 and 2031.
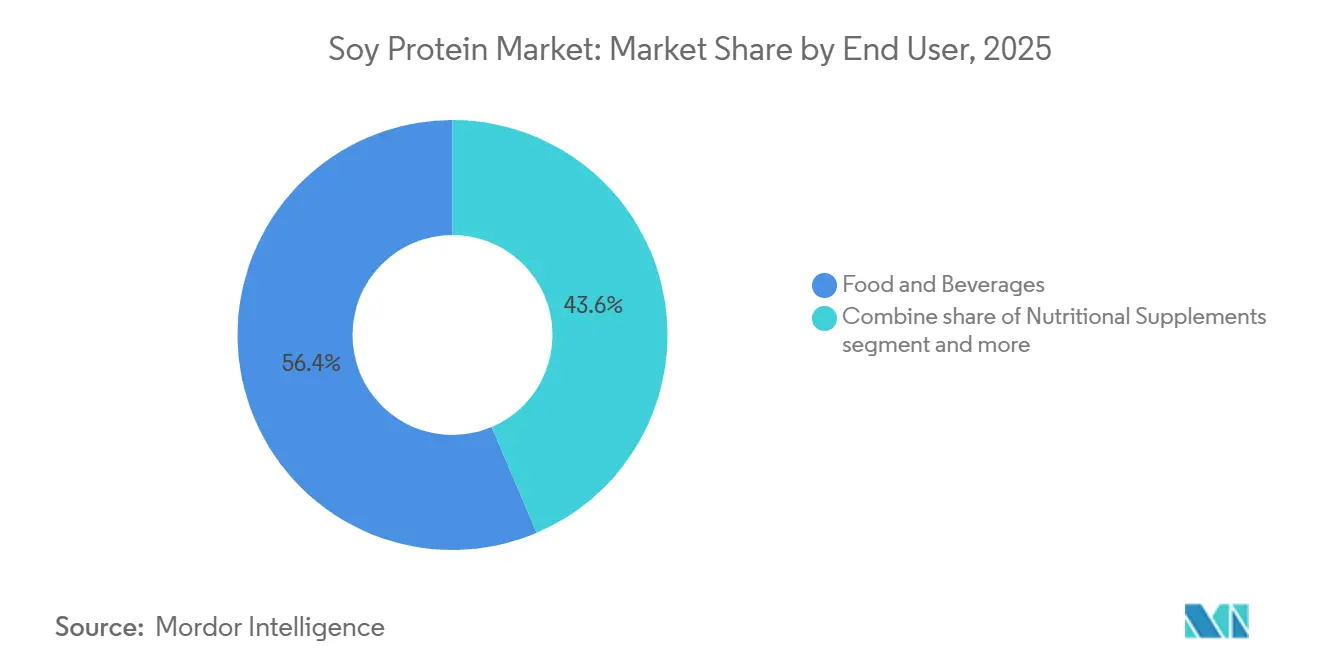
- By end user, the food and beverages segment is projected to account for 56.41% of the 2025 volume, while nutritional supplements are expected to achieve the highest CAGR of 5.54% through 2031.
- By geography, North America is estimated to capture 33.43% of the 2025 revenue, with the Asia-Pacific region forecast to grow at a CAGR of 5.44% through 2031.
Note: Market size and forecast figures in this report are generated using Mordor Intelligence’s proprietary estimation framework, updated with the latest available data and insights as of January 2026.
Global Soy Protein Market Trends and Insights
Drivers Impact Analysis*
| Driver | (~)% Impact on CAGR Forecast | Geographic Relevance | Impact Timeline |
|---|---|---|---|
| Consumer shift toward vegan and vegetarian diets boosts soy protein adoption in meat substitutes | +1.2% | Global, with concentration in North America, Europe, and urban Asia-Pacific | Medium term (2-4 years) |
| Surge in plant-based protein demand for snacks, beverages, and ready-to-drink products | +0.9% | North America, Europe, Asia-Pacific urban centers | Short term (≤ 2 years) |
| Rising popularity of clean-label and non-GMO ingredients favors soy over animal proteins | +0.7% | North America, Europe, Australia | Medium term (2-4 years) |
| Expansion of sports nutrition and high-protein supplements incorporates soy | +0.6% | Global, led by North America and Europe | Medium term (2-4 years) |
| Growing use in infant nutrition and dairy alternatives due to complete amino acid profile | +0.8% | Asia-Pacific, North America, Europe | Long term (≥ 4 years) |
| Pet food industry adoption of soy-based proteins for sustainable nutrition solutions | +0.4% | North America, Europe, emerging in Asia-Pacific | Long term (≥ 4 years) |
| Source: Mordor Intelligence | |||


Consumer shift toward vegan and vegetarian diets boosts soy protein adoption in meat substitutes
Flexitarian and reducetarian movements are shaping protein consumption trends, with 30% of United States consumers projected to identify as flexitarian in 2025, up from 23% in 2023, according to the International Food Information Council. Flexitarians focus on reducing meat consumption occasionally rather than eliminating it entirely, which is driving consistent demand for hybrid products that combine soy protein isolates with animal proteins to lower costs and reduce environmental impact. Soy's functional properties, such as emulsification, water binding, and texture formation, make it a critical ingredient in extruded meat analogs and restructured poultry products. Companies like Tyson Foods and Perdue Farms have introduced blended product lines containing 20 to 40 percent soy protein concentrate, targeting mainstream grocery channels where achieving price parity with traditional meat is essential. Regulatory frameworks, such as the United States Food and Drug Administration's (FDA) Generally Recognized as Safe (GRAS) status for soy protein isolates, support rapid formulation cycles, enabling brands to refine texture and flavor without lengthy approval processes [1]Source: U.S. Food & Drug Administration, “Frequently Asked Questions: Food Allergen Labeling Guidance for Industry,” fda.gov.
Surge in plant-based protein demand for snacks, beverages, and ready-to-drink products
Ready-to-drink (RTD) protein beverages containing soy isolates saw significant growth in unit sales across North America and Europe in 2025. This increase was primarily driven by the rising trend of on-the-go consumption and the growing preference for clean-label products. Soy protein isolates, which provide 90% protein content by dry weight, allow manufacturers to deliver 20-30 grams of protein per 330-milliliter serving without causing excessive thickness or an unpleasant chalky texture. To address long-standing consumer concerns about the flavor profile of soy, companies are using enzymatic hydrolysis, a process that breaks down proteins into shorter peptide chains, enhancing solubility and reducing bitterness. In the snack category, extruded soy crisps and protein bars made with soy protein concentrate represented 14% of the high-protein snack segment in 2025. These products are particularly popular among health-conscious millennials and Generation Z consumers who value macronutrient density over traditional indulgent snacks. The combination of convenience and nutrition is especially evident in the Asia-Pacific region, where urbanization and increasing disposable incomes are fueling demand for portable protein options. In China, the ready-to-drink protein beverage market is expanding at an annual growth rate of 18% through 2025.
Rising popularity of clean-label and non-GMO ingredients favors soy over animal proteins
Non-GMO Project Verified soy protein ingredients have experienced notable growth in North America, driven by consumer willingness to pay premiums for identity-preserved soybeans and transparent supply chains. This trend is shaping procurement strategies, with brands such as Clif Bar and Orgain mandating the use of non-GMO soy protein isolates across their product lines to align with clean-label positioning. In the European Union, strict GMO labeling requirements under Regulation (EC) No 1829/2003 compel importers to source certified non-GMO soy, resulting in tighter supply and a price increase compared to conventional grades. Additionally, organic soy protein is growing at a steady rate, supported by retailers like Whole Foods Market and Sprouts Farmers Market expanding shelf space for USDA Organic-certified plant proteins. Organic certification, which requires a land transition period and prohibits the use of synthetic pesticides, limits supply flexibility and creates structural price premiums, benefiting established processors with dedicated organic crushing facilities.
Expansion of sports nutrition and high-protein supplements incorporates soy
Soy protein isolates are experiencing a resurgence in popularity within the sports nutrition market after previously losing market share to whey protein. This renewed interest is largely driven by their lactose-free composition and complete amino acid profiles, which are comparable to those found in animal-based proteins. Companies such as Vega and PlantFusion are leveraging innovative soy-pea protein blends to enhance leucine content and optimize branching-chain amino acid (BCAA) ratios, effectively meeting the recovery and performance needs of endurance athletes. Additionally, hydrolyzed soy protein isolates, which undergo enzymatic pre-digestion to produce dipeptides and tripeptides, are gaining traction for their potential benefits. The International Society of Sports Nutrition (ISSN) has validated the efficacy of soy protein for muscle protein synthesis, recommending its consumption at 0.25 grams per kilogram of body weight per meal. This recognition underscores its suitability for both strength and endurance-focused applications.
Restraints Impact Analysis*
| Restraint | (~)% Impact on CAGR Forecast | Geographic Relevance | Impact Timeline |
|---|---|---|---|
| Allergen concerns limit soy protein use in sensitive consumer food formulations | -0.6% | Global, particularly North America and Europe | Short term (≤ 2 years) |
| Competition from pea, whey, and other plant proteins fragments market share | -0.8% | North America, Europe, urban Asia-Pacific | Medium term (2-4 years) |
| High processing costs for isolates raise pricing versus basic protein sources | -0.5% | Global, acute in emerging markets | Medium term (2-4 years) |
| Strict regulatory scrutiny on soy safety slows new product approvals | -0.4% | Europe, North America, select Asia-Pacific markets | Long term (≥ 4 years) |
| Source: Mordor Intelligence | |||
Allergen concerns limit soy protein use in sensitive consumer food formulations
Soy is recognized as one of the top eight allergens globally, with a prevalence of 0.3-0.5% among children and 0.1-0.3% among adults in North America and Europe, according to the American College of Allergy, Asthma and Immunology. Regulatory requirements, such as the Food Allergen Labeling and Consumer Protection Act (FALCPA) in the United States and European Union (EU) Regulation No 1169/2011, mandate clear allergen declarations. These regulations can discourage purchases by cautious consumers and restrict the use of soy protein in multi-allergen-free product lines. Companies catering to allergen-sensitive groups, such as infant formula for children with cow's milk protein allergy (CMPA) or snacks for school lunch programs, are increasingly choosing pea or rice protein to reduce cross-contact risks and simplify allergen management. Furthermore, the financial burden of maintaining segregated production lines and conducting allergen validation testing adds 8-12% to manufacturing costs, which disproportionately affects smaller processors that lack dedicated allergen-free facilities.
Competition from pea, whey, and other plant proteins fragments market share
Pea protein isolates held a significant share of the North American plant-based protein market in 2025, driven by their neutral flavor, non-genetically modified organism (non-GMO) attributes, and absence from the top-eight allergen list, as reported by the Plant Based Foods Association. Leading brands such as Beyond Meat and Impossible Foods incorporated pea protein into their formulations, leveraging extensive marketing efforts to position it as a premium plant protein despite its higher cost. In 2025, pea protein isolates were priced at USD 8-10 per kilogram, compared to USD 5-7 per kilogram for soy protein isolates. Whey protein continued to dominate the sports nutrition segment, capturing over 50% market share in 2025, supported by decades of clinical validation, superior leucine content, and well-established supply chains derived from dairy co-products. In Europe, market fragmentation was particularly evident, as regulatory support for non-GMO and allergen-free claims accelerated the adoption of pea protein in retail and foodservice channels. This shift has reduced soy's historical dominance in meat analogs and protein beverages.
*Our forecasts treat driver/restraint impacts as directional, not additive. The impact forecasts reflect baseline growth, mix effects, and variable interactions.
Segment Analysis
By Form: Isolates Anchor Premium Applications While Hydrolyzed Variants Target Rapid Absorption
Soy protein isolates accounted for 40.13% of the market share in 2025, leading applications such as sports nutrition, infant formula, and high-protein beverages. Their 90% protein content and neutral organoleptic (sensory) properties support premium pricing in these segments. Hydrolyzed soy protein, growing at a compound annual growth rate (CAGR) of 6.04% through 2031, is gaining popularity in clinical nutrition and post-workout recovery products. Its enzymatic pre-digestion produces di- and tri-peptides that bypass gastric breakdown, enabling faster amino acid absorption.
Companies like Abbott Nutrition and Nestlé Health Science are incorporating hydrolyzed soy protein into enteral feeding formulations for patients with compromised digestion, benefiting from its hypoallergenic properties and reduced immunogenicity compared to intact proteins. Meanwhile, soy protein concentrates, with 65-70% protein content, are used in cost-sensitive applications such as bakery products, processed meats, and pet food. In these cases, functional properties like water binding, emulsification, and texture enhancement are prioritized over protein purity.


By Category: Conventional Dominates on Cost, Organic Climbs on Clean-Label Mandates
Conventional soy protein held 79.34% of the market share in 2025, primarily due to cost advantages. Conventional soy protein isolates were priced at USD 5 to 7 per kilogram, compared to USD 9 to 12 per kilogram for organic alternatives. Additionally, well-established supply chains from major soybean-producing countries, including the United States, Brazil, and Argentina, further supported its market dominance.
Organic soy protein, growing at a compound annual growth rate (CAGR) of 5.74% through 2031, is steadily gaining market share in North America and Europe. Retailers such as Whole Foods Market and Alnatura require organic certification for private-label plant proteins, contributing to this growth. Certifications like United States Department of Agriculture (USDA) Organic and European Union (EU) Organic involve a three-year land transition period, prohibit synthetic pesticides and genetically modified organism (GMO) inputs, and require segregated handling. These factors limit supply flexibility and increase costs. In 2025, organic soybean production in the United States reached 180,000 metric tons, representing 1.8% of total soybean output. However, expansion remains constrained due to lower yields, with organic soybeans producing 2.2 to 2.5 metric tons per hectare compared to 3.0 to 3.5 metric tons for conventional varieties.
By End User: Food and Beverages Lead, Nutritional Supplements Accelerate
In 2025, the food and beverages segment accounted for 56.41% of soy protein demand. This includes applications in meat alternatives, dairy analogs, bakery products, snacks, and ready-to-eat (RTE) meals. Soy protein concentrate and isolates are used in these products for their functional properties, such as emulsification, water binding, and texture formation, as well as for nutritional fortification.
The nutritional supplements segment is projected to grow at a compound annual growth rate (CAGR) of 5.54% through 2031, driven by demand in sports nutrition, infant formula, and elderly nutrition. The complete amino acid profiles and high digestibility of soy protein support its premium pricing in this segment. The remaining demand is attributed to animal feed, where soy protein concentrate serves as a cost-effective protein source for aquaculture and poultry diets. However, this segment faces margin pressures due to competition from soybean meal, which provides comparable protein content at a lower cost.
Geography Analysis
North America led the global soy protein market in 2025, holding a 33.43% share. This dominance was supported by the United States' vertically integrated supply chain, which spans soybean cultivation, crushing, refining, and isolate production. The region's demand was strong across categories such as meat alternatives, sports nutrition, and pet food. North America's mature market is driven by innovation, with brands launching products like hydrolyzed soy protein beverages, organic soy protein bars, and hybrid meat products that combine soy with animal proteins to address cost and sustainability objectives. Regulatory support, including Generally Recognized as Safe (GRAS) status from the United States Food and Drug Administration (FDA) for soy protein isolates and concentrates, enables faster product development cycles, allowing brands to refine formulations without lengthy approval processes. In Canada, the plant-based protein sector is growing, backed by federal investments exceeding CAD 150 million (USD 110 million) through the Protein Industries Canada initiative, which is enhancing soy protein processing capacity and fostering innovation in texturized soy protein for meat analogs [2]Source: Government of Canada, “Protein Industries Canada Initiative,” Canada.ca.
The Asia-Pacific region is the fastest-growing segment, projected to expand at a compound annual growth rate (CAGR) of 5.44% through 2031. This growth is led by China's USD 2.8 billion soy protein market, which accounted for 28% of the region's volume in 2025. China's market growth is driven by government-supported protein fortification programs, urbanization, and increasing disposable incomes. The domestic soy protein industry benefits from a soybean crushing capacity exceeding 100 million metric tons annually. However, its reliance on imported soybeans from Brazil and the United States exposes the market to risks associated with currency fluctuations and trade policies. In India, the soy protein market is growing at a CAGR of 6.2%, fueled by vegetarian dietary traditions, government nutrition programs such as the Integrated Child Development Services (ICDS) initiative that incorporates soy-fortified foods, and increasing demand for sports nutrition among urban millennials[3]Source: Government of India, “Integrated Child Development Services,” India.gov.in.
Europe's soy protein market is also experiencing steady growth, with a CAGR of 4.6%. This growth is shaped by strict regulatory frameworks, including European Union (EU) Regulation No 1169/2011 on allergen labeling and Regulation (EC) No 1829/2003 on genetically modified organism (GMO) traceability. While these regulations increase compliance costs, they also strengthen consumer trust in certified non-GMO and organic soy proteins. Germany, the largest market in the region, valued at USD 420 million in 2025, is driven by the growing consumption of meat alternatives. Brands such as Rügenwalder Mühle and Veganz are incorporating soy protein isolates into plant-based sausages and deli slices to meet this demand.

Competitive Landscape
Top Companies in Soy Protein Market
Key players like Archer Daniels Midland (ADM), Cargill, and Bunge dominate the soy protein market, employing vertical integration from soybean origination to isolate production. This strategy bolsters cost leadership and strengthens supply chain resilience. Collectively, these companies command around 45% of global soy protein capacity. By operating crushing facilities in major soybean-producing areas such as the U.S. Midwest, Brazilian Cerrado, and Argentine Pampas, they can respond to demand shifts and commodity price changes. Mid-tier processors like Wilmar International, CHS Inc., and Fuji Oil Holdings differentiate through regional focus and specialized products. Wilmar, with integrated assets in China and Southeast Asia, has a strong position in the Asia-Pacific market. Fuji Oil Holdings supplies high-functionality soy proteins for Japan and Europe's confectionery and bakery sectors. Newer entrants such as Sonic Biochem in India and Gushen Biotechnology in China compete in cost-sensitive markets through lower-cost manufacturing and localized distribution. However, constrained research and development budgets can limit participation in premium isolate and hydrolyzed protein segments.
Market players are focusing on capacity expansions in high-growth regions. For instance, ADM invested USD 75 million in a North Dakota soy protein isolate facility that opened in 2024, targeting North America's demand for sports nutrition and meat alternatives. Cargill expanded its Wichita, Kansas texturized soy protein capacity by 30% in 2025, aligning with the needs of plant-based meat brands. Interest is also increasing in fermented soy proteins, which can enhance digestibility through microbial fermentation, and bioprocessed soy proteins produced via precision fermentation for animal-free heme proteins in advanced meat analogs. Processors are adopting technologies such as membrane filtration and enzymatic hydrolysis to increase protein purity and reduce environmental footprints. Blockchain systems are also being used to verify non-GMO and organic claims, supporting premium pricing.
Companies like Bühler Group and Clextral are pioneering patent activities in extrusion technology and shear-cell processing, refining texturized soy proteins to closely resemble whole-muscle meat cuts. These advancements not only fill a sensory void in plant-based meats but also propel market expansion.
Soy Protein Industry Leaders
Archer Daniels Midland Company
Cargill, Incorporated
Bunge Limited
Wilmar International Limited
CHS Inc.
- *Disclaimer: Major Players sorted in no particular order

Recent Industry Developments
- December 2025: Bunge launched a new line of soy protein concentrates at IFFA, backed by a USD 550 million investment in its Morristown, Indiana facility—the world's largest food-grade plant protein site. Offering 70% protein and 17% fiber in conventional and non-GMO formats, these products feature clean taste, neutral color, and affordability for plant-based meats, snacks, baked goods, and beverages, while prioritizing sustainability through regenerative agriculture.
- November 2024: ICL Food Specialties partners with DAIZ Engineering to launch ROVITARIS SprouTx, a innovative textured soy protein using germination technology. It enhances taste, texture, and nutrition for plant-based meat and seafood analogs, eliminating beany flavors.
- August 2025: ADM has decided to streamline its global soy protein production network. The company will halt operations at its Bushnell, Illinois plant and instead focus on its recommissioned Decatur East facility, as well as other international sites. This move not only boosts efficiency but also caters to the rising global demand. Furthermore, it solidifies ADM's competitive edge through enhanced operational excellence and a more simplified portfolio.


Global Soy Protein Market Report Scope
The global soy protein market processes protein-rich ingredients derived from soybeans into versatile forms. These forms find diverse applications, spanning food processing, animal nutrition, and health products. As health consciousness rises, so does the demand for plant-based alternatives. This surge bolsters the market, supporting meat substitutes, functional foods, supplements, and feed solutions.
The Global Soy Protein market is segmented by form into soy protein concentrates, soy protein hydrolyzed, and soy protein isolates. By category, the market is segmented into organic and conventional. The market is segmented by end user animal feed, food and beverages, and nutritional supplements. The market is segmented by geography into North America, Europe, Asia-Pacific, South America, and Middle East and Africa. The market sizing has been done in value terms in USD and volume in tonnes for all the abovementioned segments.
By Form
| Soy Protein Concentrates |
| Soy Protein Hydrolyzed |
| Soy Protein Isolates |
By Category
| Organic |
| Conventional |
By End User
| Animal Feed | |
| Food and Beverages | Bakery |
| Beverages | |
| Breakfast Cereals | |
| Condiments/Sauces | |
| Confectionery | |
| Dairy and Dairy Alternatives | |
| Meat/Poultry/Seafood and Meat Alternative Products | |
| RTE/RTC Foods | |
| Snacks | |
| Nutritional Supplements | Baby and Infant Formula |
| Elderly and Medical Nutrition | |
| Sport/Performance Nutrition |
By Geography
| North America | United States |
| Canada | |
| Mexico | |
| Rest of North America | |
| Europe | Germany |
| United Kingdom | |
| Italy | |
| France | |
| Spain | |
| Netherlands | |
| Poland | |
| Belgium | |
| Sweden | |
| Rest of Europe | |
| Asia-Pacific | China |
| India | |
| Japan | |
| Australia | |
| Indonesia | |
| South Korea | |
| Thailand | |
| Singapore | |
| Rest of Asia-Pacific | |
| South America | Brazil |
| Argentina | |
| Colombia | |
| Chile | |
| Peru | |
| Rest of South America | |
| Middle East and Africa | South Africa |
| Saudi Arabia | |
| United Arab Emirates | |
| Nigeria | |
| Egypt | |
| Morocco | |
| Turkey | |
| Rest of Middle East and Africa |
| By Form | Soy Protein Concentrates | |
| Soy Protein Hydrolyzed | ||
| Soy Protein Isolates | ||
| By Category | Organic | |
| Conventional | ||
| By End User | Animal Feed | |
| Food and Beverages | Bakery | |
| Beverages | ||
| Breakfast Cereals | ||
| Condiments/Sauces | ||
| Confectionery | ||
| Dairy and Dairy Alternatives | ||
| Meat/Poultry/Seafood and Meat Alternative Products | ||
| RTE/RTC Foods | ||
| Snacks | ||
| Nutritional Supplements | Baby and Infant Formula | |
| Elderly and Medical Nutrition | ||
| Sport/Performance Nutrition | ||
| By Geography | North America | United States |
| Canada | ||
| Mexico | ||
| Rest of North America | ||
| Europe | Germany | |
| United Kingdom | ||
| Italy | ||
| France | ||
| Spain | ||
| Netherlands | ||
| Poland | ||
| Belgium | ||
| Sweden | ||
| Rest of Europe | ||
| Asia-Pacific | China | |
| India | ||
| Japan | ||
| Australia | ||
| Indonesia | ||
| South Korea | ||
| Thailand | ||
| Singapore | ||
| Rest of Asia-Pacific | ||
| South America | Brazil | |
| Argentina | ||
| Colombia | ||
| Chile | ||
| Peru | ||
| Rest of South America | ||
| Middle East and Africa | South Africa | |
| Saudi Arabia | ||
| United Arab Emirates | ||
| Nigeria | ||
| Egypt | ||
| Morocco | ||
| Turkey | ||
| Rest of Middle East and Africa | ||


Market Definition
- End User - The Protein Ingredients Market operates on a B2B basis. Food, Beverages, Supplements, Animal Feed, and Personal Care & Cosmetic manufacturers are considered to be end-consumers in the market studied. The scope excludes manufacturers buying liquid/dry whey to be used for application as a binding agent or thickener or other non-protein applications.
- Penetration Rate - Penetration Rate is defined as the percentage of Protein-Fortified End User Market Volume in the Overall End User Market Volume.
- Average Protein Content - Average protein content is the average protein content present per 100 g of product manufactured by all end-user companies considered under the scope of this report.
- End User Market Volume - End-user market volume is the consolidated volume of all types and forms of end-user products in the country or region.
| Keyword | Definition |
|---|---|
| Alpha-lactalbumin (α-Lactalbumin) | It is a protein that regulates the production of lactose in the milk of almost all mammalian species. |
| Amino acid | It is an organic compound that contains both amino and carboxylic acid functional groups, which are required for the synthesis of body protein and other important nitrogen-containing compounds, such as creatine, peptide hormones, and some neurotransmitters. |
| Blanching | It is the process of briefly heating vegetables with steam or boiling water. |
| BRC | British Retail Consortium |
| Bread improver | It is a flour-based blend of several components with specific functional properties designed to modify dough characteristics and give quality attributes to bread. |
| BSF | Black Soldier Fly |
| Caseinate | It is a substance produced by adding an alkali to acid casein, a derivative of casein. |
| Celiac disease | Celiac disease is an immune reaction to eating gluten, a protein found in wheat, barley, and rye. |
| Colostrum | It is a milky fluid that’s released by mammals that have recently given birth before breast milk production begins. |
| Concentrate | It is the least processed form of protein and has a protein content ranging from 40-90% by weight. |
| Dry protein basis | It refers to the percentage of "pure protein" present in a supplement after the water in it is completely removed through heat. |
| Dry whey | It is the product resulting from drying fresh whey which has been pasteurized and to which nothing has been added as a preservative. |
| Egg protein | It is a mixture of individual proteins, including ovalbumin, ovomucoid, ovoglobulin, conalbumin, vitellin, and vitellenin. |
| Emulsifier | It is a food additive that facilitates the blending of foods that are immiscible with one another, such as oil and water. |
| Enrichment | It is the process of addition of micronutrients that are lost during the processing of the product. |
| ERS | Economic Research Service of the USDA |
| Extrusion | It is the process of forcing soft mixed ingredients through an opening in a perforated plate or die designed to produce the required shape. The extruded food is then cut to a specific size by blades. |
| Fava | Also known as Faba, it is another word for yellow split beans. |
| FDA | Food and Drug Administration |
| Flaking | It is a process in which typically a cereal grain (like corn, wheat, or rice) is broken down into grits, cooked with flavors and syrups, and then pressed into flakes between cooled rollers. |
| Foaming agent | It is a food ingredient that makes it possible to form or maintain a uniform dispersion of a gaseous phase in a liquid or solid food. |
| Foodservice | It refers to the part of the food industry which includes businesses, institutions, and companies which prepare meals outside the home. It includes restaurants, school and hospital cafeterias, catering operations, and many other formats. |
| Fortification | It is the deliberate addition of micronutrients that are not found in them naturally or which are lost during processing, to improve a food product's nutritional value. |
| FSANZ | Food Standards Australia New Zealand |
| FSIS | Food Safety and Inspection Service |
| FSSAI | Food Safety and Standards Authority of India |
| Gelling agent | It is an ingredient that functions as a stabilizer and thickener to provide thickening without stiffness through the formation of gel. |
| GHG | Greenhouse Gas |
| Gluten | It is a family of proteins found in grains, including wheat, rye, spelt, and barley. |
| Hemp | It is a botanical class of Cannabis sativa cultivars grown specifically for industrial or medicinal use. |
| Hydrolysate | It is a form of protein manufactured by exposing the protein to enzymes that can partially break the bonds between the protein's amino acids and break down large, complicated proteins into smaller pieces. Its processing makes it easier and quicker to digest. |
| Hypoallergenic | It refers to a substance that causes fewer allergic reactions. |
| Isolate | It is the purest and most processed form of protein which has undergone separation to obtain a pure protein fraction. It typically contains ≥ 90% of protein by weight. |
| Keratin | It is a protein that helps form hair, nails, and the outer layer of skin. |
| Lactalbumin | It is the albumin contained in milk and obtained from whey. |
| Lactoferrin | It is an iron‑binding glycoprotein that is present in the milk of most mammals. |
| Lupin | It is the yellow legume seeds of the genus Lupinus. |
| Millenial | Also known as Generation Y or Gen Y, it refers to the people born from 1981 to 1996. |
| Monogastric | It refers to an animal with a single-compartmented stomach. Examples of monogastric include humans, poultry, pigs, horses, rabbits, dogs, and cats. Most monogastric are generally unable to digest much cellulose food materials such as grasses. |
| MPC | Milk protein concentrate |
| MPI | Milk protein isolate |
| MSPI | Methylated soy protein isolate |
| Mycoprotein | Mycoprotein is a form of single-cell protein, also known as fungal protein, derived from fungi for human consumption. |
| Nutricosmetics | It is a category of products and ingredients that act as nutritional supplements to care for skin, nails, and hair natural beauty. |
| Osteoporosis | It is a medical condition in which the bones become brittle and fragile from loss of tissue, typically as a result of hormonal changes, or deficiency of calcium or vitamin D. |
| PDCAAS | Protein digestibility-corrected amino acid score (PDCAAS) is a method of evaluating the quality of a protein based on both the amino acid requirements of humans and their ability to digest it. |
| Per-capita consumption of animal protein | It is the average amount of animal protein (such as milk, whey, gelatin, collagen, and egg proteins) that is readily available for consumption by each person in an actual population. |
| Per-capita consumption of plant protein | It is the average amount of plant protein (such as soy, wheat, pea, oat, and hemp proteins) that is readily available for consumption by each person in an actual population. |
| Quorn | It is a microbial protein manufactured using mycoprotein as an ingredient, in which the fungus culture is dried and mixed with egg albumen or potato protein, which acts as a binder, and then is adjusted in texture and pressed into various forms. |
| Ready-to-Cook (RTC) | It refers to food products that include all of the ingredients, where some preparation or cooking is required through a process that is given on the package. |
| Ready-to-Eat (RTE) | It refers to a food product prepared or cooked in advance, with no further cooking or preparation required before being eaten. |
| RTD | Ready-to-Drink |
| RTS | Ready-to-Serve |
| Saturated fat | It is a type of fat in which the fatty acid chains have all single bonds. It is generally considered unhealthy. |
| Sausage | It is a meat product made of finely chopped and seasoned meat, which may be fresh, smoked, or pickled and which is then usually stuffed into a casing. |
| Seitan | It is a plant-based meat substitute made out of wheat gluten. |
| Softgel | It is a gelatin-based capsule with a liquid fill. |
| SPC | Soy protein concentrate |
| SPI | Soy protein isolate |
| Spirulina | It is a biomass of cyanobacteria that can be consumed by humans and animals. |
| Stabilizer | It is an ingredient added to food products to help maintain or enhance their original texture, and physical and chemical characteristics. |
| Supplementation | It is the consumption or provision of concentrated sources of nutrients or other substances that are intended to supplement nutrients in the diet and is intended to correct nutritional deficiencies. |
| Texturant | It is a specific type of food ingredient that is used to control and alter the mouthfeel and texture of food and beverage products. |
| Thickener | It is an ingredient that is used to increase the viscosity of a liquid or dough and make it thicker, without substantially changing its other properties. |
| Trans fat | Also called trans-unsaturated fatty acids or trans fatty acids, it is a type of unsaturated fat that naturally occurs in small amounts in meat. |
| TSP | Textured soy protein |
| TVP | Textured vegetable protein |
| WPC | Whey protein concentrate |
| WPI | Whey protein isolate |


Research Methodology
Mordor Intelligence follows a four-step methodology in all our reports.
- Step-1: Identify Key Variables: The quantifiable key variables (industry and extraneous) pertaining to the specific product segment and country are selected from a group of relevant variables & factors based on desk research & literature review; along with primary expert inputs. These variables are further confirmed through regression modeling (wherever required).
- Step-2: Build a Market Model: In order to build a robust forecasting methodology, the variables and factors identified in Step-1 are tested against available historical market numbers. Through an iterative process, the variables required for market forecast are set and the model is built on the basis of these variables.
- Step-3: Validate and Finalize: In this important step, all market numbers, variables and analyst calls are validated through an extensive network of primary research experts from the market studied. The respondents are selected across levels and functions to generate a holistic picture of the market studied.
- Step-4: Research Outputs: Syndicated Reports, Custom Consulting Assignments, Databases & Subscription Platforms


