
South Africa Safari Tourism Market Size and Share
Market Overview
| Study Period | 2021 - 2031 |
|---|---|
| Forecast Data Period | 2026 - 2031 |
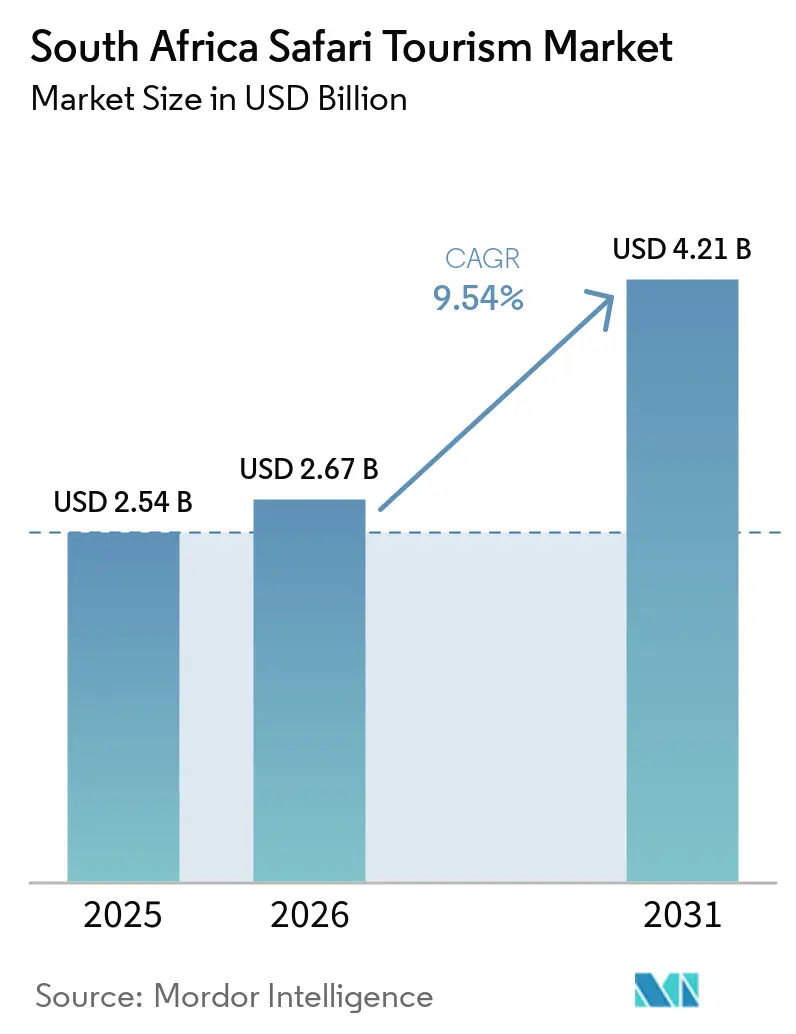
| Base Year Market Size (2025) | USD 2.54 Billion |
| Market Size (2026) | USD 2.67 Billion |
| Market Size (2031) | USD 4.21 Billion |
| Growth Rate (2026 - 2031) | 9.54 % |
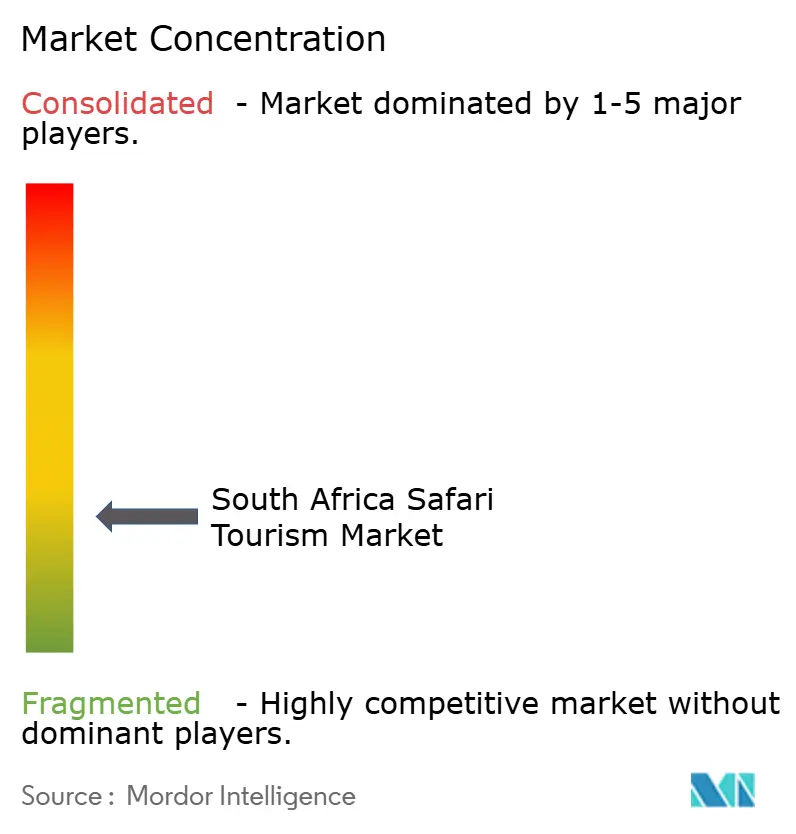
| Market Concentration | Low |
Major Players *Disclaimer: Major Players sorted in no particular order Image © Mordor Intelligence. Reuse requires attribution under CC BY 4.0. | |
South Africa Safari Tourism Market Analysis by Mordor Intelligence
The South Africa safari tourism market was valued at USD 2.54 billion in 2025 and is estimated to grow from USD 2.67 billion in 2026 to reach USD 4.21 billion by 2031, at a CAGR of 9.54% during the forecast period (2026-2031). International tourist arrivals reached 10.5 million in 2025. Tourism contributed 9% to GDP and supported 1.8 million jobs. European tourists remained significant, with German arrivals rising in April 2025[1]. Domestic travel spending improved, while Asian recovery lagged due to visa and air access issues. The Tourism Growth Partnership Plan (2025-2029), along with route development and visa facilitation, supports market growth despite challenges like power reliability and operational costs.
Key Report Takeaways
- By safari type, Adventure Safari led the South Africa safari tourism market with 48.63% revenue share in 2025, while Private Safari is forecast to expand at a 10.34% CAGR through 2031.
- By accommodation type, Safari Resorts & Lodges held 41.31% share of the South Africa safari tourism market in 2025, while Eco-lodges are projected to grow at a 9.98% CAGR through 2031.
- By booking channel, Online Travel Platforms accounted for 52.92% share of the South Africa safari tourism market in 2025 and recorded the highest projected CAGR at 11.63% through 2031.
- By tourist type, International Tourists generated 64.24% of the South Africa safari tourism market revenue in 2025, while Domestic Tourists are expected to grow at a 10.03% CAGR through 2031.
- By geography, Greater Kruger National Park and Private Reserves captured 35.41% share of the South Africa safari tourism market in 2025, while the Kalahari and Northern Cape Safari Region is forecast to grow at a 9.84% CAGR through 2031.
Note: Market size and forecast figures in this report are generated using Mordor Intelligence’s proprietary estimation framework, updated with the latest available data and insights as of January 2026.
South Africa Safari Tourism Market Trends and Insights
Drivers Impact Analysis*
| Driver | (~) % Impact on CAGR Forecast | Geographic Relevance | Impact Timeline |
|---|---|---|---|
| High demand from European and North American travellers drives sustained growth in wildlife tourism | +2.3% | Concentration in Greater Kruger, KwaZulu-Natal, and Eastern Cape | Short term (≤ 2 years) |
| Expanding international and domestic air connectivity improves access to secondary safari destinations | +1.7% | National, with accelerated gains in Northern Cape, Madikwe & Waterberg, and Eastern Cape | Medium term (2-4 years) |
| Rising preference for eco-certified and conservation-led safaris boosts high-value tourism demand | +1.5% | Primary impact in Kalahari, Eastern Cape, and KwaZulu-Natal | Long term (≥ 4 years) |
| Government visa facilitation and tourism promotion initiatives support international tourist inflows | +1.1% | Global, with targeted gains from Asian, South American, and Middle Eastern markets | Short term (≤ 2 years) |
| Increasing domestic tourism spending strengthens participation in wildlife and nature-based travel experiences | +0.8% | National, with spill-over into North West, Limpopo, and malaria-free reserves | Medium term (2-4 years) |
| AI-driven personalisation, mobile booking platforms, and digital marketing improve traveller conversion rates | +0.9% | Disproportionate gains among Millennial and Gen-Z independent travellers | Medium term (2-4 years) |
| Source: Mordor Intelligence | |||
High demand from European and North American travellers drives sustained growth in wildlife tourism
Europe and North America continue to dominate international demand for South Africa's safari tourism. Germany, a key European market, showed significant growth in April 2025. Mpumalanga also experienced notable increases in international arrivals during the second quarter of 2025, with most visitors heading to Kruger National Park. This highlights the region's importance as a primary destination for overseas safari travelers. Long-haul visitors typically contribute more through extended stays, higher spending, and participation in guided activities compared to regional travelers[2]. The Tourism Growth Partnership Plan has enhanced marketing efforts targeting Germany, the United Kingom, the United States, and the Netherlands, aiming to sustain demand for South Africa's safari tourism.
Expanding international and domestic air connectivity improves access to secondary safari destinations
Air connectivity is a key driver of growth in South Africa's safari tourism sector. The Cabinet approved the Route Development Marketing Strategy to align efforts between the Department of Tourism, South African Tourism, and private stakeholders for expanding air services. This initiative addresses the reliance of secondary safari regions on complex transfers from OR Tambo or Cape Town. The South African Government highlighted the connection between improved connectivity and tourism growth in its update on international arrivals. Direct air connectivity has demonstrated the potential to boost arrivals from non-traditional markets, as seen with increased visitor numbers from Brazil. Expanding feeder links is expected to enhance itinerary inclusion and pricing support for regions such as Northern Cape, Eastern Cape, and malaria-free reserve circuits, strengthening their position in the safari tourism market.
Rising preference for eco-certified and conservation-led safaris boosts high-value tourism demand
Sustainability is becoming a key factor in booking decisions within South Africa's safari tourism market. The Green Tourism Incentive Programme has supported numerous properties since its inception, offering grants to fund energy- and water-efficiency upgrades. These grants help reduce operational costs for accommodation providers adopting greener practices. Responsible tourism is a central focus that strengthens policy support for conservation-led initiatives. This approach enhances the competitiveness of properties that demonstrate environmental responsibility, local community benefits, and long-term habitat preservation. It also reinforces the connection between conservation revenue and the market's future growth.
AI-driven personalisation, mobile booking platforms, and digital marketing improve traveller conversion rates
Digital tools are transforming how travelers explore, compare, and book trips in South Africa's safari tourism market. The South African government highlighted AI-driven travel planning as a focus area for tourism growth in its 2025 strategy. The research emphasized the need to create a regulatory framework to support technological advancements in tourism. These measures enable personalized itineraries, quicker bookings, and better alignment of traveler preferences with wildlife patterns. Operators proficient in managing real-time inventory, digital payments, and mobile communication benefit from reduced friction. As online platforms grow, converting interest into bookings is becoming a critical competitive advantage in the safari tourism market.
Restraints Impact Analysis*
| Restraint | (~) % Impact on CAGR Forecast | Geographic Relevance | Impact Timeline |
|---|---|---|---|
| Safety and security concerns continue to limit international arrivals, especially from Asian markets | -1.5% | National, with heightened impact on trans-Johannesburg transit routes and Cape Town urban access | Short term (≤ 2 years) |
| Escalating operational costs (energy, labour, land, compliance) compress mid-market accommodation viability and reduce supply diversity | -1.2% | National, with greater severity in remote secondary destinations reliant on diesel generation | Long term (≥ 4 years) |
| Tourism in Kruger National Park and Cape Town restricts regional diversification opportunities | -0.7% | National, with spill-over under-investment in KwaZulu-Natal interior, Northern Cape, and Eastern Cape | Medium term (2-4 years) |
| Infrastructure gaps, unreliable electricity, and weak secondary air connectivity hinder tourism growth scalability | -1.0% | National, with acute impact on Kalahari, Madikwe, and Eastern Cape reserves outside main corridors | Long term (≥ 4 years) |
| Source: Mordor Intelligence | |||
Safety and security concerns continue to limit international arrivals, especially from Asian markets
Safety concerns continue to influence demand in South Africa's safari tourism market. Asian arrivals saw a year-on-year decline in Q2 2025, recovering to a fraction of pre-pandemic levels during the report period. To address safety issues, the Department of Tourism deployed thousands of Tourism Monitors across all provinces. The initiative aimed to enhance visitor safety at key attractions, including protected areas and tourism zones, with significant funding allocated over recent fiscal years. However, challenges persist, particularly around urban transit hubs and long road transfers, which may deter first-time safari visitors. Ensuring safety remains critical not only for increasing visitor numbers but also for encouraging travelers to explore beyond the most popular safari routes.
Escalating operational costs (energy, labour, land, compliance) compress mid-market accommodation viability and reduce supply diversity
Cost pressures are limiting supply depth in South Africa's safari tourism market. Remote lodges face significant challenges due to unreliable electricity, which increases reliance on backup systems and raises energy costs. The Green Tourism Incentive Programme has provided grant support for efficiency upgrades, reflecting the state's recognition of these challenges. While this support enhances resilience for existing properties, it does not fully address rising labor, land, and compliance costs for new or mid-market entrants. Secondary destinations are particularly affected, with unstable occupancy rates and higher transport expenses exacerbating the issue. If these trends persist, the growth of value-led accommodations may continue to lag behind demand in several areas of the market[3].
*Our forecasts treat driver/restraint impacts as directional, not additive. The impact forecasts reflect baseline growth, mix effects, and variable interactions.
Segment Analysis
By Safari Type: Activity Diversity Anchors Adventure Safari Revenue Lead
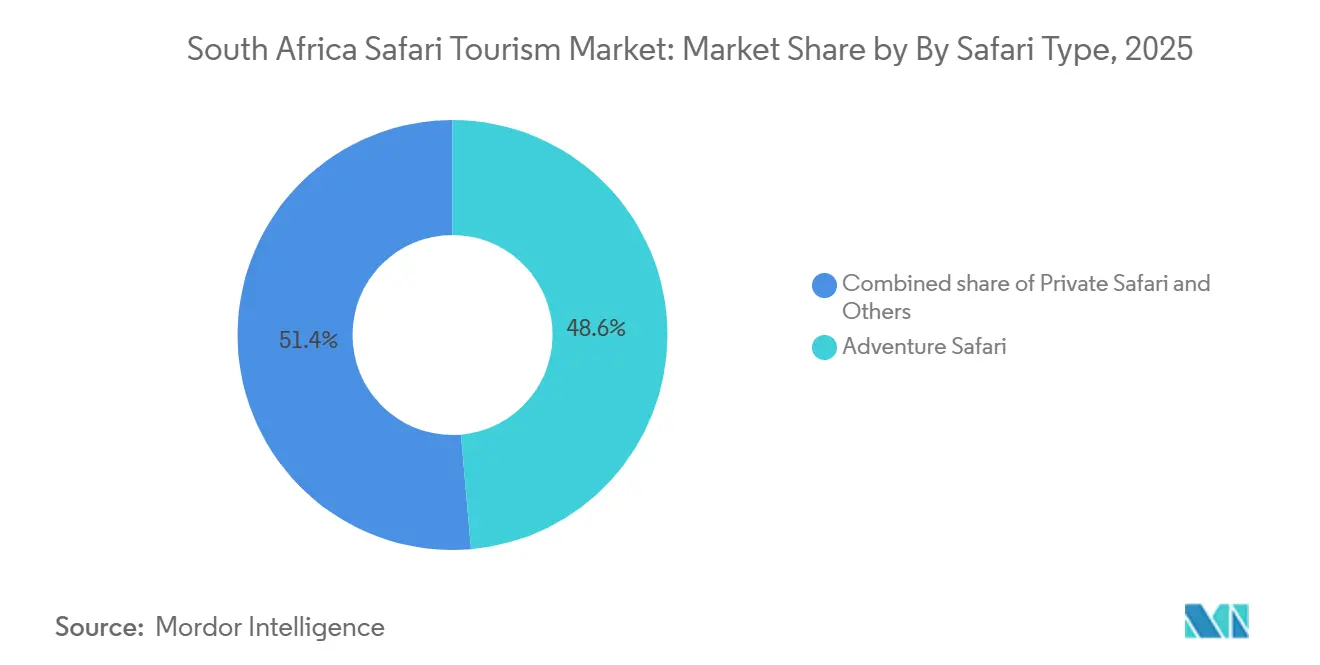
Adventure Safari accounted for 48.63% of South Africa's safari tourism market share in 2025, maintaining its position as the top revenue-generating safari type. This segment is linked to self-drive and guided wildlife tours in national parks and private reserves, meeting the expectations of first-time and repeat long-haul travelers. In Q2 2025, 83.2% of Mpumalanga’s and 65.2% of Limpopo’s international tourists visited Kruger National Park, highlighting the demand for Big Five circuits. However, its performance depends on access, crowding, and park management in key areas. Gate quota measures at Kruger during December 2025 addressed crowd control challenges.
Private Safari is projected to grow at a 10.34% CAGR from 2026 to 2031, driven by demand for privacy, exclusivity, and enhanced services, resulting in higher visitor spending. The April 2026 launch of the Tengile MalaMala Collection and the December 2026 opening of Khensani River Lodge reflect a shift toward secluded, high-value offerings. The 'Others' segment, including walking safaris and conservation experiences, diversifies the product mix, appealing to younger and repeat travelers seeking tailored experiences[4].

By Accommodation Type: Lodges Lead but Eco-lodges Redefine the Premium Tier
Safari Resorts & Lodges held 41.31% of South Africa's safari tourism market in 2025, driven by established lodge networks in Greater Kruger, Sabi Sand, and KwaZulu-Natal. These areas benefit from fixed infrastructure that supports higher service levels and longer stays. Lodges cater to multi-night itineraries, family travel, and travelers seeking integrated logistics, dining, and guiding services, maintaining their central role in the safari tourism market.
Eco-lodges are projected to grow at a 9.98% CAGR through 2031, supported by the Green Tourism Incentive Programme. This initiative provided grants of up to ZAR 1 million (USD 0.1 million) for energy and water efficiency retrofits, assisting 103 properties in FY2024/25 and 308 properties since its inception. Tented Camps and Bush Camps remain significant, serving flexible itineraries and guests seeking closer connections to the landscape.
By Booking Channel: Digital Platforms Command Majority Booking Share
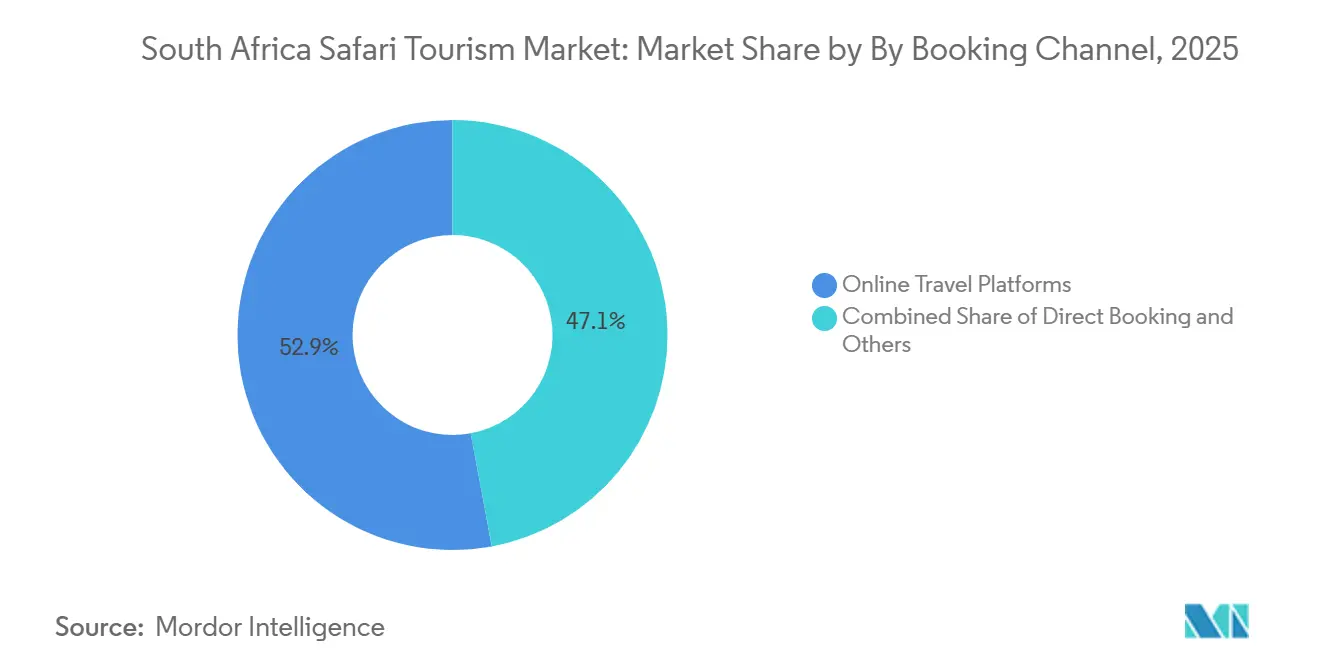
Online travel platforms accounted for 52.92% of South Africa's safari tourism market in 2025 and are projected to grow at an 11.63% CAGR through 2031. These platforms are the largest and fastest-growing booking channels, driven by demand for live inventory, transparent pricing, and mobile booking options. Government policies, including AI-enabled travel planning and digital tools, support this shift.
Direct bookings remain significant for luxury lodges, where personal contact and tailored itineraries are prioritized. Specialist trade channels are essential for multi-stop safari packages, combining flights, transfers, and guide services. The industry is evolving toward a layered distribution model that addresses diverse traveler needs. Smaller operators face pressure to digitize payments, inventory, and guest communication while maintaining service quality.
By Tourist Type: International Revenue Dominates but Domestic Momentum Builds
International tourists generated 64.24% of revenue in 2025, remaining the primary revenue source for South Africa's safari tourism market. In Q2 2025, overseas visitors stayed an average of 13.7 nights, driving higher safari spending compared to domestic trips. European tourists contributed ZAR 5.2 billion (USD 0.31 billion), while American tourists added ZAR 3.7 billion (USD 0.22 billion) during the same period, emphasizing the importance of long-haul demand. Longer stays and higher spending influence pricing, lodge design, and guide services, with visa processing, connectivity, and safety perceptions impacting revenue more than arrival numbers.
Domestic tourists are projected to grow at a 10.03% CAGR through 2031, broadening the market's demand base. Domestic overnight trips reached 40 million in FY2024/25, up from 37.7 million the previous year, with direct holiday spending at ZAR 61 billion (USD 3.67 billion). The “It’s Your Country, Enjoy It” campaign and the ZAR 1.2 billion (USD 0.07 billion) Tourism Equity Fund are increasing participation and ownership in the sector. This shift is supporting growth in self-drive safaris, shorter trips, and malaria-free reserves, reducing reliance on international demand while still maintaining its importance.
Geography Analysis
The Greater Kruger National Park and its private reserves held 35.41% of South Africa's safari tourism market share in 2025, maintaining dominance as a key safari destination. International tourists primarily visit Mpumalanga and Limpopo, emphasizing Kruger National Park's role in driving inbound safari demand. The combination of its vast public park and adjacent private reserves supports diverse travel preferences. This region remains vital for global wildlife recognition and repeat visits. KwaZulu-Natal and the Eastern Cape are seeing increased international arrivals, indicating a gradual shift in demand beyond traditional safari areas.
The Eastern Cape benefits from being malaria-free, road-trip friendly, and undergoing reserve expansions, including additions to private game reserves. Addo Elephant National Park attracts a significant share of international visitors. Madikwe and Waterberg also leverage their malaria-free status, while Pilanesberg draws many international tourists to the North West province.
The Kalahari and Northern Cape Safari Region is projected to grow at a 9.84% CAGR through 2031. The Northern Cape is gaining international interest for remote wildlife experiences. A biodiversity economy program supports land conversion, wildlife enterprises, and protected-area expansion, positioning the region to meet rising demand as accessibility improves.
Competitive Landscape
The South Africa safari tourism market is moderately concentrated in the luxury segment and fragmented across mid-market lodging, transport, and operators. Brands such as Singita, andBeyond, MalaMala Game Reserve, Londolozi Private Game Reserve, and Sabi Sabi Private Game Reserve dominate the luxury space, while smaller reserves and operators contribute to regional supply. Brand reputation, conservation credibility, and distribution reach are more critical than scale. Community-linked ownership models are gaining prominence.
Growth strategies focus on experience upgrades, ownership models, and itinerary integration rather than room additions. Regulations, grading, and policy alignment also shape competition. The Department of Tourism reported that TGCSA assessed 4,586 accommodation establishments in FY2024/25, maintaining the relevance of quality grading for leisure and business travel.
South Africa Safari Tourism Industry Leaders
-
Singita
-
andBeyond
-
Sabi Sabi Game Reserve
-
Londolozi
-
MalaMala Game Reserve
- *Disclaimer: Major Players sorted in no particular order
Recent Industry Developments
- April 2026: Tengile MalaMala Collection, a community-partnered safari brand in Sabi Sand, unites six lodges along the Sand River. Co-owned by the N'wandlamhari Communal Property Association and the Saad family, it plans to open Khensani River Lodge with nine units and private plunge pools in December 2026.
- April 2026: Singita Lebombo Lodge in Singita Kruger National Park has completed renovations, introducing a Conservation Lounge, a Gallery of Treasures, and a Wine Pavilion, along with energy-efficient upgrades to its double-glazed suites.
- February 2026: Aquila Collection has acquired and relaunched Quagga River Lodge on the Cape West Coast. This off-grid, solar-powered retreat near Velddrif enhances its Cape safari itinerary while incorporating the Quagga Project's selective breeding conservation efforts.
South Africa Safari Tourism Market Report Scope
| Adventure Safari |
| Private Safari |
| Others |
| Safari Resorts & Lodges |
| Tented Camps and Bush Camps |
| Eco-lodges |
| Others |
| Direct Booking |
| Online Travel Platforms |
| Others (Marketplace Booking and others) |
| International Tourists |
| Domestic Tourists |
| Greater Kruger National Park & Private Reserves |
| KwaZulu-Natal Safari Region |
| Eastern Cape Safari Reserves |
| Madikwe & Waterberg Conservation Region |
| Kalahari & Northern Cape Safari Region |
| By Safari Type | Adventure Safari |
| Private Safari | |
| Others | |
| By Accommodation Type | Safari Resorts & Lodges |
| Tented Camps and Bush Camps | |
| Eco-lodges | |
| Others | |
| By Booking Channel | Direct Booking |
| Online Travel Platforms | |
| Others (Marketplace Booking and others) | |
| By Tourist Type | International Tourists |
| Domestic Tourists | |
| By Geography | Greater Kruger National Park & Private Reserves |
| KwaZulu-Natal Safari Region | |
| Eastern Cape Safari Reserves | |
| Madikwe & Waterberg Conservation Region | |
| Kalahari & Northern Cape Safari Region |
Key Questions Answered in the Report
What is the projected value of South Africa safari tourism by 2031?
The South Africa safari tourism market is projected to reach USD 4.21 billion by 2031, rising from USD 2.67 billion in 2026 at a 9.54% CAGR through 2031.
Which safari type brings in the most revenue in South Africa?
Adventure Safari led in 2025 with a 48.63% revenue share, supported by strong demand for classic wildlife viewing in Kruger-linked circuits.
Which booking channel is growing the fastest for safari travel in South Africa?
Online Travel Platforms are both the largest booking channel at 52.92% share in 2025 and the fastest-growing one, with an 11.63% CAGR through 2031.
Why does Greater Kruger remain the core safari destination?
Greater Kruger held 35.41% of revenue in 2025 and still anchors international demand because of its global wildlife appeal and the mix of public park and private reserve options.
Are domestic travelers becoming more important for safari demand?
Yes. Domestic tourists are forecast to grow at a 10.03% CAGR through 2031, supported by rising overnight trips, higher domestic holiday spending, and government participation campaigns.
What are the main risks holding back safari growth in South Africa?
The main pressures are safety concerns in some travel corridors, weak recovery from Asian source markets, and rising operating costs linked to power reliability and remote lodge economics.