
Smart TV OTT Streaming Market Size and Share
Market Overview
| Study Period | 2020 - 2031 |
|---|---|
| Market Size (2026) | USD 111.64 Billion |
| Market Size (2031) | USD 177.47 Billion |
| Growth Rate (2026 - 2031) | 9.71 % |
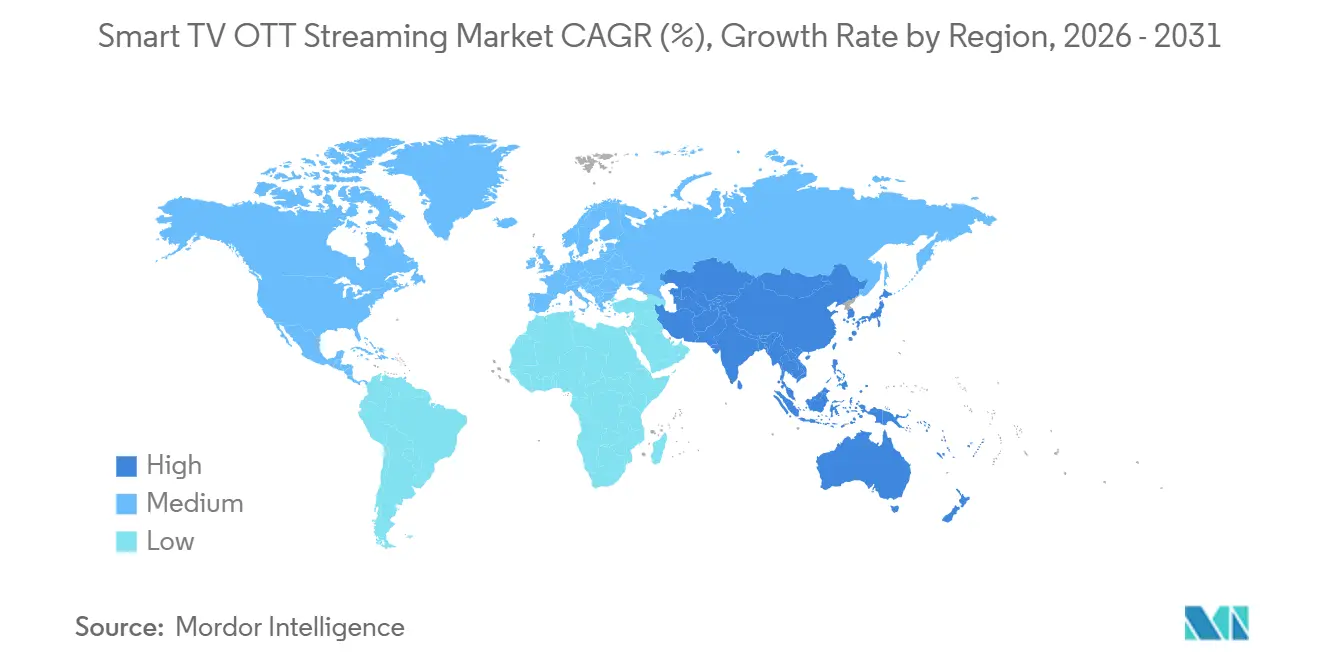
| Fastest Growing Market | Asia-Pacific |
| Largest Market | North America |
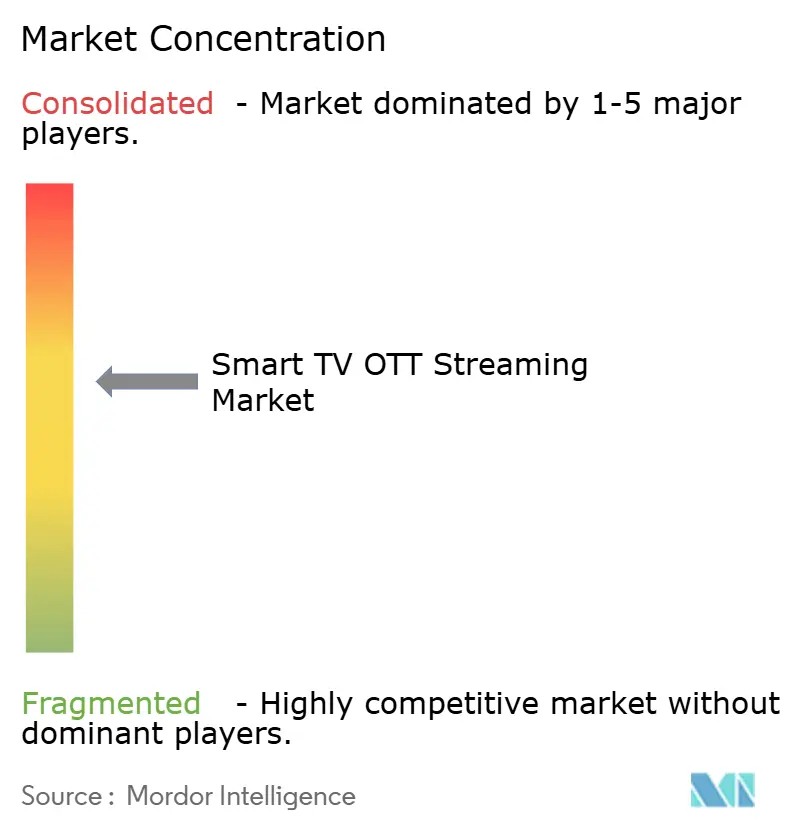
| Market Concentration | Medium |
Major Players *Disclaimer: Major Players sorted in no particular order Image © Mordor Intelligence. Reuse requires attribution under CC BY 4.0. | |
Smart TV OTT Streaming Market Analysis by Mordor Intelligence
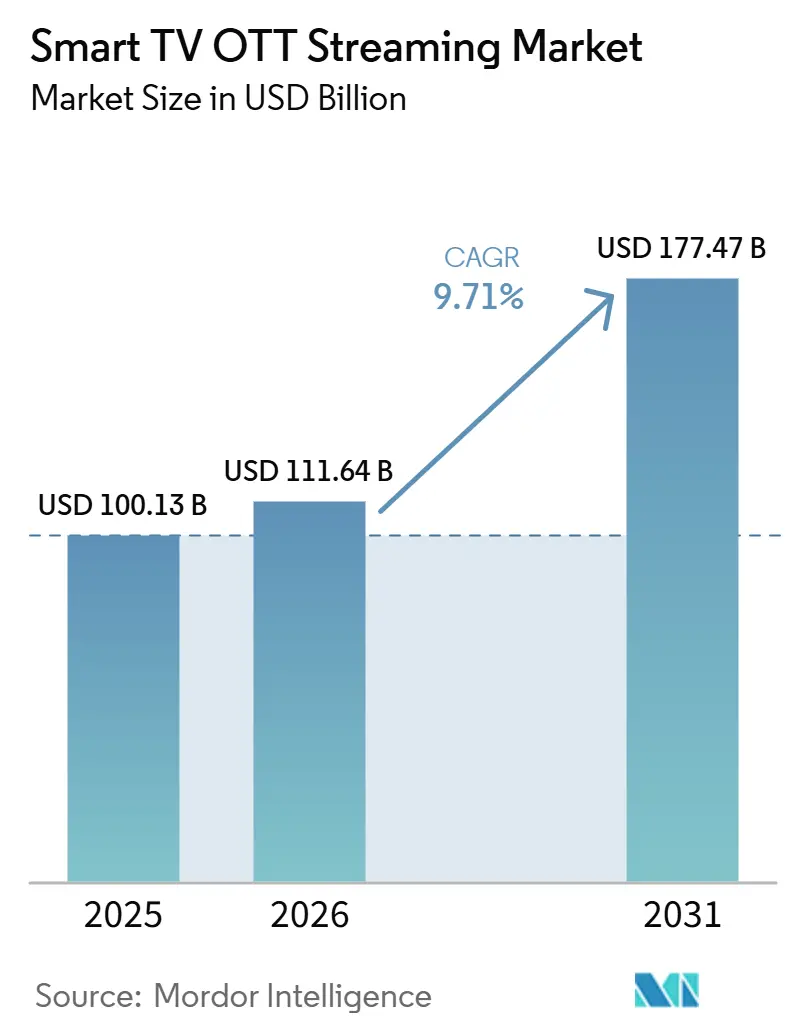
The Smart TV OTT streaming market size was valued at USD 100.13 billion in 2025 and estimated to grow from USD 111.64 billion in 2026 to reach USD 177.47 billion by 2031, at a CAGR of 9.71% during the forecast period (2026-2031). Growth rests on stronger home broadband, wider 5G coverage, and the continuing movement of viewing time away from linear television. Streaming reached 47.5% of U.S. television viewing in December 2025, after exceeding broadcast and cable viewing combined in May 2025, which has supported a shift in video advertising budgets toward connected TV. Digital video advertising is expected to exceed USD 80 billion in the United States in 2026, including USD 29.3 billion in connected TV spending. The Smart TV OTT streaming market also benefits as television operating systems become distribution, advertising, and commerce platforms rather than device software alone. Preferred home-screen placement, direct audience data, and telecom bundles increasingly determine which services can acquire and retain viewers at sustainable cost.
Key Report Takeaways
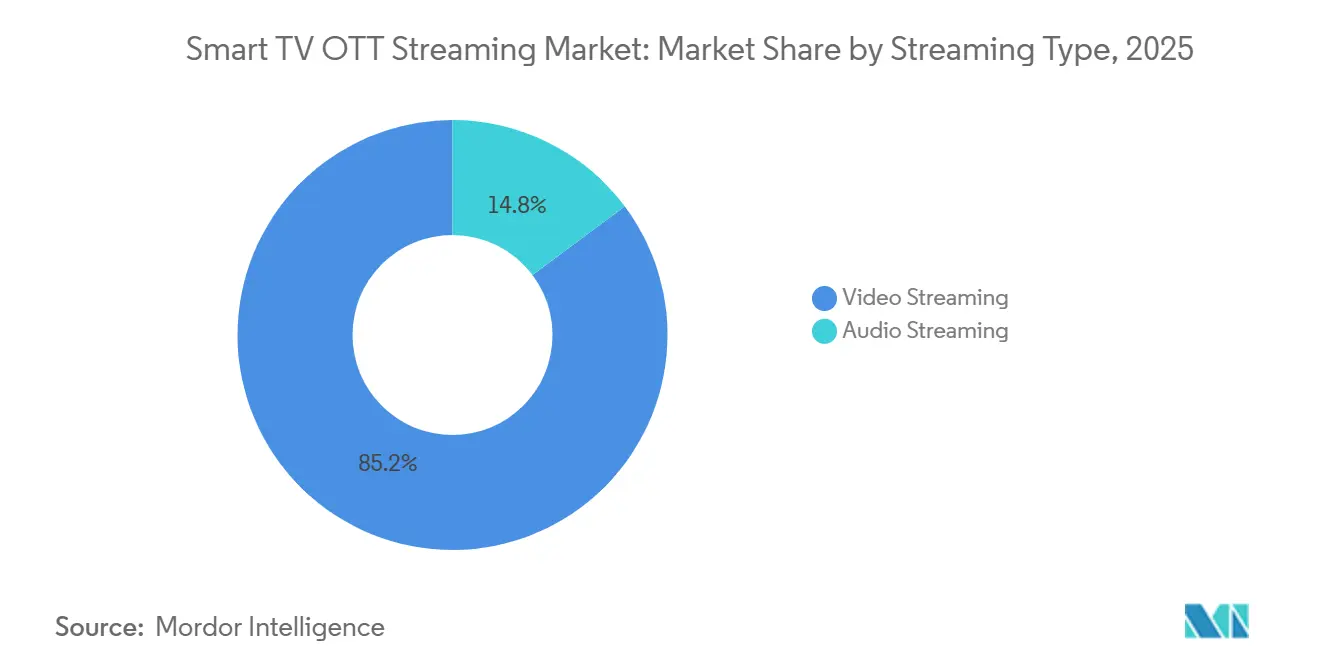
- By streaming type, video streaming led with 85.22% of Smart TV OTT streaming market share in 2025, while audio streaming is projected to expand at a 10.11% CAGR through 2031.
- By revenue model, recurring subscription billing held 45.36% of the Smart TV OTT streaming market share in 2025, while advertising-supported billing, including AVOD and FAST, is expected to record the highest CAGR of 10.57% through 2031.
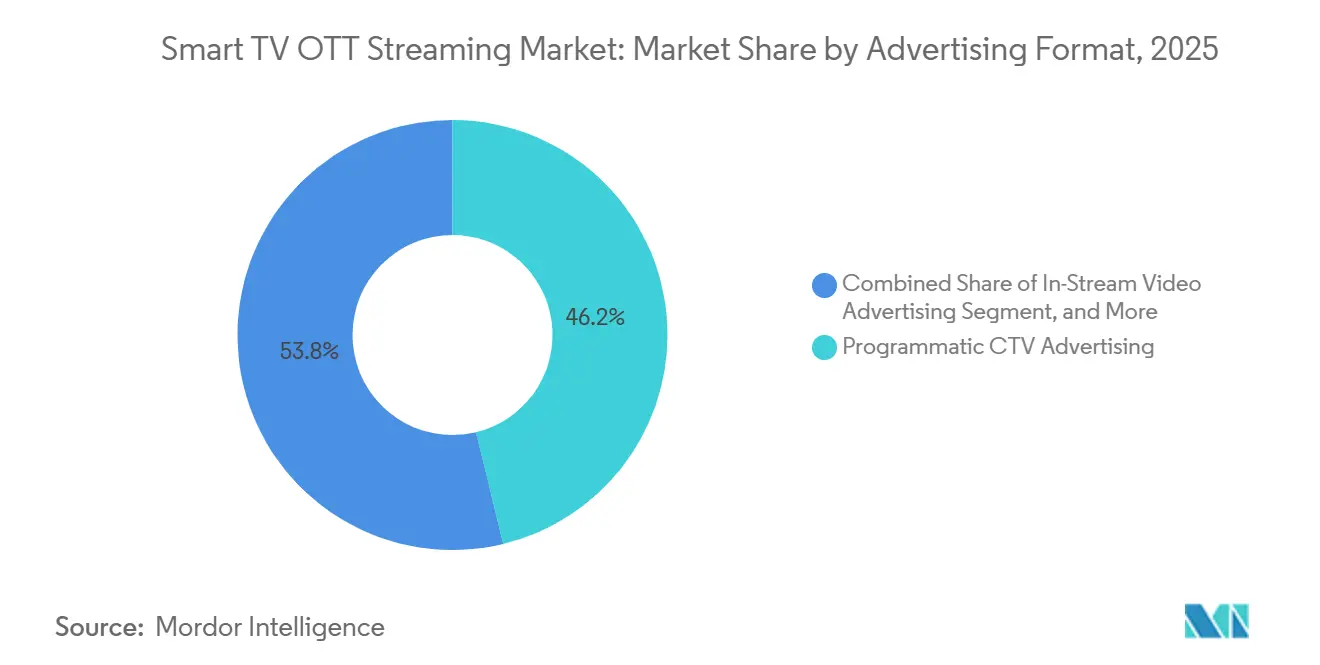
- By advertising format, programmatic CTV advertising captured 46.21% of the market in 2025, while shoppable and QR-enabled advertising is projected to grow at a 10.23% CAGR through 2031.
- By content type, TV shows and episodic content accounted for 40.54% of the market in 2025, while documentaries are forecast to expand at a 10.38% CAGR through 2031.
- By geography, North America led with 41.37% of the market in 2025, while Asia-Pacific is projected to grow at a 10.49% CAGR through 2031.
Note: Market size and forecast figures in this report are generated using Mordor Intelligence’s proprietary estimation framework, updated with the latest available data and insights as of January 2026.
Global Smart TV OTT Streaming Market Trends and Insights
Drivers Impact Analysis*
| Driver | (~) % Impact on CAGR Forecast | Geographic Relevance | Impact Timeline |
|---|---|---|---|
| High-Speed Broadband and Home Wi-Fi Expansion | +2.8% | Global, most pronounced in Asia-Pacific, South America, and Middle East | Long term (≥ 4 years) |
| FAST Channel and Ad-Supported Tier Proliferation | +2.1% | North America core, spillover to South America and Europe | Medium term (2-4 years) |
| Bundled Streaming and Telecom Distribution | +1.5% | North America and Europe | Medium term (2-4 years) |
| Cloud Gaming and Large-Screen Interactive Entertainment | +0.9% | North America and Asia-Pacific | Short term (≤ 2 years) |
| Retail-Media Convergence and Shoppable-TV Inventory | +0.7% | North America with early gains in the UK and Australia | Medium term (2-4 years) |
| Household-Level Intent Signals From TV Interface Behavior | +0.4% | North America and Europe | Long term (≥ 4 years) |
| Source: Mordor Intelligence | |||
High-Speed Broadband and Home Wi-Fi Expansion
Fiber rollout and 5G fixed wireless access support the adoption of the Smart TV OTT streaming market by improving large-screen playback at home. The International Telecommunication Union reported that internet users represent a significant majority of the global population, while 5G subscriptions account for a substantial share of mobile broadband connections. 5G networks cover more than half of the global population, although access remains much higher in high-income economies than in low-income economies.[1]International Telecommunication Union, “Facts and Figures 2025,” International Telecommunication Union, itu.int The Federal Communications Commission reported in May 2025 that 96% of U.S. homes and small businesses had access to 5G mobile service.[2]Federal Communications Commission, “Broadband Data Collection Shows Access to High-Speed Internet Services,” Federal Communications Commission, fcc.gov Continued investment in fiber and fixed wireless networks supports the wider availability of household connections suited to sustained television streaming. Better home connections reduce buffering and encourage longer smart TV sessions, which expands the advertising inventory available to platform operators and makes smart television viewing more reliable for services that depend on uninterrupted playback.
FAST Channel and Ad-Supported Tier Proliferation
FAST and ad-supported tiers have become central to revenue growth in the Smart TV OTT streaming market. Amagi reported strong year-over-year growth in global FAST viewing hours and ad impressions, based on a broad base of FAST channel deliveries. Its survey also found that most senior FAST operators viewed reformatting metadata across platforms as a major operational burden, while many said poor metadata reduced revenue or content visibility. The IAB expects digital video to account for a majority share of U.S. television and video advertising spending for the first time. It also expects U.S. connected TV advertising spending to continue growing year over year. These conditions favor operators that can manage content metadata, ad decisioning, and distribution across several platforms. The Smart TV OTT streaming market therefore gives an advantage to scaled services with effective content-management systems.
Bundled Streaming and Telecom Distribution
Telecom bundles are changing subscriber acquisition and retention economics for the Smart TV OTT streaming market. Comcast expanded its Xfinity StreamSaver marketplace with multiple bundle configurations that combine Peacock, Netflix, Apple TV, the Disney+ and Hulu bundle, and HBO Max. The offering advertised notable savings, which can reduce household churn while deepening the use of services included in the bundle. Charter and Comcast also signed a multiyear agreement with T-Mobile for mobile services that launched later. Apple joined Roku Premium Subscriptions in March 2026 after its late-2024 agreement with Amazon Prime Video Channels, showing that even established content owners use third-party storefronts to broaden reach. Services without telecom or storefront agreements face a less favorable route to viewers because operating-system providers control prominent placement on television home screens.
Cloud Gaming and Large-Screen Interactive Entertainment
Cloud gaming expands smart TV use beyond video and can raise daily engagement on the Smart TV OTT streaming market. Microsoft announced at CES 2026 that Xbox Cloud Gaming would come to select Hisense V homeOS devices and TCL Google TV-powered X11L televisions through over-the-air updates. The announcement followed earlier integrations with Samsung in 2022, Amazon Fire TV in December 2024, and LG in April 2025.[3]LG Electronics, “LG Brings Xbox Cloud Gaming Beta Experience Directly to LG Smart TV Screens,” LG Electronics, lg.com NVIDIA expanded GeForce NOW to Amazon Fire TV devices in February 2026, adding console-free gaming access across Fire TV sticks and compatible television models. These integrations give operating-system providers more daily use cases and more potential advertising inventory outside standard viewing hours. Platforms that do not secure comparable gaming partnerships may face a widening engagement gap over device replacement cycles. The Smart TV OTT streaming industry can therefore see gaming partnerships as a near-term platform differentiator rather than a separate entertainment category.
Restraints Impact Analysis*
| Restraint | (~) % Impact on CAGR Forecast | Geographic Relevance | Impact Timeline |
|---|---|---|---|
| Fragmented TV Operating-System Ecosystems | -1.9% | Global, most acute in Europe and Asia-Pacific | Long term (≥ 4 years) |
| Privacy, Consent, and Automatic Content Recognition Constraints | -1.4% | North America and Europe | Medium term (2-4 years) |
| Streaming Stick Substitution and Extended TV Replacement Cycles | -0.8% | North America and Europe | Medium term (2-4 years) |
| App-Porting Friction From Chipset, Codec, and Remote-Control Variability | -0.5% | Global | Short term (≤ 2 years) |
| Source: Mordor Intelligence | |||
Fragmented TV Operating-System Ecosystems
Operating-system fragmentation limits distribution efficiency across the Smart TV OTT streaming market. A service seeking reach across North America, Europe, and Asia-Pacific must maintain certification across 5 to 7 operating-system environments with different app stores, application interfaces, advertising tools, and technical requirements. That work creates revenue-sharing obligations and development costs that can reduce the funds available for content investment, especially for providers without a broad technical support base. The European Digital Markets Act also affects the policy setting for television operating-system providers. European broadcasters asked competition authorities in March 2026 to assess Android TV, Amazon Fire OS, and Samsung Tizen as potential gatekeepers, which could lead to requirements for nondiscriminatory application placement and interoperability. Ownership changes above the operating-system layer could add another form of access control, as retail and broadcast groups invest in advertising technology and connected TV platforms. This environment remains more favorable to providers that combine operating systems, audience data, advertising tools, and content access.
Privacy, Consent, and Automatic Content Recognition Constraints
Privacy requirements create a material compliance issue for the Smart TV OTT streaming market because automatic content recognition can capture viewing data across applications, HDMI inputs, gaming consoles, and live broadcasts. Researchers reported that this technology can remain active even when televisions are used as external monitors, which increases the relevance of consent controls at the device level. The Texas Attorney General sued Samsung, Sony, LG, Hisense, and TCL in 2025 over alleged data collection without meaningful consumer consent. The action resulted in a temporary restraining order against Samsung in Texas, while related class actions extended into other states. A move from opt-out settings to clear opt-in consent could reduce the audience available for ACR-based behavioral targeting. This would weaken the targeting premium associated with connected TV advertising and could favor platform operators that rely on first-party data gathered through direct viewer relationships. The Smart TV OTT streaming market faces a higher need for transparent consent design as enforcement expands.
*Our forecasts treat driver/restraint impacts as directional, not additive. The impact forecasts reflect baseline growth, mix effects, and variable interactions.
Segment Analysis
By Streaming Type: Video Retains Scale While Audio Use Broadens
Video streaming held 85.22% of the Smart TV OTT streaming market in 2025. Smart televisions are designed for large-format video delivery, which supports viewing of live sports, scripted programs, and nonfiction content. The ongoing transfer of programming from linear television to streaming services has added more video inventory to connected screens. Video also benefits from the established use of television sets for shared household viewing. These conditions keep video as the central source of platform viewing hours.
Audio streaming is projected to grow at a 10.11% CAGR through 2031. Smart TVs increasingly serve as home hubs for music, podcasts, and audiobooks during periods when video is not playing. Podcast services are also developing video-based formats that suit a living-room screen and use television audio systems more fully. Audio can create a pathway to later video viewing during the same household session. Operators that aggregate audio and video within one interface can use this behavior to build engagement across formats.



By Revenue Model: Subscriptions Lead While Ad-Supported Services Grow Faster
Recurring subscription billing held 45.36% of the Smart TV OTT streaming market in 2025. Premium originals, exclusive sports rights, and ad-free viewing support subscription demand despite wider consumer concern about managing several paid services. SVOD platforms can retain value when they offer content unavailable through competing services. Transactional billing serves time-specific demand for premium film releases and major live sports events. Hybrid models cover services shifting between subscription-led and advertising-led approaches.
Advertising-supported billing, including AVOD and FAST, is projected to grow at a 10.57% CAGR from 2026 to 2031. It responds to price-sensitive households and provides advertisers with a route into connected television audiences that may not be reached through conventional television schedules. The IAB found that 54% of incremental connected TV investment in 2026 came directly from linear television budget reallocation. Telecom bundles can improve household penetration, but discounts of 30% to 45% may reduce effective revenue per subscriber for services included in them, so the Smart TV OTT streaming market size for AVOD and FAST is supported by advertiser demand while margins remain sensitive to bundle terms. Operators must balance scale, ad load, revenue sharing, and the quality of the viewer experience as these models mature.
By Advertising Format: Programmatic Buying Leads While Shoppable Formats Develop
Programmatic CTV advertising held 46.21% of the Smart TV OTT streaming market in 2025. Automated buying gives advertisers audience-level targeting and impression-level measurement that are not available through conventional daypart television buying. A 2026 survey from Premion and Advertiser Perceptions found that 50% of CTV and OTT advertising was expected to be purchased programmatically in 2026. In-stream video advertising remains useful for negotiated premium placements. Branded content and sponsorships offer deeper creative placement in programs with established audiences.
Shoppable and QR-enabled advertising is projected to grow at a 10.23% CAGR through 2031. Samsung Ads and Amazon Ads introduced remote-enabled interactive video functions in Samsung TV Plus in 2026, allowing viewers to add products to carts or transfer actions to mobile devices. YouTube reported that QR code integration in shoppable connected TV advertising increased conversions by more than 100%. The IAB identified limited shoppable formats as an end-of-journey barrier for 35% of connected TV advertisers in 2026. Current growth is constrained by the supply of usable formats, clear measurement, and advertiser interest, while commerce functions can add value when they give viewers a simple choice and do not interrupt the program.
By Content Type: Episodic Programming Anchors Viewing While Documentaries Advance
TV shows and episodic content held 40.54% of the Smart TV OTT streaming market in 2025. Binge viewing supports this position because recommendation systems and multi-episode releases encourage viewers to continue within a series. Episodic programs also give platforms a repeatable basis for subscriber retention and advertising reach. Movies and films play a complementary role across subscription and transactional offerings. Shorter theatrical windows have added premium film content to streaming services sooner after cinema release.
Documentaries are projected to grow at a 10.38% CAGR through 2031. True crime, investigative journalism, and premium nature programming suit long-form viewing on television screens with strong audio and picture quality. Ionic Studios invested in Documentary+ in 2026, and the service distributed programming through Roku, Apple TV, Amazon Fire TV, LG, and Samsung TV Plus. Live sports simulcasts and interactive formats also benefit from high advertiser interest because the IAB found that 93% of connected TV buyers considered live content more valuable than other digital video inventory in 2026. The Smart TV OTT streaming industry can support premium pricing where high-attention content is matched with relevant advertising options.
Geography Analysis
North America held 41.37% of the regional total in 2025. Mature broadband networks, high smart TV adoption, and the movement of linear television budgets toward programmatic connected TV supported the region. U.S. connected TV advertising spending is expected to reach USD 29.3 billion in 2026, while digital video spending is projected to rise from USD 39.0 billion in 2021 to USD 81.9 billion in 2026. Comcast expanded StreamSaver in April 2026 by adding Disney+, Hulu, and HBO Max to bundles that already included Peacock, Netflix, and Apple TV, reinforcing telecom-led aggregation and closer links between streaming services and household broadband subscriptions. Canada and Mexico also contribute to regional demand, with Mexico providing room for FAST services among households moving from pay television to ad-supported options.
Asia-Pacific is projected to grow at a 10.49% CAGR through 2031. India had more than 1.45 billion OTT monthly active users in 2025, a 20% increase over 3 years, supported by cricket rights and competition among JioHotstar, ZEE5, SonyLIV, and Amazon. Paid streaming accounts across Indonesia, Thailand, the Philippines, Malaysia, and Singapore rose 19% year over year to exceed 61 million in 2025, while Vietnam and the Philippines are developing through AVOD and FAST-led consumption. Japan and South Korea contribute mature audiences with established smart TV and local-content ecosystems. The Asia Video Industry Association projected online video revenue in Asia-Pacific at USD 70 billion in 2025, with China, Japan, Australia, South Korea, and India generating 88% of that value.
Europe remains important because high smart TV penetration is combined with multilingual content needs and detailed regulation, and Germany, the UK, France, Italy, and Spain are the 5 largest European markets where free-to-air digital services and public broadcaster streaming compete for subscription and FAST viewing. South America recorded the fastest FAST growth in 2026, with viewing hours up 190% year over year and ad impressions up 124%, led by price-sensitive households in Brazil, Argentina, and Chile. Saudi Arabia and the UAE support premium smart TV adoption in the Middle East, and LG Channels launched a Korean entertainment cluster in the UAE in July 2026. Africa is earlier in its development, but CANAL+ and Samsung began pre-installing DStv Stream on new Samsung smart TVs across 18 African countries in June 2026, creating a direct streaming entry point in markets that did not have broad pay-TV infrastructure.

Competitive Landscape
The Smart TV OTT streaming market is moderately concentrated at the hardware and platform level, while content and advertising remain fragmented. Samsung Electronics, LG Electronics, TCL Technology, Hisense, and Sony use platform strategies that convert device sales into recurring advertising and subscription revenue. Samsung TV Plus exceeded 100 million monthly active users, according to Samsung, and LG Channels reached more than 5,000 channels in 37 countries in July 2026. These services give device makers direct viewer relationships and a route to monetize home-screen discovery, advertising inventory, and subscriptions over the device life cycle.
Retail and broadcast groups are expanding into the operating-system and advertising layer. Walmart acquired streaming advertising technology company Vibe.co for USD 1.4 billion in 2026, broadening the connection between retail purchase data and television advertising. Fox Corporation announced an agreement in July 2026 to acquire Roku for USD 22 billion, combining its live sports, news, entertainment, and Tubi service with Roku's connected TV platform and more than 100 million global streaming households. Roku reported net income of USD 88.4 million on USD 4.74 billion of revenue in 2025, and Fox expects USD 400 million in annual run-rate cost synergies with accretion by 2029. The Smart TV OTT streaming market is drawing capital from companies whose main assets are retail data, content rights, or ad technology, and operating-system control can shape how these assets are combined.
TCL and Sony signed definitive agreements on March 31, 2026, for a home-entertainment joint venture expected to begin operations in April 2027, subject to regulatory approvals. The arrangement combines Sony's premium brand with TCL's manufacturing scale and may increase competition in premium televisions. Samsung partnered with Glance in June 2026 to introduce an agentic commerce experience on Tizen OS for 2020 and later Samsung television models in the United States, connecting viewing environments with shopping actions and cart-level attribution for advertisers. Samsung also partnered with KT Studio Genie in 2025 to bring Genie TV Originals to Samsung TV Plus across 30 countries without a subscription fee. The Smart TV OTT streaming industry is moving toward competition based on audience access, direct commerce, content supply, and distribution control.
Smart TV OTT Streaming Industry Leaders
Samsung Electronics Co., Ltd.
Alphabet Inc.
Roku, Inc.
LG Electronics Inc.
Amazon.com, Inc.
- *Disclaimer: Major Players sorted in no particular order

Recent Industry Developments
- July 2026: Fox Corporation announced a definitive agreement to acquire Roku, Inc. for approximately USD 22 billion, combining Fox's live sports, news, entertainment, and Tubi FAST service with Roku's connected TV platform and more than 100 million global streaming households. Roku reported its first full-year profit in 2025, with net income of USD 88.4 million on revenue of USD 4.74 billion, up 15% year over year. Fox expects approximately USD 400 million in annual run-rate cost synergies and deal accretion by 2029.
- June 2026: Glance, InMobi's consumer technology subsidiary, launched a first-to-market agentic commerce experience built natively on Samsung's Tizen OS on all 2020 and later Samsung TV models in the U.S., turning the living-room screen into a generative-AI-powered shopping environment with cart-level attribution for brands and advertisers.
- May 2026: Roku launched FOX One as a Premium Subscription on The Roku Channel in the U.S., bringing live and on-demand access to FOX news, sports, and entertainment. The addition expanded Roku's Premium Subscriptions catalog to more than 70 services, consolidating its subscription aggregator role ahead of the Fox acquisition.
- April 2026: Comcast's Xfinity launched an expanded StreamSaver marketplace, adding Disney+/Hulu and HBO Max alongside Peacock, Netflix, and Apple TV, creating 8 bundle configurations at savings of up to 45% and establishing Xfinity StreamStore as the largest telecom-anchored streaming bundle marketplace in the U.S.


Global Smart TV OTT Streaming Market Report Scope
Smart TV OTT Streaming Market refers to the ecosystem of over-the-top video services delivered directly on internet-connected smart televisions. It includes subscription, ad-supported, and transactional streaming apps accessed through built-in TV operating systems and connected TV interfaces.
The Smart TV OTT Streaming Market Report is Segmented by Streaming Type (Video Streaming, and Audio Streaming), Revenue Model (Recurring Subscription Billing (SVOD), Transactional Billing (TVOD/PPV), Advertising-Supported Billing (AVOD/FAST), and Hybrid Monetization Billing), Advertising Format (In-Stream Video, Programmatic CTV, Branded Content, Shoppable/QR), Content Type (Movies and Films, TV Shows and Episodic Content, and Documentaries), and Geography (North America, South America, Europe, Asia-Pacific, Middle East, and Africa). The Market Forecasts are Provided in Terms of Value (USD).
| Video Streaming |
| Audio Streaming |
| Recurring Subscription Billing (SVOD) |
| Transactional Billing (TVOD/PPV) |
| Advertising-Supported Billing (AVOD/FAST) |
| Hybrid Monetization Billing |
| In-Stream Video Advertising |
| Programmatic CTV Advertising |
| Branded Content and Sponsorships |
| Shoppable, and QR-Enabled Advertising |
| Movies and Films |
| TV Shows and Episodic Content |
| Documentaries |
| Other Content Types |
| North America | United States |
| Canada | |
| Mexico | |
| South America | Brazil |
| Argentina | |
| Chile | |
| Rest of South America | |
| Europe | Germany |
| United Kingdom | |
| France | |
| Italy | |
| Spain | |
| Russia | |
| Rest of Europe | |
| Asia-Pacific | China |
| India | |
| Japan | |
| South Korea | |
| Southeast Asia | |
| Australia and New Zealand | |
| Rest of Asia-Pacific | |
| Middle East | Saudi Arabia |
| United Arab Emirates | |
| Turkey | |
| Rest of Middle East | |
| Africa | South Africa |
| Nigeria | |
| Egypt | |
| Rest of Africa |
| By Streaming Type | Video Streaming | |
| Audio Streaming | ||
| By Revenue Model | Recurring Subscription Billing (SVOD) | |
| Transactional Billing (TVOD/PPV) | ||
| Advertising-Supported Billing (AVOD/FAST) | ||
| Hybrid Monetization Billing | ||
| By Advertising Format | In-Stream Video Advertising | |
| Programmatic CTV Advertising | ||
| Branded Content and Sponsorships | ||
| Shoppable, and QR-Enabled Advertising | ||
| By Content Type | Movies and Films | |
| TV Shows and Episodic Content | ||
| Documentaries | ||
| Other Content Types | ||
| By Geography | North America | United States |
| Canada | ||
| Mexico | ||
| South America | Brazil | |
| Argentina | ||
| Chile | ||
| Rest of South America | ||
| Europe | Germany | |
| United Kingdom | ||
| France | ||
| Italy | ||
| Spain | ||
| Russia | ||
| Rest of Europe | ||
| Asia-Pacific | China | |
| India | ||
| Japan | ||
| South Korea | ||
| Southeast Asia | ||
| Australia and New Zealand | ||
| Rest of Asia-Pacific | ||
| Middle East | Saudi Arabia | |
| United Arab Emirates | ||
| Turkey | ||
| Rest of Middle East | ||
| Africa | South Africa | |
| Nigeria | ||
| Egypt | ||
| Rest of Africa | ||


Key Questions Answered in the Report
What is the Smart TV OTT streaming market size?
The Smart TV OTT streaming market size is estimated at USD 111.64 billion in 2026 and is forecast to reach USD 177.47 billion by 2031, at a 9.71% CAGR. The estimate reflects growth in streaming use, ad-supported viewing, and connected television services.
What is driving smart TV OTT streaming growth?
Broadband expansion, 5G availability, FAST viewing, telecom bundles, and connected TV advertising are supporting growth. Better household connectivity also supports longer large-screen sessions and more advertising opportunities.
Which streaming type accounts for the largest share?
Video streaming held 85.22% of the market in 2025 because smart televisions remain primarily large-screen video devices. Sports, scripted programs, films, and nonfiction content continue to move from linear television to streaming services.
Which revenue model is growing the fastest?
Advertising-supported billing, including AVOD and FAST, is projected to grow at a 10.57% CAGR through 2031. The model serves price-sensitive households and gives advertisers targeted inventory on connected television screens.
Which region is growing the fastest?
Asia-Pacific is projected to grow at a 10.49% CAGR through 2031, supported by expanding use across India and Southeast Asia. India, Japan, South Korea, and the Southeast Asian markets each contribute through different stages of adoption.
How are television operating systems shaping competition?
Operating systems control home-screen placement, advertising tools, audience data, subscriptions, and increasingly commerce features. Services without distribution agreements can face higher technical, commercial, and discovery barriers across several platforms.
Page last updated on:





