
Smart Sports Equipment Market Size and Share
Market Overview
| Study Period | 2022 - 2032 |
|---|---|
| Market Size (2027) | USD 4.23 Billion |
| Market Size (2032) | USD 7.26 Billion |
| Growth Rate (2027 - 2032) | 11.41 % |
| Fastest Growing Market | North America |
| Largest Market | Asia-Pacific |
| Market Concentration | Medium |
Major Players *Disclaimer: Major Players sorted in no particular order Image © Mordor Intelligence. Reuse requires attribution under CC BY 4.0. | |
Smart Sports Equipment Market Analysis by Mordor Intelligence
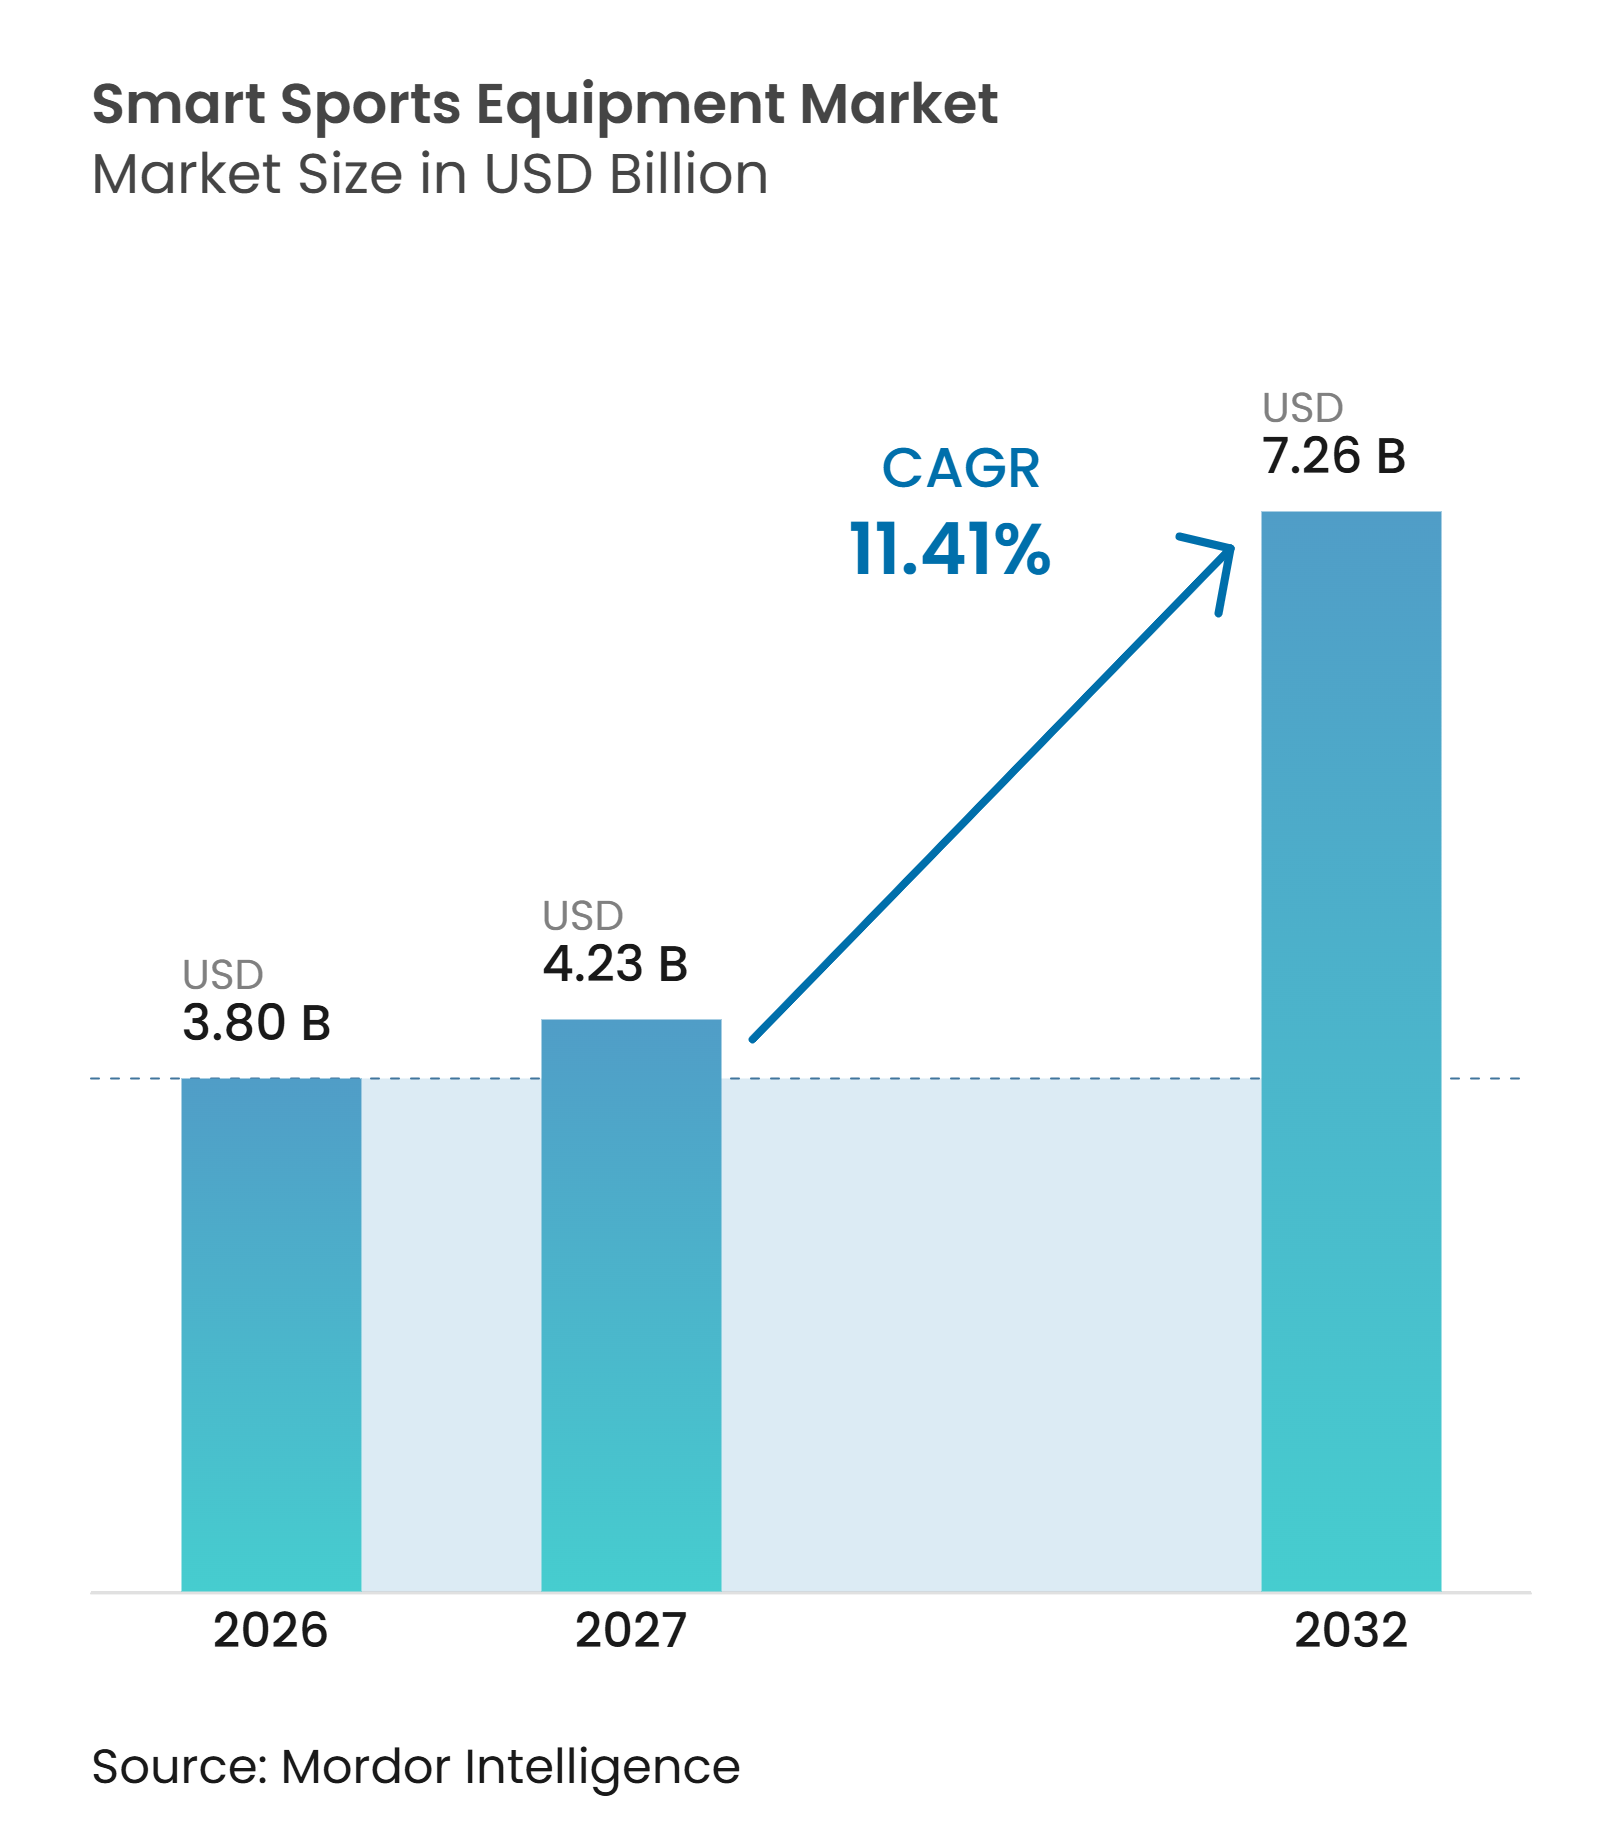
The smart sports equipment market size was valued at USD 3.80 billion in 2026 and is estimated to grow from USD 4.23 billion in 2027 to reach USD 7.26 billion by 2032, at a CAGR of 11.41% during the forecast period (2027–2032). The market is benefiting from smaller sensors, real-time analytics, and lower hardware costs, which make connected products more accessible to athletes and teams. AI-supported coaching is becoming more practical as hardware combines motion data with training recommendations, while growing youth participation is expanding the base of potential buyers. A 2025 report by the National Library of Medicine found that convolutional neural networks achieved 94% agreement with international experts in technique assessment, indicating why data-driven coaching is drawing interest from performance programs[1]. The market also faces constraints from premium pricing, subscription fatigue, short battery life, and biometric data requirements, which can slow adoption outside professional and higher-income segments. Competition remains fragmented, but acquisitions and partnerships are giving larger technology providers broader capabilities in tracking, video, and analytics.
Key Report Takeaways
-
By product type, smart golf equipment held 29.80% of the 2026 smart sports equipment market share, while smart balls are forecast to grow at a 12.89% CAGR through 2032.
-
By sport, golf accounted for 38.19% of the smart sports equipment market size in 2026, while football is projected to advance at a 12.83% CAGR through 2032.
-
By distribution channel, franchise stores represented 45.11% of the 2026 market, while online retail stores are expected to record a 14.16% CAGR through 2032.
-
By geography, Asia-Pacific held 24.02% of the 2026 market, while North America is forecast to expand at a 12.88% CAGR through 2032.
Note: Market numbers in this report are based on Mordor Intelligence's proprietary estimation framework, which combines nine months of actuals with Q4 projections for base year 2026.
Market Trends and Insights
Drivers Impact Analysis of Smart Sports Equipment Market*
| Driver | (~) % Impact on CAGR Forecast | Geographic Relevance | Impact Timeline |
|---|---|---|---|
| Expansion of AI-assisted coaching and biomechanics | +2.5% | Global; North America and European Union leading adoption | Medium-term (2-4 years) |
| Rising participation in sports and recreational fitness activities | +1.8% | Global; Asia-Pacific core, North America secondary | Short-term (≤2 years) |
| Growth of connected fitness and at-home training | +1.5% | North America, Europe, Asia-Pacific | Short-term (≤2 years) |
| Embedded sensors enabling sport-specific data products | +2.0% | Global | Medium-term (2-4 years) |
| Expansion of youth sports academies and grassroots sports programs | +1.2% | Asia-Pacific core, spill-over to Middle East and Africa and South America | Medium-term (2-4 years) |
| Injury prevention, rehabilitation, and training-load management | +1.0% | North America and European Union | Long-term (≥4 years) |
| Source: Mordor Intelligence | |||
Expansion of AI-Assisted Coaching and Biomechanics
The growing adoption of performance-monitoring technologies and AI-based biomechanical analysis is driving demand for smart sports equipment. These technologies let athletes move beyond basic performance tracking to data-driven skill development. The NCAA's 2025 performance technology study found that 72% of male and 55% of female student-athletes believed performance technologies had positively affected their athletic performance[2]. As these technologies become more accessible and affordable, their adoption is expanding across both professional and amateur sports. These developments are encouraging the integration of accelerometers, gyroscopes, pressure sensors, motion-capture systems, and AI analytics into smart balls, rackets, bats, and golf equipment. These systems analyze parameters such as swing mechanics, impact location, ball speed, movement patterns, and joint loading, providing personalized corrective feedback and helping coaches optimize training programs. By translating raw sensor data into actionable insights, these systems support more targeted training interventions, reduce the risk of injury, and contribute to measurable improvements in athlete performance over time.
Embedded Sensors Enabling Sport-Specific Data Products
Integrating embedded sensors into sports equipment is driving the development of sport-specific smart products that provide precise, real-time performance insights. Accelerometers, gyroscopes, pressure sensors, force sensors, and inertial measurement units (IMUs) are increasingly incorporated into balls, rackets, bats, golf clubs, and hockey sticks to capture data such as movement speed, spin, impact force, shot accuracy, swing trajectory, and contact position. Unlike general-purpose fitness trackers, these technologies measure performance directly at the equipment level, allowing athletes and coaches to assess individual techniques and identify areas for improvement. For example, sensor-enabled basketballs analyze shooting mechanics and shot trajectories, smart tennis rackets track stroke patterns and racket-head speed, while connected golf clubs and swing sensors measure swing tempo, club path, and impact consistency.
Rising Participation in Sports and Recreational Fitness Activities
Growing participation in organized sports, recreational activities, and fitness programs is expanding the potential user base for smart sports equipment, as more individuals seek to improve performance, monitor progress, and receive structured training feedback. The Sports & Fitness Industry Association (SFIA) reported that 250 million people in the United States participated in at least one sport, fitness, or outdoor activity in 2025, with team sports exceeding 90 million participants for the first time[3]. This expanding participation base supports demand for smart balls, connected rackets, sensor-enabled golf equipment, and other performance-tracking products across amateur, recreational, and professional user segments. As participation broadens beyond professional athletes, smart equipment offering accessible performance metrics, app-based coaching, and skill-development feedback is becoming increasingly relevant to recreational players and fitness enthusiasts.
Growth of Connected Fitness and At-Home Training
The growing adoption of connected fitness solutions and at-home training is expanding demand for smart sports equipment beyond professional sports facilities and organised training environments. Consumers increasingly seek convenient ways to practise sports, monitor performance, and access guided coaching without relying on continuous supervision from trainers or access to specialised facilities. Smart sports equipment, including connected basketballs, footballs, tennis rackets, golf swing analysers, and sensor-enabled training systems, supports this shift by integrating sensors, mobile applications, Bluetooth connectivity, and digital coaching platforms. These technologies allow users to track training sessions, measure performance improvements, receive technique-based feedback, and access structured practice programmes from home or recreational spaces.
Restraints Impact Analysis of Smart Sports Equipment Market*
| Restraint | (~) % Impact on CAGR Forecast | Geographic Relevance | Impact Timeline |
|---|---|---|---|
| High upfront cost and subscription fatigue | -1.5% | Global; most acute in emerging markets | Short-term (≤2 years) |
| Sensor accuracy, calibration, and cross-brand data inconsistency | -0.8% | Global | Medium-term (2-4 years) |
| Fragmented platforms, privacy requirements, and interoperability barriers | -0.9% | European Union, North America (GDPR, CCPA, state frameworks) | Medium-term (2-4 years) |
| Short battery life and frequent charging requirements | -0.6% | Global | Short-term (≤2 years) |
| Source: Mordor Intelligence | |||
High Upfront Cost and Subscription Fatigue
The relatively high purchase cost of smart sports equipment compared with conventional sporting goods remains a key barrier to wider adoption, particularly among recreational players, amateur athletes, and price-sensitive consumers. The integration of precision sensors, Bluetooth connectivity, embedded processors, specialized software, and companion applications increases manufacturing costs, resulting in premium prices for connected balls, smart rackets, golf swing analyzers, and sensor-enabled training systems. Several products also rely on paid subscriptions or premium application features to deliver advanced performance analytics, personalized coaching, historical data storage, and training programs. This creates recurring ownership costs beyond the initial purchase price and can discourage long-term usage, particularly when consumers already pay for fitness applications, coaching services, or other connected devices. Subscription fatigue, combined with uncertainty about the practical benefits of advanced analytics, may lead consumers to prefer conventional equipment or discontinue using connected products after an initial trial period. As a result, manufacturers face pressure to demonstrate measurable performance benefits, offer affordable entry-level products, and provide meaningful core functionality without mandatory recurring subscriptions.
Fragmented Platforms, Privacy Requirements, and Interoperability Barriers
The fragmented digital ecosystem surrounding smart sports equipment creates challenges for seamless data integration, limiting adoption among athletes, coaches, and sports organizations. Different manufacturers often operate proprietary applications, analytics platforms, and connectivity systems, resulting in performance data being stored across disconnected ecosystems with limited compatibility between devices and third-party coaching or fitness platforms. This restricts users from combining data generated by smart balls, connected rackets, wearable sensors, and training equipment into a unified performance profile. Additionally, differences in sensor calibration, data formats, measurement methodologies, and software interfaces can affect the consistency and comparability of performance insights across products. Data privacy and cybersecurity requirements add further complexity, as connected equipment collects personal information such as movement patterns, training history, location data, and biometric measurements. Manufacturers must implement appropriate data protection measures, consent management, secure storage, and access controls, particularly when products are used by children, student-athletes, and professional sports teams.
*Our forecasts treat driver/restraint impacts as directional, not additive. The impact forecasts reflect baseline growth, mix effects, and variable interactions.
Smart Sports Equipment Market Segment Analysis
By Product Type:
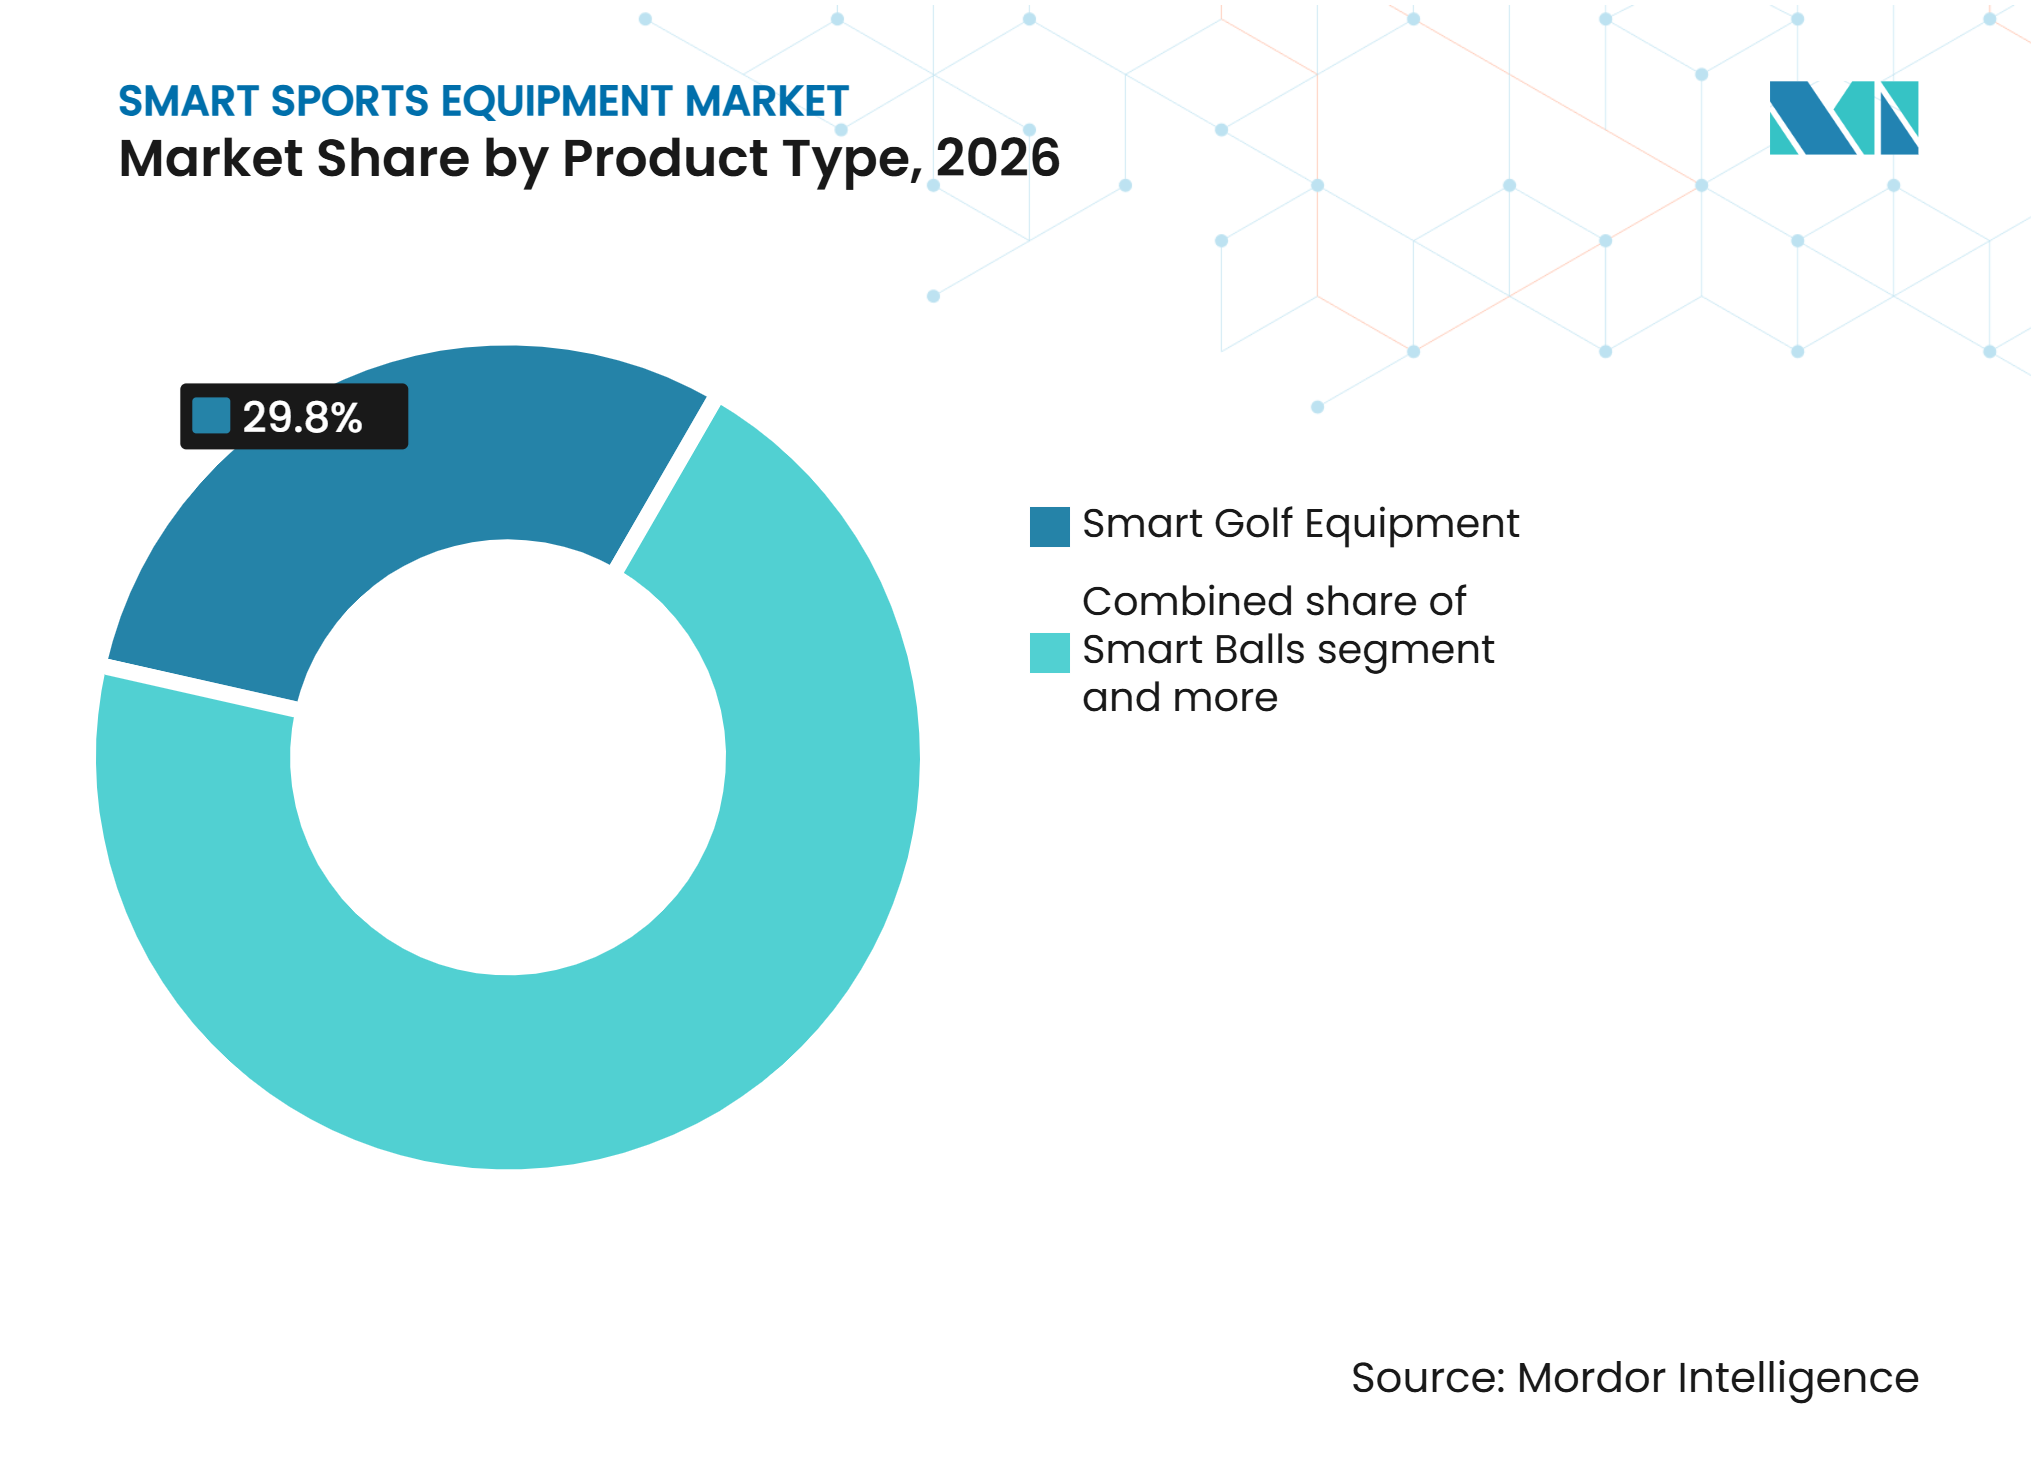
Sensor Integration Reshapes Equipment HierarchiesSmart golf equipment holds a 29.80% share of the product-type segment in 2026, reflecting golf's established culture of performance measurement and the category's higher average selling prices. This dominance is reinforced by significant manufacturer investment in AI-driven product design. Callaway's Elyte lineup, for example, was developed using 75 AI-generated prototypes and dedicated 3D printing capabilities, producing faces with 25,000 control points compared to 1,500 in the previous generation. These advancements allow manufacturers to fine-tune equipment performance at a granular level, supporting stronger value propositions for both amateur and professional golfers.
Smart balls are the fastest-growing product sub-category, projected to grow at a 12.89% CAGR through 2027–2032, driven by maturing sensor-embedding techniques and declining unit costs. Smart rackets, bats, and hockey sticks occupy the mid-tier, supported by adoption in organized leagues at both professional and scholastic levels, where certification standards create a compliance layer that benefits brands with established approval histories. Manufacturers offering product portfolios across multiple categories will hold a structural advantage in institutional tender processes, as multi-category capability reduces procurement complexity.


By Sport:
Golf Holds Value While Football Records the Highest GrowthGolf accounted for 38.19% of the smart sports equipment market in 2026, supported by premium equipment, an established user base, and widespread interest in GPS-enabled play. Growth in youth golf participation is creating a younger entry point for connected equipment. The 2025 Project Play report records golf among the sports with high youth participation gains. Basketball, tennis, and baseball each present distinct use cases rather than a shared demand pattern. Connected-ball products support basketball training, while racket analytics serves tennis users seeking feedback on stroke execution. Baseball demand is tied to ball-flight and launch-monitor data moving from professional teams to college settings. Hockey is gaining attention for stick-load and impact monitoring in injury management programs.
Football is forecast to grow at a 12.83% CAGR through 2032, driven by the adoption of player-monitoring systems across professional and grassroots programs. Clubs and federations are increasingly deploying GPS trackers, heart rate monitors, and motion sensors to optimize training loads and reduce injury risk. In October 2025, Sony acquired a majority stake in STATSports, integrating its wearable technology into Sony's sports data portfolio and signaling growing corporate interest in sports performance analytics. Athletics, rugby, and e-sports-linked use cases remain smaller but may support specialized software development where providers build sport-specific motion datasets tailored to the unique demands of each discipline.
By Distribution Channel:
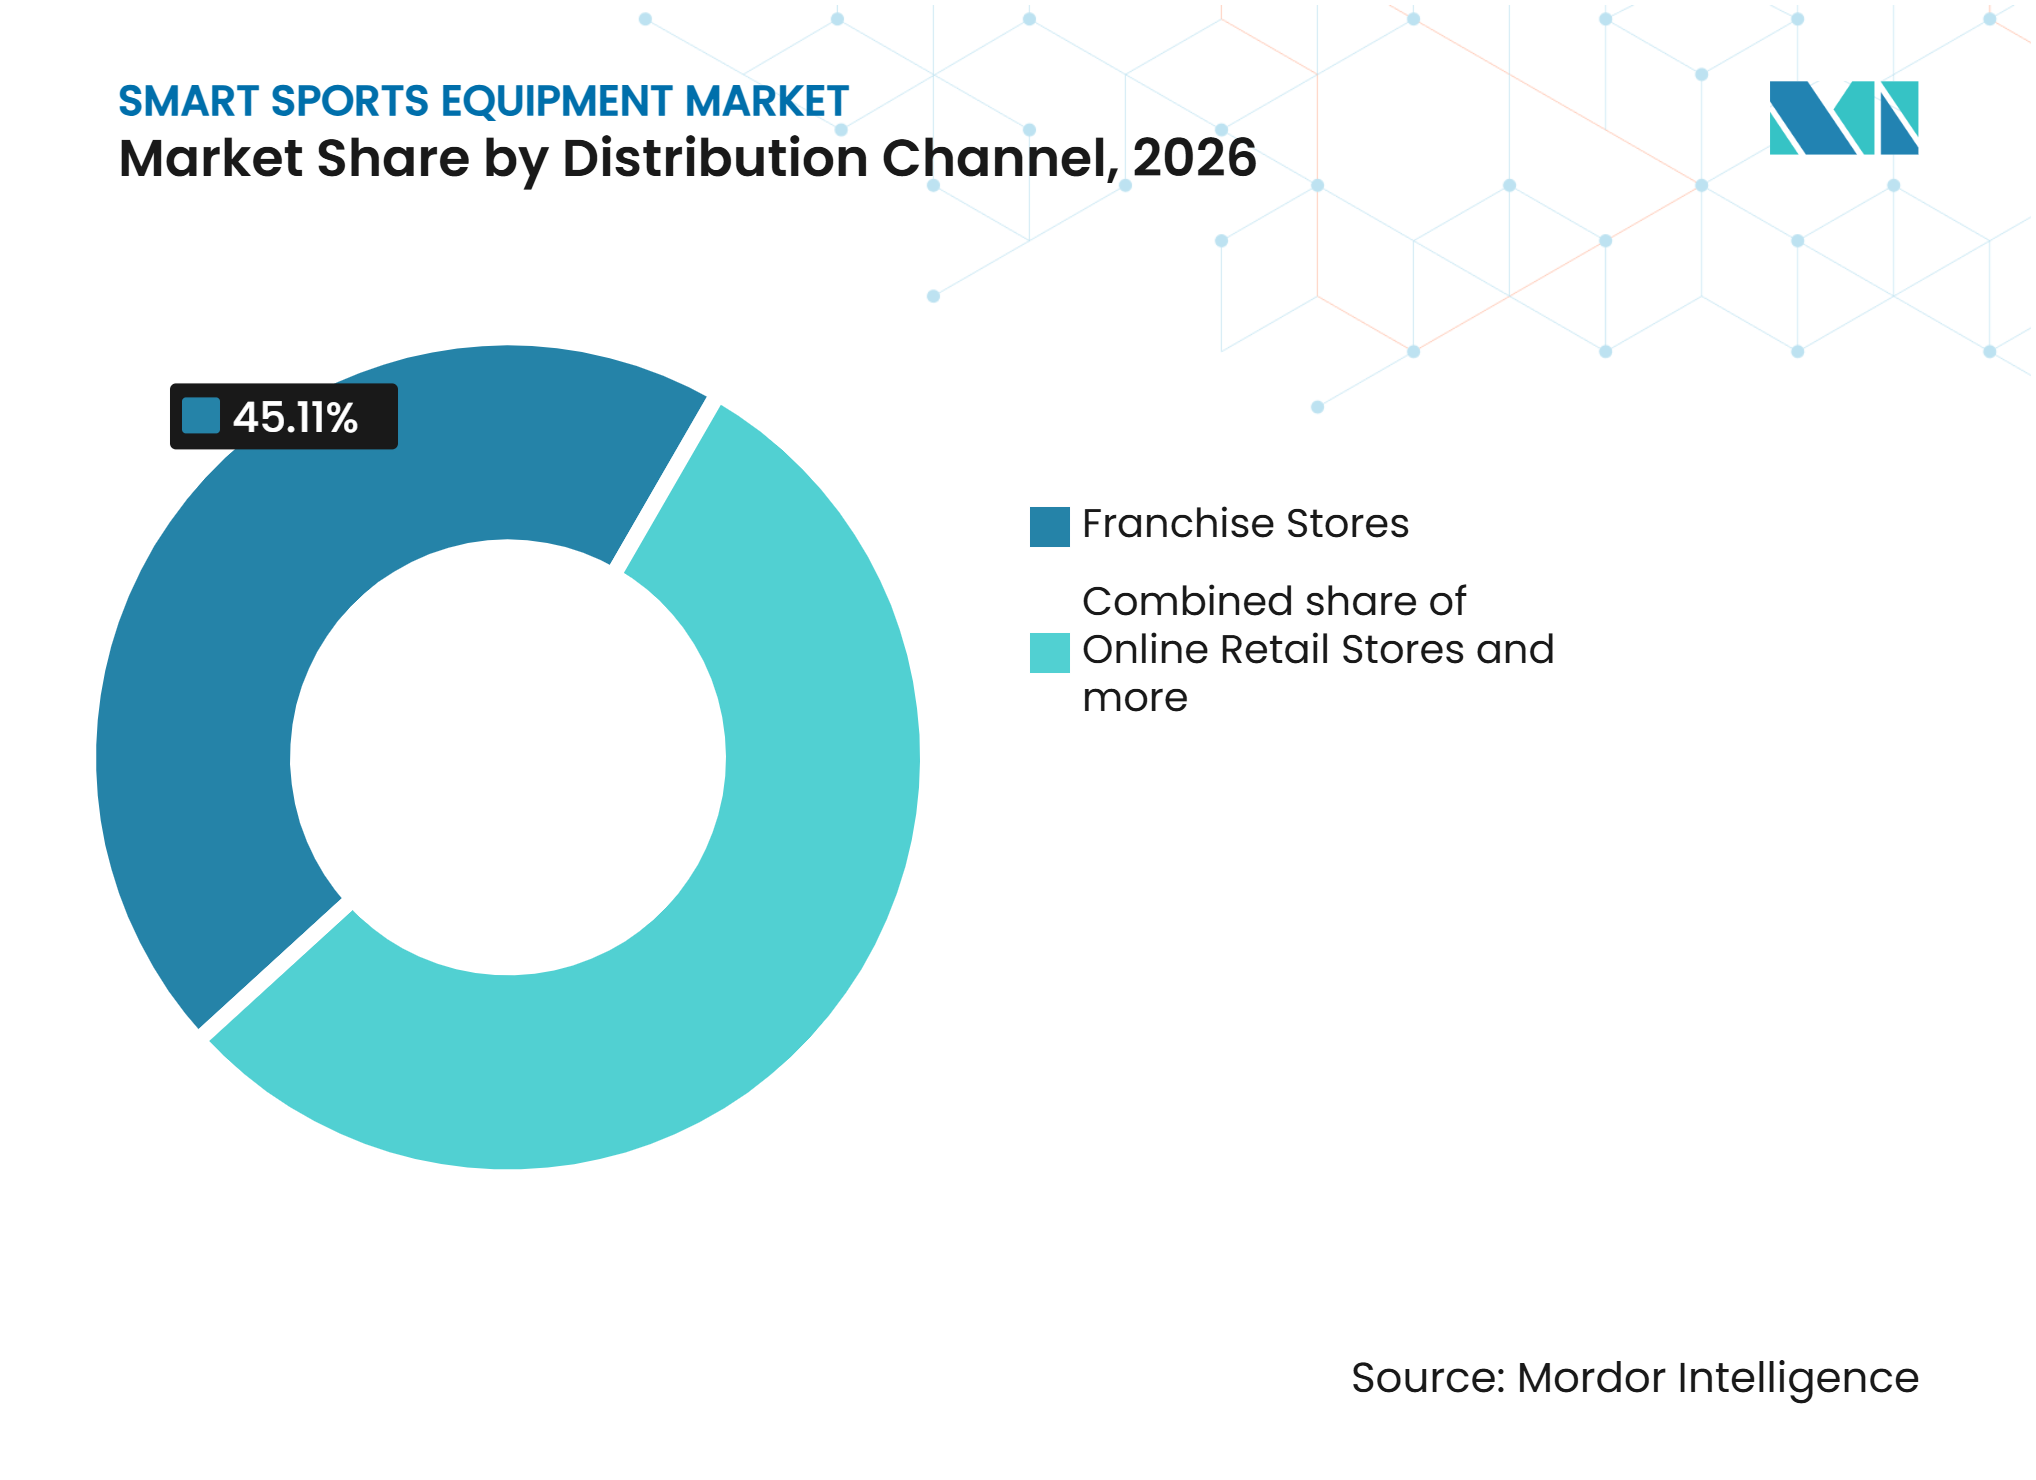
Franchise Stores Retain Scale as Online Retail Gains SpeedFranchise stores accounted for 45.11% of the 2026 value, as many premium products require demonstrations and setup support. Within the smart sports equipment market, first-time buyers often want to understand both the device and the related data application before purchasing. This is particularly relevant for sensor-based products priced between USD 300 and USD 700. Store staff can help customers select a product, explain its functions, and complete initial configuration. Company-owned stores also serve as controlled demonstration spaces for connected hardware and software, allowing brands to present the full user experience without relying solely on third-party shelf space.
Online retail stores are forecast to grow at a 14.16% CAGR through 2032, as repeat buyers become more comfortable purchasing higher-value products digitally. This pattern is evident in markets with mature e-commerce infrastructure, including South Korea and the United States. Direct institutional sales remain an important part of the other-channel category. This type of conference-wide agreement shows how clubs, academies, and federations can purchase without traditional retail channels. Institutional validation can then influence later buying decisions across smaller programs.

Geography Analysis
Asia-Pacific
Asia-Pacific accounted for 24.02% of regional value in 2026, making it the largest geographic segment in the supplied data. China and South Korea's established e-commerce infrastructure supports online purchasing of premium devices. India has growing participation in cricket, football, and badminton, which creates an early-stage base for connected products. Australia's professional leagues provide equipment benchmarks that influence schools and academies. The regional opportunity depends on aligning product prices with the financial capacity of families and institutions.
North America
North America is forecast to grow at a 12.88% CAGR through 2032. The smart sports equipment market in the region combines a large technology-development base with professional teams that can test and validate new equipment. STATSports reported that Apex 2.0 delivers more than 70 real-time metrics for organizations including the Washington Commanders and LA Dodgers. Professional validation can support equipment adoption in college, academy, and advanced consumer programs. U.S. youth participation gains in golf and tennis provide an additional demand base for connected products. Privacy compliance is a regional consideration, as providers must handle athlete data responsibly. Stronger data governance can serve as a useful product feature when teams select a vendor.
Europe, South America, and the Middle East and Africa
Europe is supported by investment in football analytics and by compliance requirements around athlete data. GDPR is an important regulatory factor for providers that process biometric and performance records. In South America, Brazil and Argentina are early adopters due to their football cultures and academy sponsorship models. South Africa and Nigeria present growth potential as mobile connectivity expands, although affordability remains a constraint. Across these regions, academy programs offer the clearest route to market for suppliers that combine credible tracking capabilities with manageable costs.
Competitive Landscape
Market Concentration
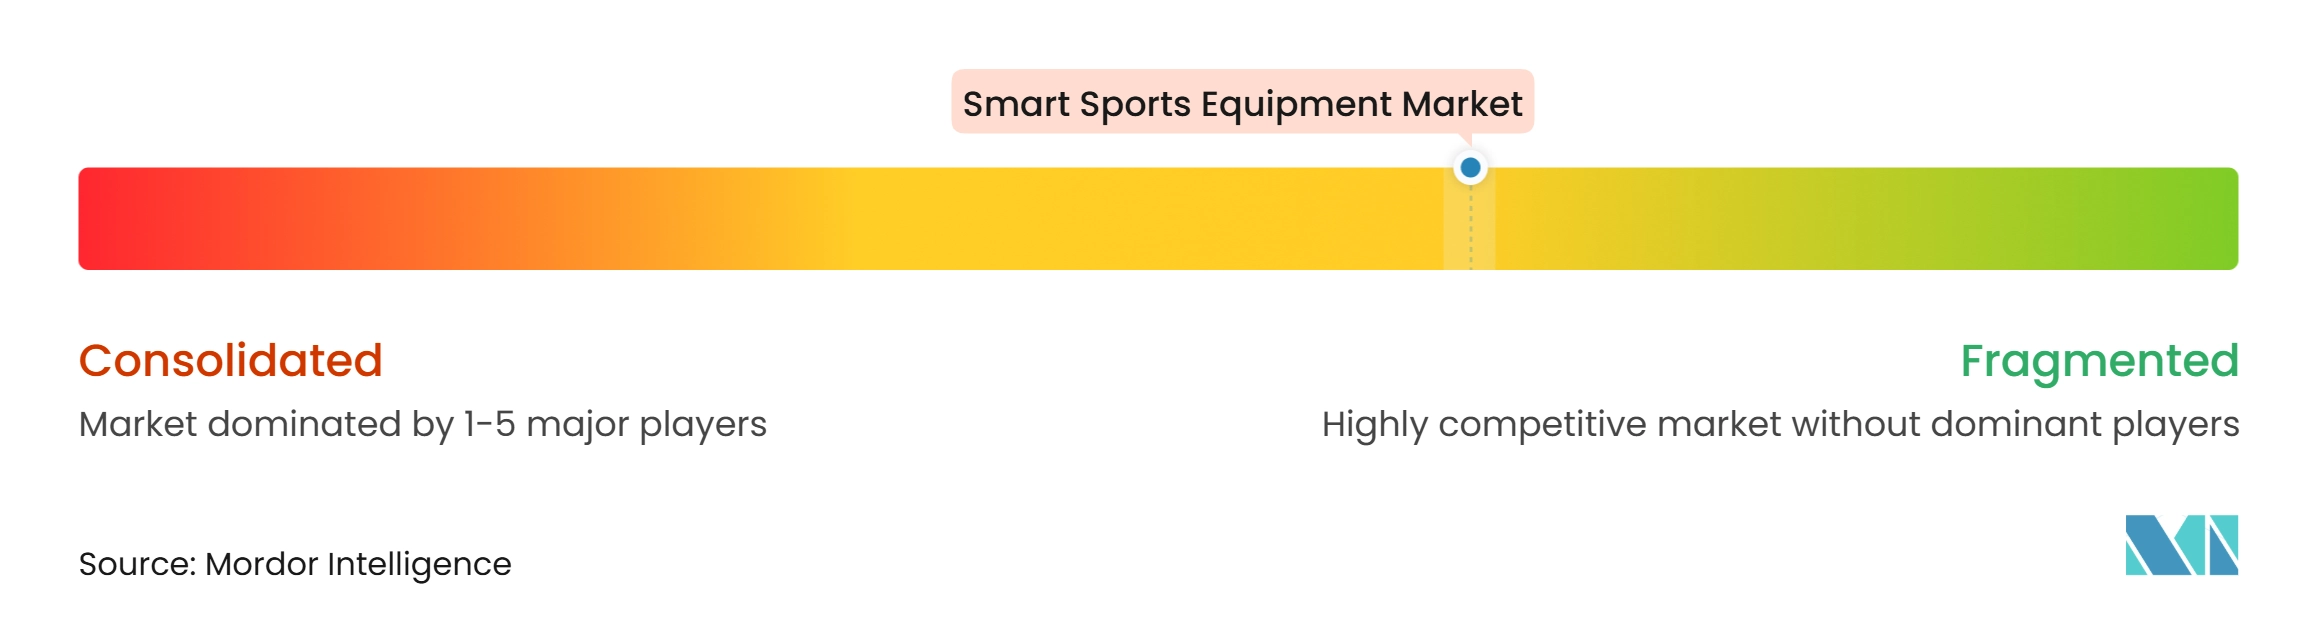
Smart sports equipment exhibits a moderately consolidated market. Companies are strengthening their competitive positions through acquisitions, partnerships, and portfolio expansion to broaden their smart equipment offerings and improve product functionality. For instance, in January 2025, Sportable acquired Intaneous, a computer vision technology company, to strengthen its sensor-enabled smart ball offering through enhanced ball tracking and data visualization capabilities. Sportable embeds sensors within sports balls to capture movement, position, and trajectory data across rugby, football, and other sports.
Similarly, Amer Sports, through its Wilson brand, Adidas AG, Babolat, and Mizuno Corporation, continues to compete through sport-specific connected equipment, product innovation, and integration of digital performance-tracking technologies. Such strategies enable manufacturers to differentiate their offerings, expand across sporting categories, and strengthen their presence among professional and recreational athletes. Smaller companies can remain competitive by building valuable data assets for a specific sport or use case. However, they face pressure when larger providers integrate tracking, video, and workflow tools into a single service offering.
Youth sports and AI-enabled coaching represent an open area, as the addressable user base is broad and specialized product offerings are still developing. Providers that build clear coaching tools without excessive platform complexity may hold an advantage with academies and families. Institutional contracts are also becoming more relevant, as they can bring a system to many athletes through a single purchasing decision. The Conference Carolinas agreement with Sports Performance Tracking is an example of this approach. Data governance will remain central where systems process sensitive biometric information. In the smart sports equipment market, suppliers that combine reliable hardware, understandable analytics, and responsible data practices are better positioned to meet the evolving needs of their users.
Smart Sports Equipment Industry Leaders
-
Adidas AG
-
Callaway Golf Company
-
Amer Sports, Inc.
-
Babolat VS S.A.
-
Blast Motion Inc. (WIN Reality)
- *Disclaimer: Major Players sorted in no particular order
Smart Sports Equipment Market Companies Covered in this Report
- Adidas AG
- Callaway Golf Company
- Amer Sports, Inc.
- Babolat VS S.A.
- Blast Motion Inc. (WIN Reality)
- Apple Inc.
- Catapult Sports Pty Ltd.
- Decathlon SE
- DribbleUp, Inc.
- EGYM, Inc.
- Garmin Ltd.
- Gridiron Technologies LLC
- HockeyShot Inc.
- Kinexon GmbH
- Nike, Inc.
- Peloton Interactive, Inc.
- Riddell Sports Group
- STATSports Group Ltd.
- Technogym S.p.A.
- Under Armour, Inc.
- WHOOP, Inc.
- Wilson Sporting Goods Co.
- Zepp Health Corporation
Recent Industry Developments in Smart Sports Equipment Market
- August 2026: LALIGA announced the deployment of connected-ball technology across all LALIGA EA SPORTS matches for the 2026/27 season, developed in collaboration with PUMA and KINEXON. The official PUMA match ball incorporates a KINEXON-developed radio-frequency sensor that transmits real-time data on ball position and the precise moment of player contact. The system supports refereeing decisions, including offside, handball, and ball-contact situations.
- May 2026: SportIQ launched the Spalding Smart Basketball, developed on Spalding's TF-1000 indoor basketball platform. The ball incorporates SportIQ's embedded sensor technology to automatically track shots and provide real-time performance data, including shot arc, release angle, shooting consistency, and mechanics through a connected application. The product combines the playing characteristics of a premium basketball with integrated performance-monitoring capabilities.
- June 2025: WIN Reality acquired Blast Motion, a developer of sensor-based swing-tracking technology for baseball, softball, and golf. Blast Motion's hardware sensors attach to bats and golf clubs to capture swing mechanics, bat or club movement, and other performance parameters. The acquisition strengthens WIN Reality's portfolio by adding physical motion-sensing hardware to its existing athlete-training technologies.
Global Smart Sports Equipment Market Report Scope
The smart sports equipment market comprises sports goods integrated with digital technologies such as sensors, microprocessors, connectivity features, and embedded tracking systems to capture, monitor, and analyze athletic performance. It includes smart balls, connected golf equipment, smart hockey sticks, sensor-enabled rackets and bats, and other technology-enabled sporting goods that provide real-time performance data, technique analysis, and training feedback to athletes and recreational users.
The scope of the smart sports equipment market covers product type, sport, distribution channel, and geography. By product type, the market is segmented into smart balls, smart golf equipment, smart hockey sticks, and smart rackets and bats. By sport, it is segmented into football, basketball, tennis, golf, and hockey. By distribution channel, it is segmented into franchise stores, online retail stores, and company-owned stores. The study also covers key geographical regions. Market forecasts are provided in value (USD) and volume (units).
Segmentation Overview
| Smart Balls |
| Smart Golf Equipment |
| Smart Hockey Sticks |
| Smart Rackets and Bats |
| Other Smart Sports Equipment |
| Football |
| Basketball |
| Tennis |
| Golf |
| Hockey |
| Baseball |
| Other Sports |
| Franchise Stores |
| Online Retail Stores |
| Company-owned stores |
| Others |
| North America | United States |
| Canada | |
| Mexico | |
| Rest of North America | |
| Europe | United Kingdom |
| Germany | |
| France | |
| Italy | |
| Spain | |
| Russia | |
| Sweden | |
| Belgium | |
| Poland | |
| Netherlands | |
| Rest of Europe | |
| Asia-Pacific | China |
| Japan | |
| India | |
| Thailand | |
| Singapore | |
| Indonesia | |
| South Korea | |
| Australia | |
| New Zealand | |
| Rest of Asia-Pacific | |
| South America | Brazil |
| Argentina | |
| Colombia | |
| Chile | |
| Rest of South America | |
| Middle East and Africa | United Arab Emirates |
| South Africa | |
| Saudi Arabia | |
| Nigeria | |
| Egypt | |
| Morocco | |
| Turkey | |
| Rest of Middle East and Africa |
| By Product Type | Smart Balls | |
| Smart Golf Equipment | ||
| Smart Hockey Sticks | ||
| Smart Rackets and Bats | ||
| Other Smart Sports Equipment | ||
| By Sport | Football | |
| Basketball | ||
| Tennis | ||
| Golf | ||
| Hockey | ||
| Baseball | ||
| Other Sports | ||
| By Distribution Channel | Franchise Stores | |
| Online Retail Stores | ||
| Company-owned stores | ||
| Others | ||
| By Geography | North America | United States |
| Canada | ||
| Mexico | ||
| Rest of North America | ||
| Europe | United Kingdom | |
| Germany | ||
| France | ||
| Italy | ||
| Spain | ||
| Russia | ||
| Sweden | ||
| Belgium | ||
| Poland | ||
| Netherlands | ||
| Rest of Europe | ||
| Asia-Pacific | China | |
| Japan | ||
| India | ||
| Thailand | ||
| Singapore | ||
| Indonesia | ||
| South Korea | ||
| Australia | ||
| New Zealand | ||
| Rest of Asia-Pacific | ||
| South America | Brazil | |
| Argentina | ||
| Colombia | ||
| Chile | ||
| Rest of South America | ||
| Middle East and Africa | United Arab Emirates | |
| South Africa | ||
| Saudi Arabia | ||
| Nigeria | ||
| Egypt | ||
| Morocco | ||
| Turkey | ||
| Rest of Middle East and Africa | ||
Key Questions Answered in the Report
What is the forecast growth rate for smart sports equipment?
The supplied forecast projects a 11.41% CAGR from 2027 to 2032, with value rising from USD 4.23 billion in 2027 to USD 7.26 billion in 2032.
Which product category holds the largest share?
Smart golf equipment held 29.80% of the product-type segment in 2026, supported by high-value products and an established performance-measurement culture.
Which sport is expected to grow fastest?
Football is forecast to grow at a 12.83% CAGR through 2032 as GPS monitoring systems expand through professional and grassroots programs.
Which sales channel is expanding fastest?
Online retail stores are forecast to record a 14.16% CAGR through 2032, while franchise stores retained the largest 2026 distribution share at 45.11%.