Market Overview
| Study Period | 2021 - 2031 |
|---|---|
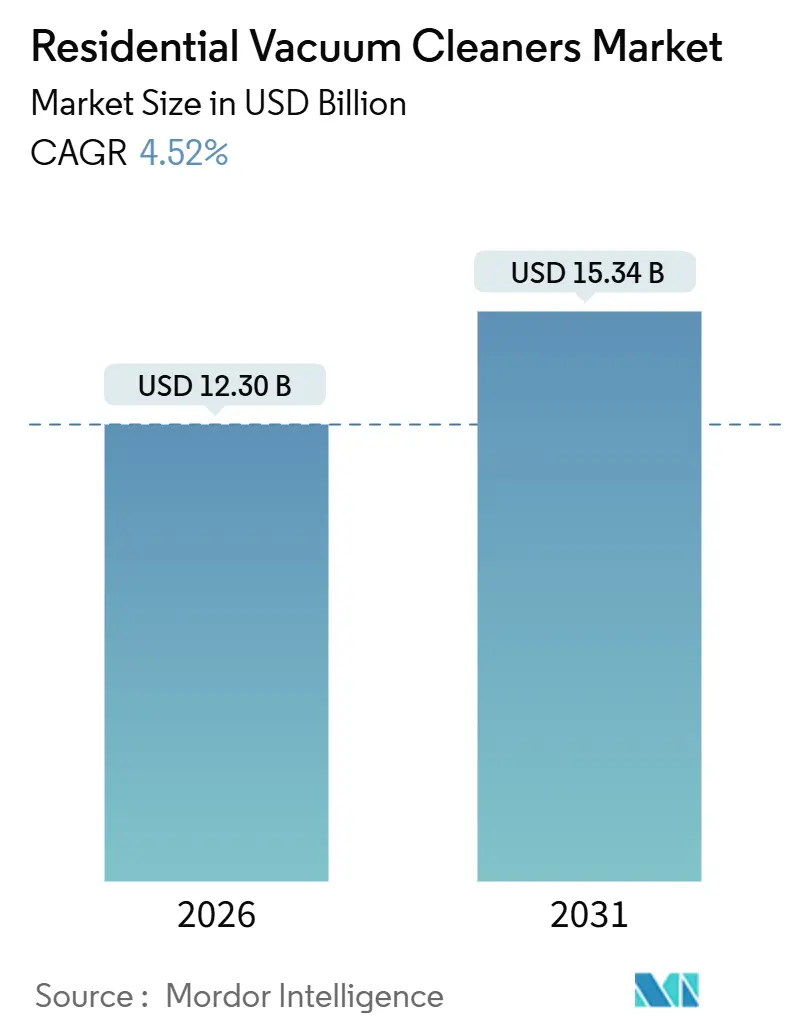
| Market Size (2026) | USD 12.30 Billion |
| Market Size (2031) | USD 15.34 Billion |
| Growth Rate (2026 - 2031) | 4.52% CAGR |
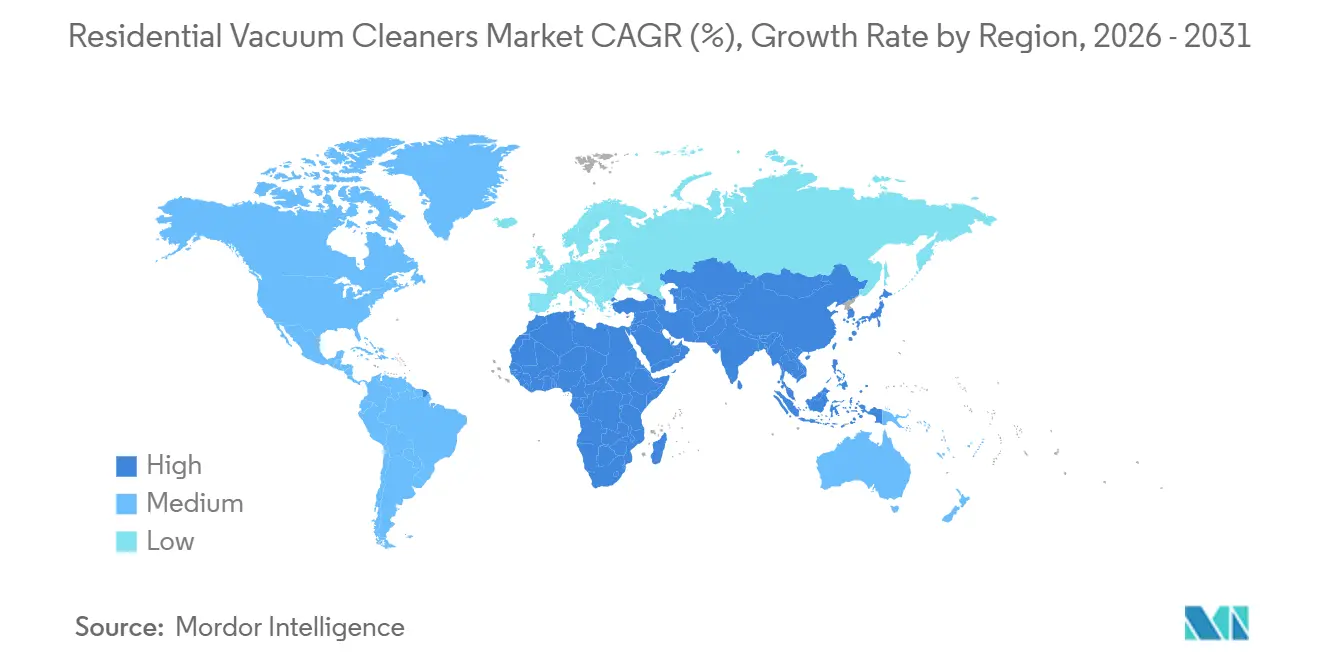
| Fastest Growing Market | Asia Pacific |
| Largest Market | Asia Pacific |
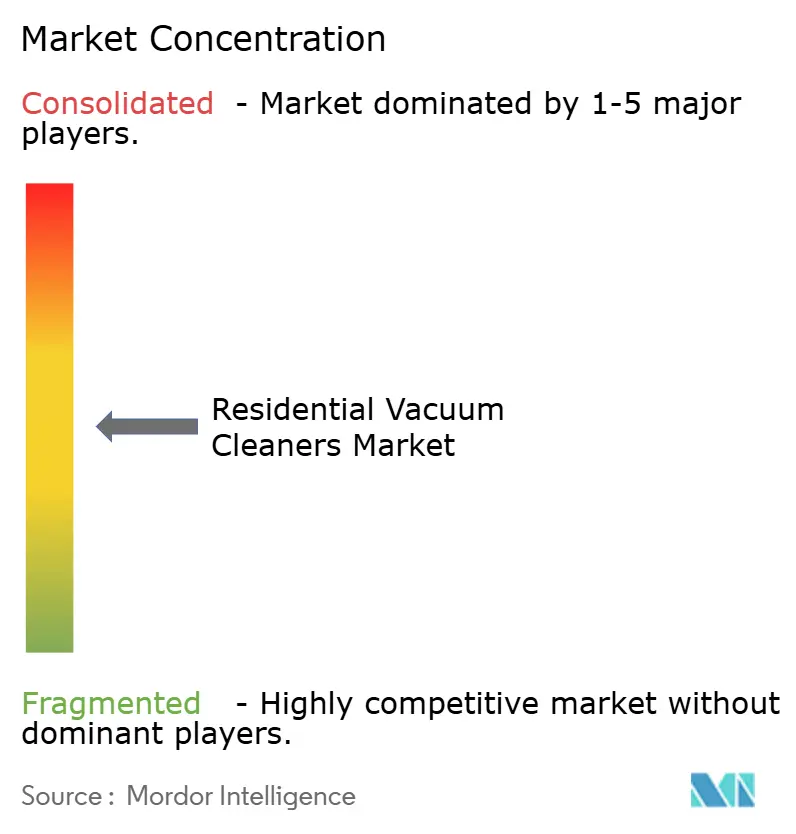
| Market Concentration | Medium |
Major Players *Disclaimer: Major Players sorted in no particular order Image © Mordor Intelligence. Reuse requires attribution under CC BY 4.0. | |
Residential Vacuum Cleaners Market Analysis by Mordor Intelligence
The residential vacuum cleaners market size is estimated at USD 12.30 billion in 2026, and is expected to reach USD 15.34 billion by 2031, at a CAGR of 4.52% during the forecast period (2026-2031). Growth is supported by increasing adoption among dual-income urban households seeking convenient and time-saving cleaning solutions. The shift toward e-commerce and direct-to-consumer sales channels is further strengthening market expansion. Smart-home compatibility has become a critical purchase factor, driving demand for connected and app-enabled vacuum cleaners. Manufacturers are focusing on improving battery efficiency to support longer and more effective cleaning cycles. Advances in navigation technology are enhancing cleaning precision and reducing user intervention. Self-maintenance features are gaining traction as they lower routine upkeep requirements. Meanwhile, right-to-repair and e-waste regulations are shaping product development, encouraging repairable designs and sustainable material use.
Key Report Takeaways
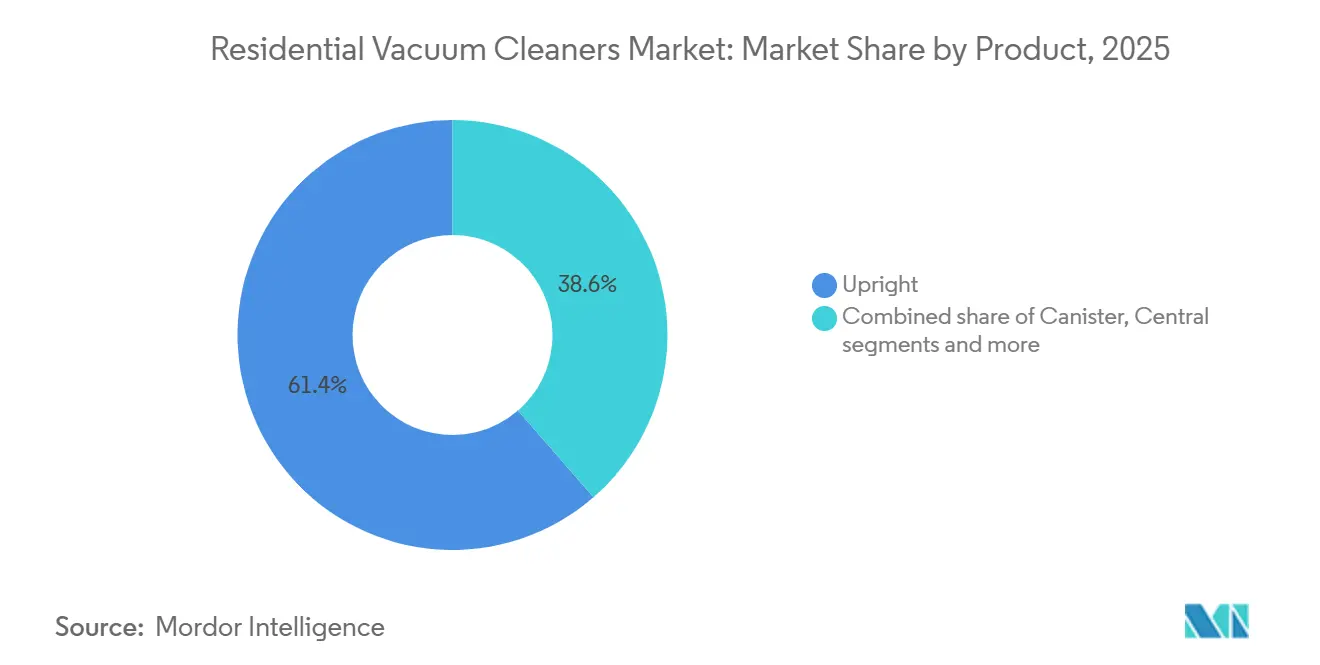
- By product category, uprights led with 61.38% of the residential vacuum cleaners market size in 2025, while robotic vacuums are projected to expand at a 6.27% CAGR through 2031.
- By cord type, corded models accounted for 57.37% of the residential vacuum cleaners market share in 2025, and cordless models recorded the fastest projected growth at 5.18% CAGR through 2031.
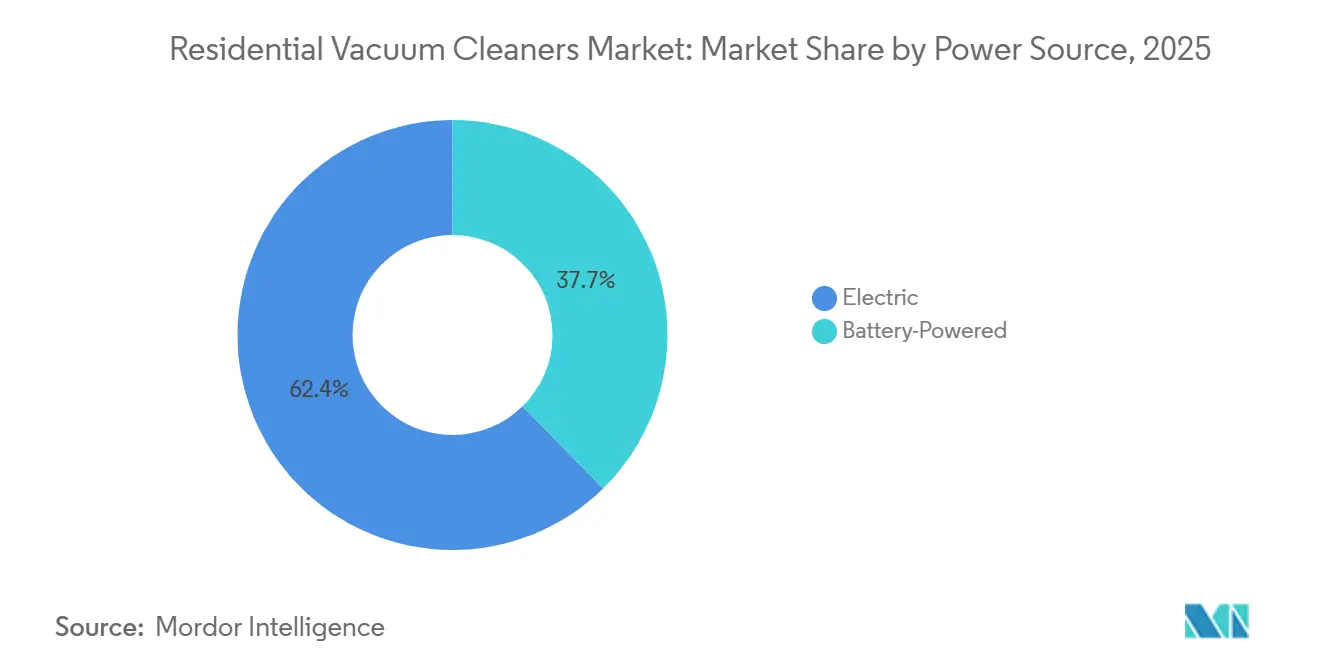
- By power source, electric models retained 62.35% of the residential vacuum cleaners market share in 2025, while battery-powered formats are forecast at a 6.25% CAGR through 2031.
- By distribution channel, multi-brand stores led with 49.39% of the residential vacuum cleaners market share in 2025, and online channels are projected to grow at a 7.13% CAGR through 2031.
- By geography, Asia-Pacific held 51.37% of the residential vacuum cleaners market share in 2025 and is expected to advance at a 6.74% CAGR through 2031.
Note: Market size and forecast figures in this report are generated using Mordor Intelligence’s proprietary estimation framework, updated with the latest available data and insights as of January 2026.
Global Residential Vacuum Cleaners Market Trends and Insights
Drivers Impact Analysis*
| Driver | (~) % Impact on CAGR Forecast | Geographic Relevance | Impact Timeline |
|---|---|---|---|
| Dual-income lifestyles prioritizing time-saving devices | +1.2% | North America, Europe | Medium term (2-4 yrs) |
| Higher-density Li-ion cells trimming cordless weight | +0.9% | North America, Europe | Medium term (2-4 yrs) |
| E-commerce boom empowering direct-to-consumer brands | +0.8% | Asia-Pacific, Global | Short term (≤ 2 yrs) |
| Smart-home integration driving connected-vacuum upsells | +0.7% | Developed APAC, North America, Europe | Medium term (2-4 yrs) |
| Health focus pushing HEPA-equipped cleaner adoption | +0.5% | Global urban centers | Medium term (2-4 yrs) |
| AI-guided navigation improving cleaning efficiency | +0.6% | Global early-tech adopters | Short term (≤ 2 yrs) |
| Source: Mordor Intelligence | |||
Dual-Income Lifestyles Prioritizing Time-Saving Devices
Household time optimization is a decisive motivator behind robotic and cordless adoption, and it is now reinforced by mainstream products that compress multi-step tasks into simplified workflows. Dyson’s V16 Piston Animal illustrates this direction by combining strong suction with whole-machine HEPA filtration and usability features that reduce user interactions during weekly routines. [1]Dyson Editorial, “Introducing the Dyson V16 Piston Animal Cordless Vacuum,” Dyson, dyson.com. Roborock’s Saros line pushes further with an obstacle-management approach that reduces pre-clean preparation, which historically limited usage frequency in cluttered rooms. Subscription and trade-in programs from leading brands add predictable ownership options and ensure maintenance is organized around device condition rather than user memory, which helps extend usable life in heavy-use homes. Institutional and business customers also adopt automated cleaning for service consistency, so features that reduce manual intervention see better retention in multi-site operations. As the residential vacuum cleaners market aligns with daily time budgets across Indian metros and tier-2 cities, product designs that combine autonomy, easy storage, and reliable floor-type adaptation are better placed to scale.
Higher-Density Li-Ion Cells Trimming Cordless Weight
Advancements in lithium-ion battery energy density are enabling longer runtimes and lighter cordless vacuums, expanding adoption among households that prioritize portability and convenience. Battery health and lifecycle performance remain key value drivers, with consumers responding positively to brands that emphasize optimized charging and thermal management to extend battery life. Tineco’s wet-dry product launches illustrate how higher-performance battery packs support multi-function cleaning without compromising runtime, enabling seamless vacuuming and mopping in a single session. Reinforcing this trend, Tineco has been recognized by Euromonitor International as the global leader in household wet & dry vacuum cleaners, reflecting strong unit sales, a large installed user base, and broad retail penetration across major regions. [2]Tineco Team, “Tineco Recognized as Global Leader in Emerging Floor Washer Category,” Tineco, us.tineco.com. In parallel, Dyson’s focus on compact designs, high-speed motors, and optimized power management continues to shape premium performance expectations, particularly in small apartments and multi-level homes. The increasing adoption of modular, user-replaceable batteries further strengthens upgrade pathways, supporting replacement demand and aligning with rising preference for lightweight cordless solutions in space-constrained and time-pressed markets such as India.
E-Commerce Boom Empowering Direct-to-Consumer Brands
Direct online channels help brands compress product feedback loops and refine features based on real-world usage trends, and that creates headroom for niche form factors that can grow into mainstream picks. Tineco’s category leadership on major marketplaces demonstrates how algorithmic discovery, ratings flywheels, and visible feature moats combine to sustain premium positions in search-intensive categories. As producer responsibility expands to marketplace operators in key jurisdictions, sellers adjust price architecture to reflect the full lifecycle cost of take-back and recycling, which is now a non-negotiable requirement for ongoing participation. Category leaders also balance channel strategies by pairing online velocity with selective offline experiences, such as demos and service hubs, to support premium ticket sizes and service expectations in top Indian cities. Portfolio breadth and attachment ecosystems, including consumables and accessories, help direct-to-consumer brands maintain engagement beyond the initial purchase, which supports retention in price-conscious markets. E-commerce, therefore, remains a force multiplier for the Residential Vacuum Cleaners Market across India’s metros, where mobile-first discovery and doorstep logistics have normalized high-value electronics purchases.
Smart-Home Integration Driving Connected-Vacuum Upsells
The integration of smart-home technologies is repositioning robotic vacuums from single-function appliances into connected cleaning systems that operate through sensors, schedules, and automated scenes, increasing their relevance as everyday household services. Ecovacs’ DEEBOT X11 demonstrates this shift through advanced mapping and obstacle-recognition capabilities that enable room-level routines across major smart-home platforms, lowering adoption friction for connected households. [3]ECOVACS Global Newsroom, “A New Era in Smart Living: DEEBOT X11,” ECOVACS, ecovacs.com. Intelligent feature chaining, such as automatic mode changes when liquids are detected, reduces manual intervention and streamlines cleaning workflows. As firmware and companion apps evolve, manufacturers are monetizing ongoing engagement through bundled offerings that include maintenance alerts, performance diagnostics, and consumables replenishment. Meanwhile, tightening certification, cybersecurity, and data-governance standards are favoring vendors that commit to long-term software support and local data handling. In India, these developments strengthen market growth by embedding meaningful, software-driven differentiation across price tiers rather than relying on cosmetic feature upgrades.
Restraints Impact Analysis*
| Restraint | (~) % Impact on CAGR Forecast | Geographic Relevance | Impact Timeline |
|---|---|---|---|
| Costly battery replacements reducing lifetime value | -0.7% | Price-sensitive markets worldwide | Medium term (2-4 yrs) |
| Macroeconomic volatility shifting buyers to manual tools | -0.5% | Emerging economies | Short term (≤ 2 yrs) |
| Tightening e-waste regulations raising compliance costs | -0.4% | Europe, expanding to NA & APAC | Long term (≥ 4 yrs) |
| Fragmented smart-home standards slowing ecosystem uptake | -0.3% | Global | Short term (≤ 2 yrs) |
| Source: Mordor Intelligence | |||
Costly Battery Replacements Reducing Lifetime Value
Battery degradation and cycle limitations significantly influence the total cost of ownership for cordless stick and robotic vacuums, prompting comparisons with corded alternatives that avoid replacement costs. Consumers increasingly consider factors such as temperature exposure, charging habits, and calendar aging when evaluating effective battery capacity, making warranty coverage and service availability key purchase drivers. Brands address this through modular, swap-ready batteries that reduce downtime or provide extended runtime, particularly in larger homes. Compliance with right-to-repair and repairability expectations has led global manufacturers to invest in spare-part availability and service networks, extending product lifespans and delaying full replacement. Feature-linked warranties, including battery and motor coverage, act as differentiators in mid-tier segments where consumers assess longevity claims closely. These cost and service considerations are most pronounced in entry- and mid-level segments in India, where buyers carefully manage budgets to avoid unexpected lifecycle expenses in the residential vacuum cleaners market.
Macroeconomic Volatility Shifting Buyers to Manual Tools
During periods of slower economic growth, households extend replacement cycles and prioritize essential spending, which dampens upgrades in small domestic appliances, including vacuum cleaners. Softer consumer spending is expected in 2026–2027, a trend mirrored across multiple developed markets where purchases of durable goods are deferred. Manufacturers with multi-tier product portfolios address this by expanding entry-level offerings and promoting refurbishment or trade-in programs to appeal to value-conscious consumers seeking modern functionality. Emphasizing repairability, modular design, and trusted filtration systems reassures first-time buyers, reducing perceived purchase risk during tight spending periods. Promotional campaigns and seasonal discounts, particularly via online channels, play a critical role in stimulating purchases as consumers increasingly compare options digitally. In India, the residential vacuum cleaners market remains highly sensitive to retail pricing, making accessible SKUs with reliable performance key to maintaining sales volume under economic uncertainty.
*Our forecasts treat driver/restraint impacts as directional, not additive. The impact forecasts reflect baseline growth, mix effects, and variable interactions.
Segment Analysis
By Product: Uprights Anchor Volume, Robotics Claim Innovation
Upright vacuum cleaners accounted for the largest market share in 2025, representing 61.38%, supported by widespread familiarity and consistent performance across homes with mixed flooring. These vacuums emphasize durability, reliable suction, and sealed filtration, which encourages repeat purchases among users who prioritize simplicity and maintenance ease. Product upgrades in uprights focus on brush-roll efficiency and robust construction, reinforcing their appeal for frequent cleaning routines. Premium brands, such as Dyson, continue to integrate higher airflow, powerful motors, and comprehensive filtration into their upright and cordless lines, maintaining consumer confidence in hygiene and performance. In India, upright vacuums remain popular in larger homes, but the rise of high-density apartments is driving interest in slim, maneuverable stick and robotic formats. This trend reflects the growing consumer preference for products that can access corners, under furniture, and low-clearance spaces effectively.
Robotic vacuums are the fastest-growing segment, projected to expand at a 6.27% CAGR, driven by AI navigation, self-maintenance, and improved edge-cleaning capabilities. Advanced models, such as Roborock’s Saros series, leverage integrated sensors and mechanical design to cover more rooms per session with minimal manual preparation. Dreame’s high-traction designs enhance threshold-crossing across multi-room layouts while mapping improvements ensure smoother floor-type transitions. Service-oriented features, including automated collection and wash cycles, reduce user effort and simplify frequent cleaning, reinforcing daily-use adoption. Premium portfolios continue to emphasize power, precision, and hygiene, aligning robotic and cordless offerings under a unified design philosophy. In India, compact living spaces and work-from-home routines accelerate demand for robotic vacuums, as frequent, low-friction cleaning becomes increasingly necessary for small apartments.


By Cord Type: Cordless Momentum Builds on Battery Economics
Corded vacuum models retained a 57.37% share of the cord type market size in 2025 and continue to be preferred in households where uninterrupted runtime and consistent power are critical for frequent deep-cleaning tasks. Premium corded canisters and uprights focus on reliable suction performance and filter integrity, maintaining relevance in homes with heavy carpets or high foot traffic. Brands like Bosch demonstrate how cordless alternatives with variable power modes and auto-surface detection can approach corded performance, reducing perceived trade-offs. SharkNinja highlights sensing-based features that adjust suction in response to debris levels, further boosting consumer confidence in cordless outcomes. In India, corded vacuums remain the go-to option for thorough deep cleans on mixed floors, while cordless sticks are increasingly used for routine maintenance. This dual approach reinforces corded vacuums’ position as dependable workhorses while gradually introducing consumers to cordless convenience within the residential vacuum cleaners market.
Cordless vacuums are projected to be the fastest-growing cord type, with a 5.18% CAGR through 2031, driven by lighter form factors and more predictable battery performance. Dyson’s compact designs pair high-speed motors with improved airflow to navigate under furniture and tight spaces, supporting adoption in smaller Indian apartments. Tineco’s wet-dry models demonstrate that higher-capacity batteries can handle multiple functions without compromising runtime, expanding the number of tasks a single device can complete. Increased consumer familiarity with battery care and charging behavior, along with modular swappable packs, reduces downtime and enhances perceived product value. Mid-tier cordless models benefit from expanding service and parts coverage in key Indian cities, improving buyer confidence. These trends collectively encourage the shift toward cordless adoption while maintaining corded models for intensive cleaning needs in the residential vacuum cleaners market.
By Power Source: Electric Incumbency Meets Battery Disruption
Electric-powered vacuums, including corded uprights and canisters, held the majority market share at 62.35% in 2025, supported by established cleaning habits and the assurance of uninterrupted full-power operation. Reliable suction and sealed filtration maintain their relevance for users who prioritize thorough cleaning in a single pass rather than multiple maintenance cycles. Regulatory and market trends emphasizing repairability and parts availability help sustain the value of electric models, especially for households that favor long product lifespans over portability. In India, brand ecosystems continue to promote electric vacuums across entry-level price bands, facilitating adoption among first-time home appliance buyers. This combination of performance, durability, and accessibility preserves a substantial base for electric vacuums even as cordless and robotic solutions expand. Overall, electric models remain the backbone of the Residential Vacuum Cleaners Market, particularly for deep-cleaning tasks in homes with heavy carpets or high foot traffic.
Battery-powered vacuums are projected to grow at a 6.25% CAGR, driven by advances in lithium-ion chemistry, motor efficiency, and user education on charging and battery care. High-efficiency motors and optimized airflow support longer runtimes while enabling lighter, more compact designs suited to urban Indian homes. Investments in modular batteries and simplified pack replacements reduce perceived maintenance risk, encouraging adoption among hesitant buyers. Advanced models integrate dust detection, auto-adjusting suction, and intuitive charging docks, improving cleaning efficiency and user satisfaction in real-life scenarios. As consumers gain confidence in cordless performance, adoption expands in households that value quick, flexible cleaning sessions around school and work routines. These dynamics collectively boost the market size of battery-powered vacuums within the residential vacuum cleaners market while complementing the established electric segment.
By Distribution Channel: Online Surges, Offline Persists
Multi-brand stores led the market with a 49.39% market share in 2025, highlighting the continued importance of in-person trials for suction, maneuverability, and noise levels in high-value vacuum purchases. Physical retail remains influential where live demonstrations, accessory bundles, and side-by-side comparisons help shoppers evaluate robotic, cordless, and upright models within similar price ranges. Flagship brand stores' market size further strengthens premium positioning by offering hands-on exploration and trained staff support, fostering trust among first-time buyers. Offline channels also serve as key points for warranty registration and service initiation, which is particularly important for emerging categories with unfamiliar maintenance requirements. In India, established electronics and home appliance chains play a central role in guiding product selection across tier-1 and tier-2 cities. This combination of experiential engagement and after-sales support maintains strong relevance for physical retail in the Residential Vacuum Cleaners Market.
Online channels are expected to grow at a 7.13% CAGR through 2031, driven by the convenience of integrated search, comparison, and fulfillment, along with marketplace trust signals for high-value appliances. Compliance measures, including take-back programs and standardized fee structures, are increasingly embedded in online listings, making end-of-life planning more transparent for consumers. Category leaders like Tineco demonstrate how consistent ratings, algorithm-friendly differentiation, and visibility during promotional events reinforce market positioning. Brands are complementing online sales with after-sales support that encourages repeat purchases of consumables and accessories, extending customer engagement beyond the initial transaction. The growth of mobile-first consumer behavior in India further strengthens online channels as a medium-term driver for the Residential Vacuum Cleaners Market. Overall, the blend of offline reassurance and online convenience ensures a balanced, expanding distribution network.
Geography Analysis
Asia-Pacific accounted for the largest share of the residential vacuum cleaners market in 2025, representing 51.37% of the total market size, and is projected to expand at a 6.74% CAGR through 2031, driven by rapid urbanization, digital retail expansion, and strong local brand innovation. Regional manufacturers focus on practical features that balance cost and performance, with robotic and stick vacuums designed for compact spaces and hard flooring. China’s OEM ecosystem supports frequent updates in sensing, mapping, and self-cleaning technologies, maintaining momentum in densely populated urban areas. Integration with smart-home platforms further boosts adoption among early adopters in major APAC metros. These trends are influencing India’s adoption curve, as both domestic and imported products highlight the convenience of automated cleaning solutions.
North America maintains a stable demand, anchored by consumer expectations of quality, service, and brand trust, although macroeconomic caution and higher costs are tempering replacement cycles. Corporate restructuring and consolidation, such as iRobot’s 2025 organizational changes, demonstrate how market dynamics and producer economics can shift competitive balances. Europe continues to lead in sustainability and repairability standards, with manufacturers investing in modular designs and long-term parts availability to meet eco-label requirements. Regulatory standards from the EU influence global product design, encouraging easier battery removal and end-of-life disassembly. These demand- and compliance-driven trends guide portfolio planning and pricing strategies for India, positioning it as a priority growth market.
India occupies a strategic position within this blended regional growth pattern, benefiting from rapid urbanization, expanding online discovery, and consumer sensitivity to value over both purchase price and product lifespan. Buyers emphasize lightweight, compact vacuums with reliable filtration systems capable of handling high dust loads, supporting the adoption of sealed and HEPA-rated designs. Global flagship launches and targeted mid-tier SKUs from Chinese and European brands are driving premiumization, especially when coupled with strong after-sales service. Emerging repairability and take-back standards in other regions are shaping voluntary practices and consumer expectations in India. These combined factors create a favorable environment for the residential vacuum cleaners market in India’s major cities and rapidly growing urban clusters.

Competitive Landscape
The residential vacuum cleaners market has a moderate concentration, indicating a landscape where several leading brands hold significant positions without a single player dominating the space. Continuous innovation in robotic vacuums, premium sticks, and wet-dry hybrids sustains competition, with brands leveraging engineering expertise and integrated ecosystems to maintain market share. Dyson emphasizes high-speed motors, optimized airflow, and sealed filtration, appealing to consumers seeking powerful, compact solutions. Ecovacs’ robots feature multi-sensor navigation and compatibility with popular smart-home platforms, simplifying adoption for connected households. Roborock’s advancements in obstacle management demonstrate how combined hardware and software design can reduce friction, ensuring consistent robotic performance across varied floor layouts.
Strategic partnerships and channel optimization are shaping market dynamics as brands align R&D with manufacturing and distribution capabilities. For example, BSH and Ecovacs co-develop a built-in robotic solution integrated with kitchen plumbing and power, opening design-led market opportunities in Europe. SharkNinja focuses on sensing-driven features to increase trust in robots and cordless vacuums by adjusting performance to unseen dirt and household traffic. TTI’s profitability amid top-line pressure highlights the importance of portfolio breadth and cost management to preserve margins. In India, these strategies are reflected in partnerships, service alliances, and retail formats that enhance product discovery and after-sales reliability.
Corporate restructuring and strategic expansions also influence competitive positioning across regions. iRobot’s Chapter 11 filing and acquisition by a contract manufacturer show how cost structures and tariff exposure can prompt strategic pivots even for leading players. Xiaomi leverages its AIoT ecosystem to cross-pollinate features, sustaining innovation in robot vacuums for tech-savvy buyers. [4]Xiaomi Global, “Xiaomi Expands AIoT Offerings,” Xiaomi, mi.com. Miele’s Guard series reinforces premium positioning through durability testing and reliable filtration, attracting consumers who prioritize air quality and product longevity. Overall, the market favors brands with strong engineering credibility, transparent lifecycle economics, and robust service models, which align with India’s evolving consumer expectations and marketplace requirements.
Residential Vacuum Cleaners Industry Leaders
Dyson Ltd.
iRobot Corp.
Ecovacs Robotics
SharkNinja
Samsung Electronics
- *Disclaimer: Major Players sorted in no particular order

Recent Industry Developments
- January 2026: Narwal unveiled its new smart-cleaning lineup at CES 2026, including the Flow 2 robotic vacuum, V50 cordless vacuum, and U50 mattress vacuum cleaners. The products feature AI-enhanced navigation, self-emptying docks, and advanced cleaning capabilities designed to improve automation, efficiency, and deep-clean performance in homes.
- December 2025: iRobot was acquired by its primary lender and manufacturer, Picea, through a Chapter 11 prepack deal to strengthen finances and support growth. The company went private, continued operations normally, and focused on long-term innovation in robotics and smart-home products.
- September 2025: BSH Home Appliances Group and Ecovacs Robotics announced a strategic partnership to co-develop a built-in vacuum and mopping robot under the Bosch brand with integrated plumbing and power.


Research Methodology Framework and Report Scope
Market Definitions and Key Coverage
Our study defines the residential vacuum cleaner market as powered floor-care appliances sold to households, covering upright, canister, stick, handheld, wet-dry, central, and robotic units, whether corded or cordless, that arrive as new finished goods. It captures value at consumer sell-through prices, reflecting the real cash exchanged in retail and e-commerce channels.
Scope exclusion: We intentionally omit aftermarket bags and filters, rental fleets, and industrial wet-dry machines above 30 liters.
Segmentation Overview
- By Product
- Upright
- Canister
- Central
- Drum
- Wet and Dry
- Robotic
- By Cord Type
- Corded
- Cordless
- By Power Source
- Battery Powered
- Electric
- By Distribution Channel
- Multi-brand Stores
- Exclusive Brand Outlets
- Online
- Other Distribution Channels
- By Geography
- North America
- Canada
- United States
- Mexico
- South America
- Brazil
- Peru
- Chile
- Argentina
- Rest of South America
- Europe
- United Kingdom
- Germany
- France
- Spain
- Italy
- BENELUX (Belgium, Netherlands, and Luxembourg)
- NORDICS (Denmark, Finland, Iceland, Norway, and Sweden)
- Rest of Europe
- Aisa-Pacific
- India
- China
- Japan
- Australia
- South Korea
- South East Asia (Singapore, Malaysia, Thailand, Indonesia, Vietnam, and Philippines)
- Rest of Asia-Pacific
- Middle East And Africa
- United Arab of Emirates
- Saudi Arabia
- South Africa
- Nigeria
- Rest of Middle East And Africa
- North America
Detailed Research Methodology and Data Validation
Primary Research
Mordor analysts interviewed product managers, motor suppliers, big-box buyers, and leading online retailers in North America, Europe, and Asia-Pacific. These conversations clarified price corridors, replacement cycles, and indoor-air-quality triggers that desk work alone could not pin down.
Desk Research
We started by mapping retail appliance sales from the U.S. Census Monthly Retail Trade series, Eurostat production tables, and UN Comtrade HS-8508 shipment flows to understand the global demand pool. Trade association releases, such as AHAM unit-shipment briefs and China Household Electrical Appliances Yearbooks, helped us size regional penetration and technology shifts. Patent landscapes from Questel and news indexed through Dow Jones Factiva revealed how Li-ion batteries and SLAM navigation migrate across models and regions.
Company 10-Ks, investor decks, and national consumer-expenditure surveys then supplied average selling prices and household ownership ratios, allowing us to translate units into market value with confidence. This list is illustrative; many other publicly available sources were consulted for triangulation.
Market-Sizing & Forecasting
Our model begins top-down: production plus imports minus exports reconstruct global unit sales, which are then linked to household penetration and replacement frequency. Selected bottom-up checks, brand sales samples and online channel audits, keep totals realistic. Key inputs include average selling price by cord type, battery watt-hour cost curves, urban household formation, e-commerce share of small-appliance sales, and HEPA filter adoption. We forecast to 2030 with multivariate regression layered on scenario analysis, and we adjust elasticities using expert consensus on GDP and housing starts.
Data Validation & Update Cycle
Before sign-off, model outputs pass variance thresholds against independent indicators and undergo peer review. Our tables refresh each year, with interim revisions triggered by material events such as wattage regulations or lithium price shocks, so clients receive the latest view.
Why Our Residential Vacuum Cleaners Baseline Commands Reliability
Published estimates often differ because providers choose varying product scopes, price bases, and refresh cadences, and we acknowledge those gaps up front.
Key differences stem from whether robotic mops are bundled, how gray-market imports are treated, and whether price deflation on cordless sticks is recognized. Some firms quote factory-gate shipments, while Mordor Intelligence uses consumer sell-through; others still apply pre-COVID growth curves.
Benchmark comparison
| Market Size | Anonymized source | Primary gap driver |
|---|---|---|
| USD 11.75 B (2025) | Mordor Intelligence | |
| USD 15.00 B (2025) | Global Consultancy A | Includes commercial light-duty units and uses factory-gate prices |
| USD 12.91 B (2024) | Trade Journal B | Relies on shipment data and fixed 2022 currency rates |
These comparisons show that Mordor's disciplined scope selection, dual-path validation, and annual refresh deliver a balanced, transparent baseline that decision-makers can rely on.


Key Questions Answered in the Report
What is the current size and growth outlook for the Residential Vacuum Cleaners Market?
The Residential Vacuum Cleaners market size is USD 12.30 billion in 2026 and is projected to reach USD 15.34 billion by 2031 at a 4.52% CAGR, supported by automation, e-commerce, and connected-home adoption.
Which product segments are leading and which are growing fastest in the Residential Vacuum Cleaners Market?
Uprights lead on share, while robotic vacuums are the fastest-growing product category, driven by navigation, self-maintenance, and app integration that reduce user effort during weekly cleaning.
How are regulations like WEEE and right-to-repair affecting the Residential Vacuum Cleaners Market?
Producers and marketplace operators must fund collection and treatment, and designs are shifting to removable batteries and repair-friendly housings, which influence costs and extend useful life.
What are the key restraints on the Residential Vacuum Cleaners Market in 2026?
Battery replacement costs, macro caution on discretionary spending, and e-waste compliance raise ownership and operating costs and influence purchase timing in sensitive price bands.
How does Asia-Pacific, including India, shape the trajectory of the Residential Vacuum Cleaners Market?
Asia-Pacific holds a majority revenue share and leads growth with high-velocity product innovation, while India benefits from urbanization, expanding e-commerce adoption, and rising demand for time-saving home cleaning solutions.
Page last updated on:


