
Public Service Experience Platforms Market Size and Share
Market Overview
| Study Period | 2020 - 2031 |
|---|---|
| Market Size (2026) | USD 14.58 Billion |
| Market Size (2031) | USD 27.92 Billion |
| Growth Rate (2026 - 2031) | 13.88 % |
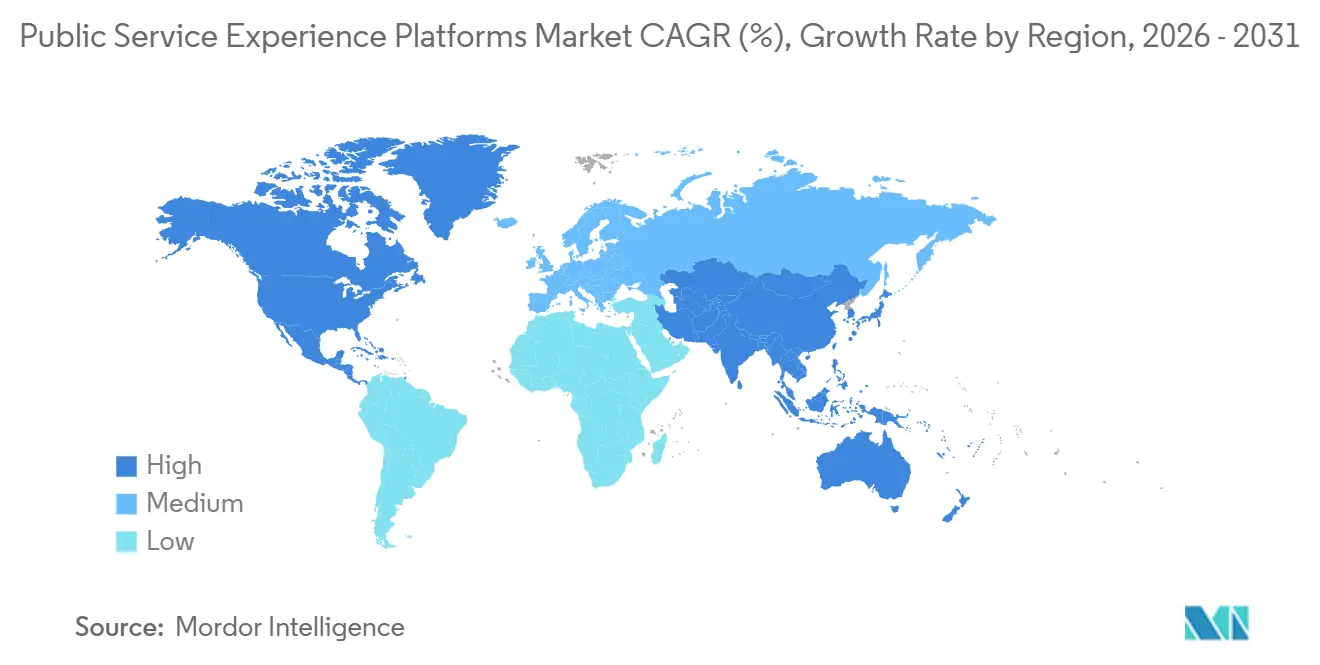
| Fastest Growing Market | Asia-Pacific |
| Largest Market | North America |
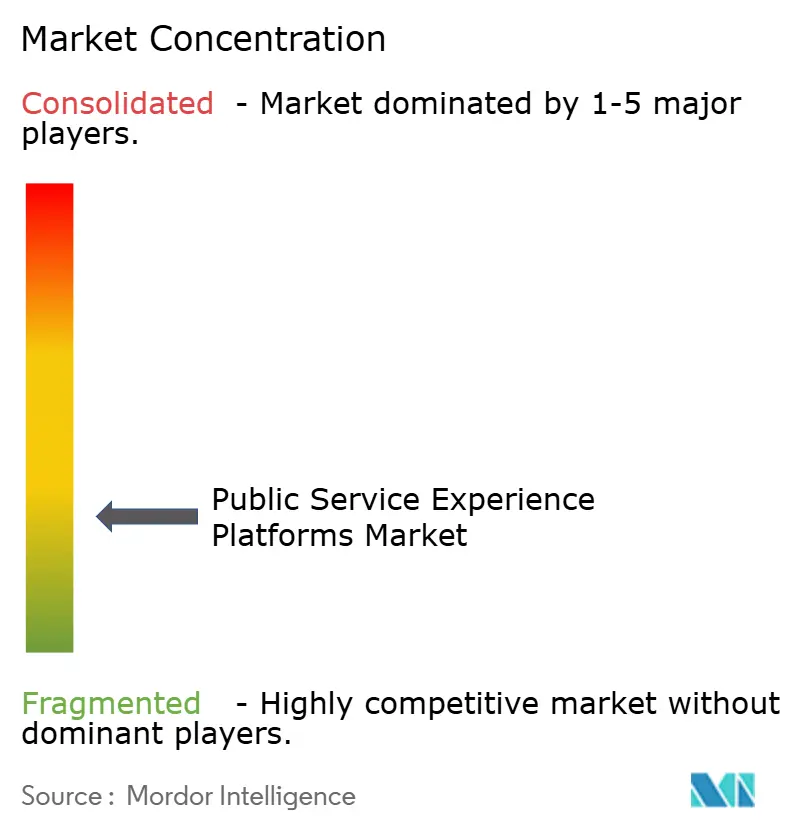
| Market Concentration | Low |
Major Players *Disclaimer: Major Players sorted in no particular order Image © Mordor Intelligence. Reuse requires attribution under CC BY 4.0. | |
Public Service Experience Platforms Market Analysis by Mordor Intelligence
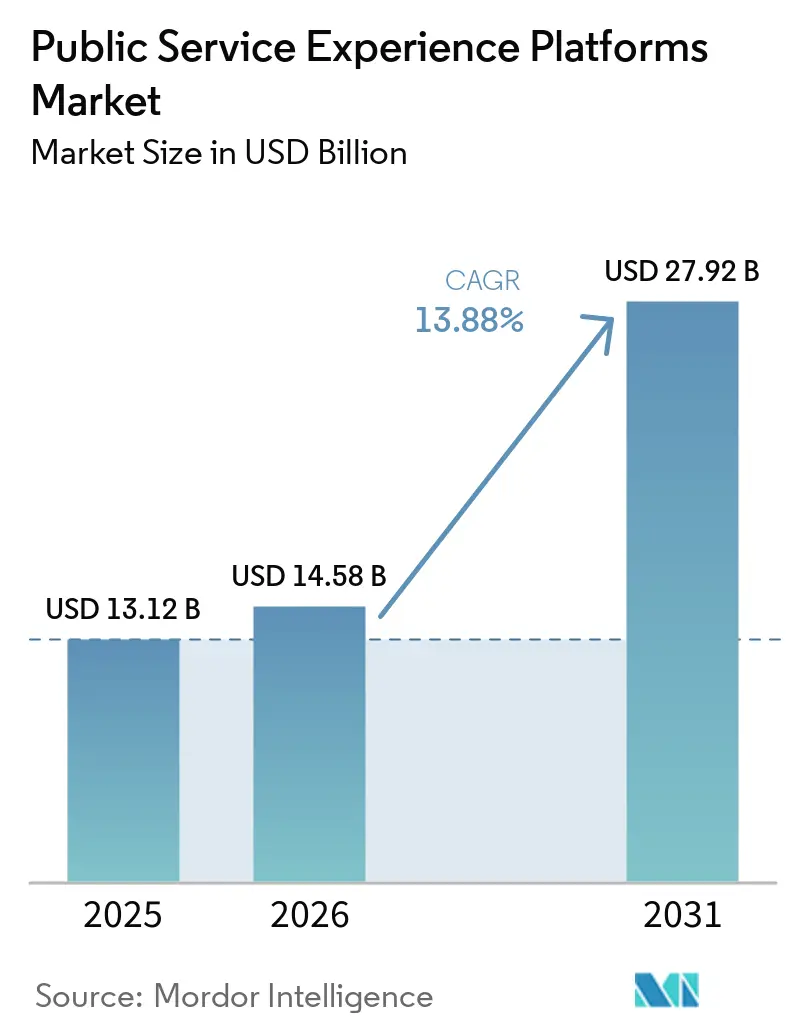
The public service experience platforms market size was valued at USD 13.12 billion in 2025 and is projected to grow from USD 14.58 billion in 2026 to USD 27.92 billion by 2031, at a CAGR of 13.88% during the forecast period (2026-2031). Governments are moving from separate, process-led transactions toward connected services that support a citizen across agencies and channels. This shift favors platforms that integrate workflows, identity, communications, and service resolution into a single operating environment. Legacy modernization, digital identity requirements, and demand for accessible services are increasing the need for these platforms. Large enterprise software providers pursue federal and state contracts, while government technology specialists concentrate on local deployments with tailored functions. AI investment is also changing competitive priorities because agencies increasingly expect automation within service workflows rather than as a separate add-on.
Key Report Takeaways
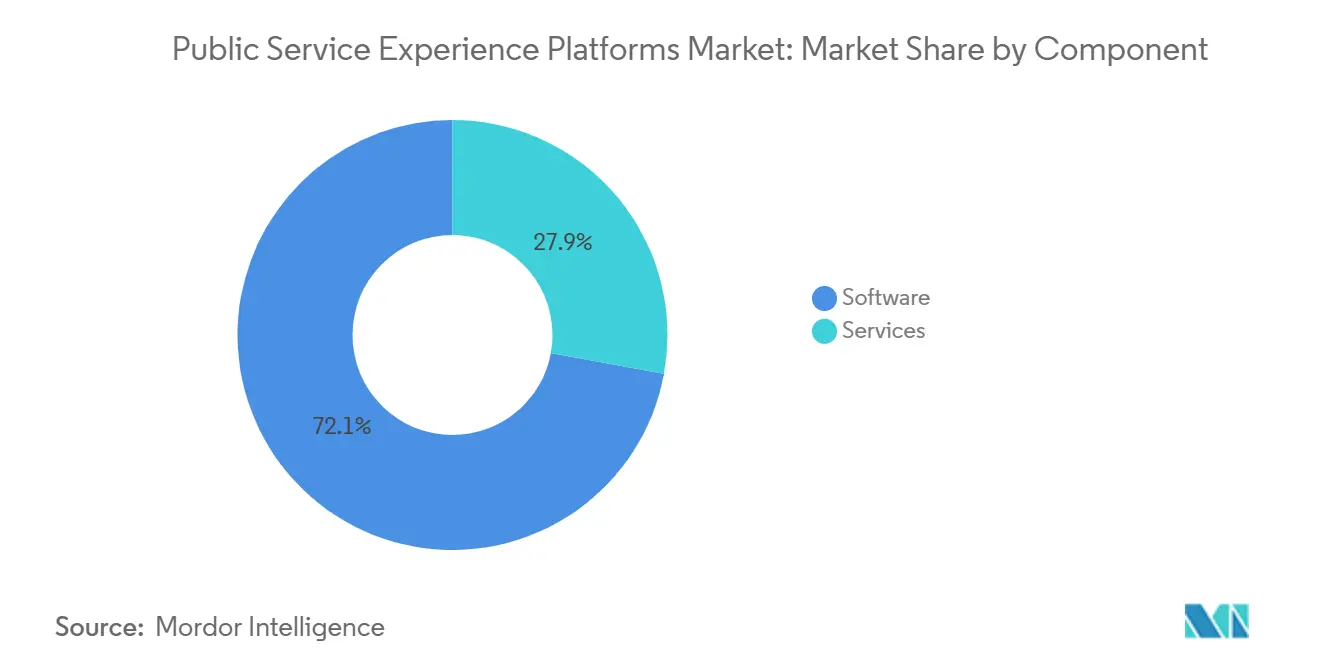
- By component, software held 72.12% of the public service experience platforms market share in 2025, while services are projected to expand at a 14.66% CAGR through 2031.
- By deployment model, cloud accounted for 55.21% of revenue in 2025 and is projected to expand at a 15.26% CAGR through 2031 in the public service experience platforms market.
- By platform type, citizen engagement portals held 23.32% of revenue in 2025, while digital identity and authentication platforms are projected to expand at a 14.78% CAGR through 2031.
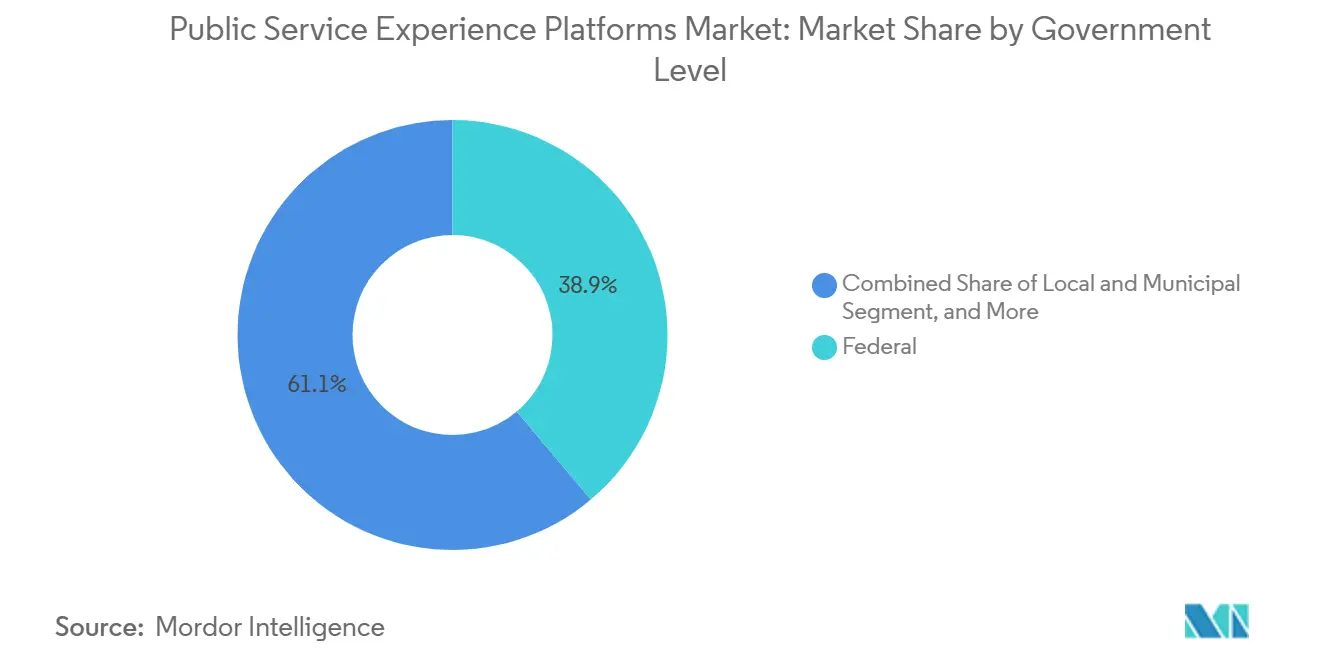
- By government level, federal deployments held 38.88% of revenue in 2025, while local and municipal deployments are projected to expand at a 15.10% CAGR through 2031 in the public service experience platforms market.
- By application, service delivery applications held 21.12% of revenue in 2025, while emergency and non-emergency service requests are projected to expand at a 14.87% CAGR through 2031.
- By geography, North America held 38.49% of revenue in 2025, while Asia-Pacific is projected to expand at a 15.64% CAGR through 2031 in the public service experience platforms market
Note: Market size and forecast figures in this report are generated using Mordor Intelligence’s proprietary estimation framework, updated with the latest available data and insights as of January 2026.
Market Trends and Insights
Drivers Impact Analysis of Public Service Experience Platforms Market*
| DRIVER | (~) % IMPACT ON CAGR FORECAST | GEOGRAPHIC RELEVANCE | IMPACT TIMELINE |
|---|---|---|---|
| Rising Citizen Demand for Omnichannel Government Service Access | +3.2% | Global | Short term (≤ 2 years) |
| AI-Enabled Case Routing and Service Resolution | +2.8% | Global, with early concentration in North America and Europe | Medium term (2-4 years) |
| Cloud Modernization of Legacy Public Sector Systems | +2.4% | Global, led by North America and Europe, is expanding in the Asia-Pacific | Medium term (2-4 years) |
| Government Digital Identity and Consent Management Expansion | +2.0% | Europe, Asia-Pacific, and South America | Long term (≥ 4 years) |
| Privacy-Preserving Data Sharing Across Agencies | +1.4% | Europe and North America, with spillover to the Middle East | Long term (≥ 4 years) |
| Accessibility Compliance and Multilingual Service Mandates | +1.0% | Global, with regulatory mandates concentrated in Europe and the Asia-Pacific | Medium term (2-4 years) |
| Source: Mordor Intelligence | |||
Rising Citizen Demand for Omnichannel Government Service Access
Citizens increasingly expect consistent service through web portals, mobile applications, telephone, text messages, and in-person locations. The Australian Government Digital Experience Policy took full effect on January 1, 2026, and requires unified access points, performance measurement, and inclusive delivery across federal agencies.[1]Australian Government, Department of Finance, “Digital Experience Policy,” Australian Government, digital.gov.au. These requirements make single-channel projects less suitable for new government programs. Agencies must also connect interaction data without losing consistency when a person moves between service channels. That need supports the public service experience platforms market because platforms with native channel coordination can meet the required operating model. Compliance with service standards can also shape budget reviews, which makes capable delivery systems more important to agency planning.
AI-Enabled Case Routing and Service Resolution
AI is moving from pilots into government service desks, creating demand that does not always wait for a full platform refresh cycle. In 2026, the City of Raleigh deployed a ServiceNow L1 AI Specialist without an in-house AI engineering team and reported a 66% reduction in service desk costs and more than 1,300 staff hours recovered each year. The deployment also resolved nearly half of IT support requests through AI agents.[2]ServiceNow, “ServiceNow Accelerates AI-Powered Government Reinvention Across Nearly All 50 U.S. States with New Customer Wins,” ServiceNow Newsroom, newsroom.servicenow.com. The OECD reported in its 2025 survey that 67% of member countries used AI to improve public service design and delivery.[3]Organisation for Economic Co-operation and Development, “AI in Public Service Design and Delivery,” OECD, oecd.org. This adoption makes automated routing and resolution a more common requirement in new procurements. The public service experience platforms market, therefore, favors providers that embed AI agents in case workflows and chat interactions.
Cloud Modernization of Legacy Public Sector Systems
Aging government technology remains a major obstacle, but it also sustains demand for replacement platforms. The U.S. Government Accountability Office identified 11 federal systems in need of urgent modernization in July 2025, ranging in age from 23 to 60 years. Eight of those systems used unsupported or outdated programming languages, and 7 had cybersecurity vulnerabilities that required full replacement for remediation.[4]U.S. Government Accountability Office, “Federal Legacy IT: Agencies Need to Plan for Modernizing Critical Decades-Old Systems,” U.S. Government Accountability Office, gao.gov. Iowa announced in June 2026 that it would move executive-branch data from state servers to Amazon Web Services and projected savings of more than USD 525 million over 10 years. Modernization projects often require data migration, interface work, change management, and managed support in addition to new software. This pattern supports the public service experience platforms market by extending vendor involvement beyond initial implementation.
Government Digital Identity and Consent Management Expansion
Digital identity is becoming a core layer for connected public services. Regulation (EU) 2024/1183 requires EU member states to make Digital Identity Wallets available to citizens, residents, and businesses by the end of 2026.[5]European Commission, “European Digital Identity,” European Commission, commission.europa.eu. The framework covers more than 450 million potential users and requires platforms serving Europe to support interoperable identity and consent practices. Malaysia's MyDigital ID connected with 114 government online services and expanded to 19 state-level platforms by June 2026. The OECD found that 92% of member countries had a digital identity strategy, although population uptake exceeded 90% in only 9 countries. The gap between national strategy and broad enrollment leaves a continuing role for providers that can manage identity orchestration. It also creates a clear opening for the public service experience platforms market in services that require secure access across agencies.
Restraints Impact Analysis of Public Service Experience Platforms Market*
| RESTRAINT | (~) % IMPACT ON CAGR FORECAST | GEOGRAPHIC RELEVANCE | IMPACT TIMELINE |
|---|---|---|---|
| Procurement Cycles That Delay Platform Consolidation | -1.6% | Global, most acute in North America and Europe | Short term (≤ 2 years) |
| Data Sovereignty Constraints Limiting Cloud Deployment | -1.2% | Europe, the Middle East, and Asia-Pacific, including India and China | Long term (≥ 4 years) |
| Integration Complexity Across Fragmented Legacy Systems | -0.8% | Global, with the highest concentration in North America | Medium term (2-4 years) |
| Cybersecurity and Public Trust Exposure After Service Outages | -0.5% | Global, acute in Europe and North America | Short term (≤ 2 years) |
| Source: Mordor Intelligence | |||
Procurement Cycles That Delay Platform Consolidation
Government procurement rules promote competition and fiscal accountability, but they can slow cloud platform decisions. The OECD reported in 2026 that 55% of member countries used procurement approaches suited to iterative digital delivery. The remaining countries may still assess cloud platforms through contract structures designed for older hardware and software purchases. In Europe and South America, multi-year tenders can add 18 to 36 months between a modernization decision and platform launch. This defers revenue recognition and can leave delivery teams waiting for final awards. The public service experience platforms market benefits when vendors offer modular deployment options alongside larger enterprise agreements. OpenGov and Tyler Technologies have emphasized rapid implementation and managed-service approaches that can help governments work within these constraints.
Data Sovereignty Constraints Limiting Cloud Deployment
Data localization rules can limit where governments deploy cloud-based public service systems. France's Decree No. 2026-272 entered into force on April 17, 2026, and set protections for sensitive public administration data handled by private cloud providers. The European Commission published its Cloud Sovereignty Framework in June 2026, with 4 Sovereignty Effectiveness Assurance Levels across 8 categories, including legal compliance, processing location, and supply chain control. These conditions can require certification before a provider competes for EU institutional contracts. Providers without sovereign infrastructure or qualified residency partners may face longer sales processes and exclusion from bid lists. The public service experience platforms market must therefore accommodate different deployment requirements across jurisdictions. Smaller vendors can face higher costs because building and maintaining regional compliance capabilities is difficult.
*Our forecasts treat driver/restraint impacts as directional, not additive. The impact forecasts reflect baseline growth, mix effects, and variable interactions.
Public Service Experience Platforms Market Segment Analysis
By Component:
Software Revenue Remains Central as Services ExpandSoftware is projected to account for 72.12% of the public service experience platforms market share in 2025. Government procurement frameworks increasingly favor SaaS subscriptions, which create predictable annual software spending rather than capital expenditures. Consolidation initiatives replace multiple point solutions with integrated suites, increasing the number of software users and module adoption within agencies. The public service experience platforms market size for software reflects the recurring nature of these licensing arrangements. However, software providers must demonstrate that their products can integrate with legacy records systems and existing agency workflows.
Services are projected to expand at a CAGR of 14.66% through 2031. Implementations often require legacy data migration, API integration, workforce training, and ongoing support. Granicus and OpenGov have expanded their managed services and government success offerings for smaller agencies that lack the capacity to support large internal project teams. These offerings combine advisory services, configuration, and subsequent optimization under multiyear support arrangements. Washington, D.C.’s Office of the Chief Technology Officer is expected to deploy the ServiceNow AI Platform, aiming for a 50% to 60% reduction in grants-management processing time. This initiative could sustain demand for post-deployment optimization services.


By Deployment Model:
Cloud Holds the Lead Across Government TiersCloud deployment is projected to account for 55.21% of revenue in 2025 and expand at a CAGR of 15.26% through 2031. This growth reflects a mature installed base and the continued migration from on-premises systems. Iowa’s statewide cloud program is expected to demonstrate the scale of commitments moving through state approval processes in 2026, with projected savings exceeding USD 525 million over 10 years. Cloud’s position in the public service experience platforms market depends on security assurance and clearly defined operational benefits. Agencies also value the ability to update citizen-facing functions without maintaining extensive local infrastructure.
On-premises systems remain important for agencies operating under stringent data sovereignty requirements. France, Germany, India, and jurisdictions in the Middle East may restrict the use of infrastructure controlled by foreign entities for sensitive records. Hybrid models allow agencies to operate cloud-based citizen portals and workflow systems while retaining back-end records on premises during the migration process. FedRAMP authorization provides cloud products with a more favorable procurement position among U.S. federal agencies. Maryland’s planned 2026 migration of 4 billion tax records from a decades-old mainframe to a cloud platform illustrates the scale of workloads transitioning from legacy environments.
By Platform Type:
Citizen Engagement Portals Lead While Digital Identity AdvancesCitizen engagement portals are projected to account for 23.32% of the public service experience platforms market share in 2025. Every level of government requires a citizen-facing entry point for service catalogs, requests, and status updates. Earlier investments in portals, combined with mobile-first design requirements and accessibility regulations, support their market leadership. Service request management remains particularly important for local governments operating 311-style routing, tracking, and fulfillment systems. The public service experience platforms market size for citizen portals is supported by their role as the visible front door to government services.
Digital forms and workflow automation platforms are gaining traction as governments reduce paper-based procedures. The OECD reported that 89% of member countries had adopted service standards, while 55% used procurement approaches aligned with iterative digital delivery. Open data platforms support accountability requirements, as 94% of OECD countries require public institutions to publish open data; however, only 49% provide API access. Digital identity and authentication platforms are projected to expand at a CAGR of 14.78% through 2031. eIDAS 2 requirements and programs in Australia, Malaysia, and Peru support this segment, while demand for unified eligibility and benefit records drives the adoption of case and benefits management systems.
By Government Level:
Federal Revenue Leads as Municipal Adoption RisesFederal deployments are projected to account for 38.88% of revenue in 2025. High contract values, multiyear licensing agreements, and large-scale transformation programs support this position. Salesforce is expected to receive a USD 5.6 billion, 10-year IDIQ contract from the U.S. Army in January 2026 through its Missionforce National Security subsidiary. It is also expected to receive a USD 1.6 billion agentic enterprise license agreement with the Department of Veterans Affairs in July 2026. These awards underscore why the public service experience platforms market remains anchored by federal demand.
State and provincial governments represent a sizable middle tier, characterized by fragmented systems and complex integration requirements. Hawaii is expected to launch the ServiceNow AI Platform as a statewide enterprise service in 2026, supporting its help desk, knowledge management, and enterprise IT service management functions. Local and municipal deployments are projected to expand at a CAGR of 15.10% through 2031. Government technology providers have developed lower-cost, faster-to-deploy options for jurisdictions with limited budgets and technical staff. CivicPlus serves more than 10,000 local government clients and is expected to launch six AI-powered products in January 2026 for communications, meeting management, service requests, and code enforcement.

By Application:
Service Delivery Leads While Emergency Requests AdvanceService delivery applications are projected to account for 21.12% of revenue in 2025. These applications support the full service request lifecycle, from intake and routing to processing and resolution, making them a primary procurement priority across government levels. Citizen engagement and case management applications add capabilities for communications, eligibility management, benefits data, and cross-agency coordination. The public service experience platforms market continues to favor applications that reduce disconnected handoffs for government staff and citizens.
Permits and licensing systems present a clear operational case, as automated issuance can reduce processing times and in-person traffic. Payments and revenue collection tools are also becoming increasingly relevant as digital payment infrastructure advances. The OECD noted that many government service environments still lacked digital payment capabilities despite their benefits for citizen adoption. Public records and transparency applications remain linked to open-government compliance cycles. Emergency and non-emergency service request applications are projected to grow at a 14.87% CAGR through 2031, supported by AI-assisted capabilities such as TAMM’s planned October 2025 Snap and Report tool.
Geography Analysis
North America Public Service Experience Platforms Market
North America is projected to account for 38.49% of global revenue in 2025. The region's public service experience platforms market benefits from substantial transformation budgets, a mature government technology vendor base, and procurement vehicles that reduce transaction costs. In the United States, the Government Accountability Office's focus on 11 urgent legacy systems supports modernization efforts. Canada contributes through provincial cloud programs, while Mexico drives regional demand through cross-border trade digitization. The USD 5.6 billion U.S. Army contract award to Salesforce is expected to signal the federal government's long-term commitment to AI, CRM, and data analytics capabilities.
Europe Public Service Experience Platforms Market
Europe is the second-largest regional bloc, combining substantial identity investments with restrictions on certain cloud deployment options. The EU Digital Identity Wallet requirement mandates member-state delivery by 2026. Germany, France, and the United Kingdom account for a significant share of regional platform investment. In January 2025, the United Kingdom is expected to consolidate its digital service, central data office, and AI incubator into a Digital Center of Government. It is also expected to introduce GOV.UK Chat to help users navigate 122 government services. France's decree and the EU sovereignty framework favor providers with compliant European infrastructure.
APAC and MEA Public Service Experience Platforms Market
Asia-Pacific is projected to expand at a CAGR of 15.64% through 2031. National programs in India, South Korea, Japan, and Southeast Asia are shortening modernization timelines and procurement cycles. China relies primarily on state-controlled service platforms, while Japan uses a combination of domestic suppliers and global partners. The Middle East is investing in AI-native platforms, while Nigeria is expected to complete the deployment of its 1GOV Enterprise Content Management System in 2025.

Competitive Landscape
The public service experience platforms market has a moderately fragmented, two-tier competitive structure. Salesforce, Microsoft, ServiceNow, Oracle, and SAP compete for large federal and multi-agency contracts. Tyler Technologies, Granicus, OpenGov, Accela, and CivicPlus compete through government-specific capabilities and faster deployment schedules. ServiceNow's anticipated September 2025 OneGov agreement with the U.S. General Services Administration is expected to offer discounts of up to 70% on its AI Platform suite. The agreement is expected to support adoption across nearly all 50 U.S. states within 12 months.
Government technology specialists compete through preconfigured products, public-sector expertise, and rapid implementation. Granicus is expected to introduce its Federal Experience Cloud in January 2026 for its more than 7,000 public-sector clients. The suite is expected to combine AI agents, secure engagement tools, FedRAMP authorization, and data integration capabilities. Accela is expected to acquire Novotx in February 2026, expanding beyond permitting and licensing into infrastructure asset and work management. In April 2026, OpenGov is expected to broaden its platform with AI capabilities for budgeting, finance, permitting, procurement, and human capital management.
Competitive opportunities remain in multilingual and accessibility-compliant service delivery, proactive benefits access, and identity federation across government levels. Few platforms combine real-time translation and WCAG 2.2 compliance within citizen journey management. AI-native government technology startups are gaining early traction in smaller jurisdictions, potentially pressuring specialists who delay redesigning their platforms to support AI-enabled workflows. The public service experience platforms market has a concentration score of 4 out of 10, as combined market-share data for leading players do not support a more concentrated assessment. The supplier base includes global software providers and numerous government technology specialists.
Public Service Experience Platforms Industry Leaders
Salesforce, Inc.
Microsoft Corporation
Amazon Web Services, Inc.
Oracle Corporation
SAP SE
- *Disclaimer: Major Players sorted in no particular order
Public Service Experience Platforms Market Companies Covered in this Report
- Salesforce, Inc.
- Microsoft Corporation
- Amazon Web Services, Inc.
- Oracle Corporation
- SAP SE
- ServiceNow, Inc.
- IBM Corporation
- Accenture plc
- Deloitte Touche Tohmatsu Limited
- Capgemini SE
- CGI Inc.
- Tyler Technologies, Inc.
- Granicus, LLC
- CivicPlus, Inc.
- OpenGov, Inc.
- Accela, Inc.
- CentralSquare Technologies, LLC
- OpenText Corporation
- NEC Corporation
- Adobe Inc.

Recent Industry Developments in Public Service Experience Platforms Market
- July 2026: Salesforce was awarded a USD 1.6 billion, 3-year Agentic Enterprise License Agreement by the U.S. Department of Veterans Affairs through its Missionforce platform, aimed at unifying care coordination, reducing administrative friction, and deploying agentic AI tools across VA staff serving 9 million veterans. The contract is one of the largest AI-enabled government platform agreements in the healthcare and benefits management segment to date.
- July 2026: ServiceNow confirmed that nearly all 50 U.S. states are actively transforming citizen services using the ServiceNow AI Platform, with featured deployments including Hawaii's statewide enterprise platform, Raleigh's 66% cost-reduction service desk, and Washington, D.C.'s grants management modernization targeting a 50-60% reduction in processing time. The announcement reflects 12 months of momentum following the GSA OneGov agreement.
- June 2026: CivicPlus Agent released an integration with SeeClickFix 311 CRM, enabling residents to submit service requests through a guided conversational experience for the first time. The release marked CivicPlus Agent's first agentic integration, allowing the assistant to take action on behalf of residents without redirecting them to separate portals.
- April 2026: OpenGov expanded its Public Service Platform at OpenGov Conference 2026, introducing AI-powered enhancements to its ERP, human capital management system, and OG Assist AI assistant, embedding AI capabilities across budgeting, finance, permitting, and procurement on a unified data foundation. The update extends OpenGov's reach across more than 2,000 state and local government clients.


Global Public Service Experience Platforms Market Report Scope
The Public Service Experience Platforms Market Report is Segmented by Component (Software, and Services), Deployment Model (Cloud, On-Premises, and Hybrid), Platform Type (Citizen Engagement Portals, Service Request Management Platforms, Digital Forms and Workflow Automation Platforms, Open Data and Transparency Platforms, Digital Identity and Authentication Platforms, and Case and Benefits Management Platforms), Government Level (Federal, State and Provincial, and Local and Municipal), Application (Citizen Engagement, Service Delivery, Case Management, Permits and Licensing, Payments and Revenue Collection, Public Records and Transparency, and Emergency and Non-Emergency Service Requests), and Geography (North America, South America, Europe, Asia-Pacific, Middle East and Africa). The Market Forecasts are Provided in Terms of Value (USD).
| Software |
| Services |
| Cloud |
| On-Premises |
| Hybrid |
| Citizen Engagement Portals |
| Service Request Management Platforms |
| Digital Forms and Workflow Automation Platforms |
| Open Data and Transparency Platforms |
| Digital Identity and Authentication Platforms |
| Case and Benefits Management Platforms |
| Federal |
| State and Provincial |
| Local and Municipal |
| Citizen Engagement |
| Service Delivery |
| Case Management |
| Permits and Licensing |
| Payments and Revenue Collection |
| Public Records and Transparency |
| Emergency and Non-Emergency Service Requests |
| North America | United States |
| Canada | |
| Mexico | |
| South America | Brazil |
| Argentina | |
| Rest of South America | |
| Europe | Germany |
| United Kingdom | |
| France | |
| Rest of Europe | |
| Asia-Pacific | China |
| Japan | |
| India | |
| South Korea | |
| Rest of Asia-Pacific | |
| Middle East | Saudi Arabia |
| United Arab Emirates | |
| Rest of the Middle East | |
| Africa | South Africa |
| Nigeria | |
| Rest of Africa |
| By Component | Software | |
| Services | ||
| By Deployment Model | Cloud | |
| On-Premises | ||
| Hybrid | ||
| By Platform Type | Citizen Engagement Portals | |
| Service Request Management Platforms | ||
| Digital Forms and Workflow Automation Platforms | ||
| Open Data and Transparency Platforms | ||
| Digital Identity and Authentication Platforms | ||
| Case and Benefits Management Platforms | ||
| By Government Level | Federal | |
| State and Provincial | ||
| Local and Municipal | ||
| By Application | Citizen Engagement | |
| Service Delivery | ||
| Case Management | ||
| Permits and Licensing | ||
| Payments and Revenue Collection | ||
| Public Records and Transparency | ||
| Emergency and Non-Emergency Service Requests | ||
| By Geography | North America | United States |
| Canada | ||
| Mexico | ||
| South America | Brazil | |
| Argentina | ||
| Rest of South America | ||
| Europe | Germany | |
| United Kingdom | ||
| France | ||
| Rest of Europe | ||
| Asia-Pacific | China | |
| Japan | ||
| India | ||
| South Korea | ||
| Rest of Asia-Pacific | ||
| Middle East | Saudi Arabia | |
| United Arab Emirates | ||
| Rest of the Middle East | ||
| Africa | South Africa | |
| Nigeria | ||
| Rest of Africa | ||


Key Questions Answered in the Report
What is the size of the public service experience platforms market?
The public service experience platforms market was valued at USD 13.12 billion in 2025 and is estimated at USD 14.58 billion in 2026. It is forecast to reach USD 27.92 billion by 2031.
What is driving demand for public service experience platforms?
Demand is supported by legacy system modernization, omnichannel service requirements, AI-based case resolution, and digital identity programs.
Which component held the largest share in 2025?
Software held 72.12% of revenue in 2025, supported by recurring SaaS licensing across government procurement frameworks.
Which deployment model is expanding fastest?
Cloud was the fastest-growing deployment model, with a projected CAGR of 15.26% through 2031.
Which government level is expanding fastest?
Local and municipal deployments are projected to expand at a 15.10% CAGR through 2031 as smaller jurisdictions adopt lower-cost and faster deployment options.
Which region is projected to expand fastest?
Asia-Pacific is projected to expand at a 15.64% CAGR through 2031, supported by national digital government programs and newer government technology deployments.
Page last updated on:





