Market Overview
| Study Period | 2020 - 2031 |
|---|---|
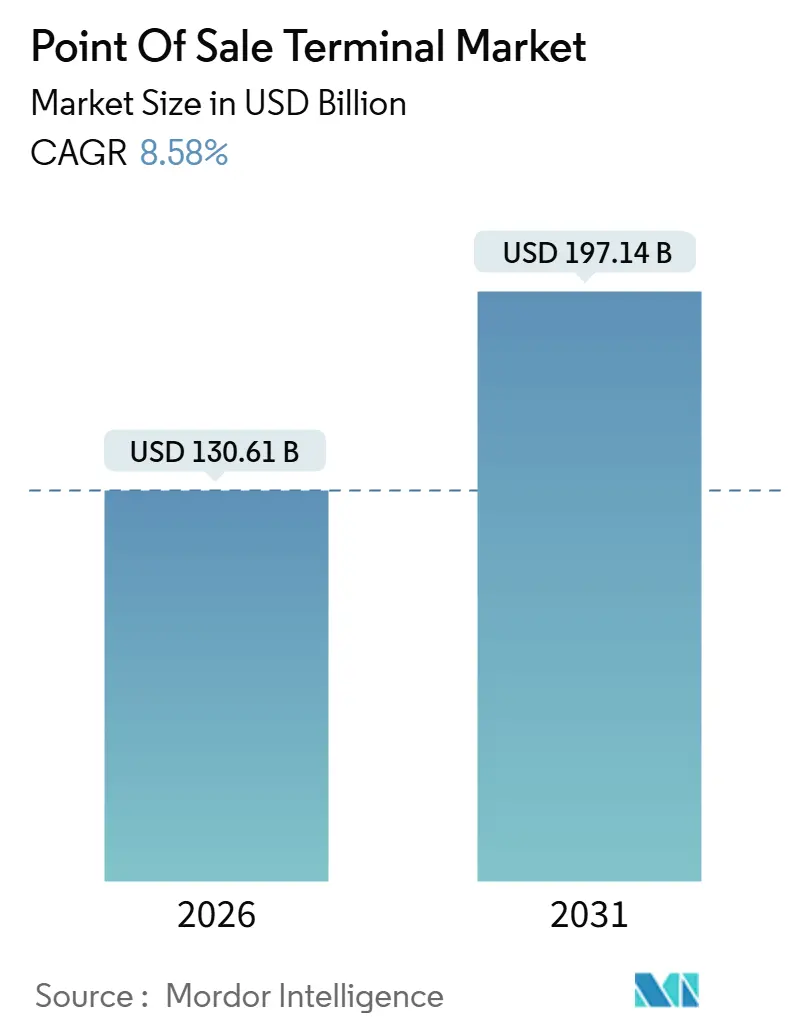
| Market Size (2026) | USD 130.61 Billion |
| Market Size (2031) | USD 197.14 Billion |
| Growth Rate (2026 - 2031) | 8.58% CAGR |
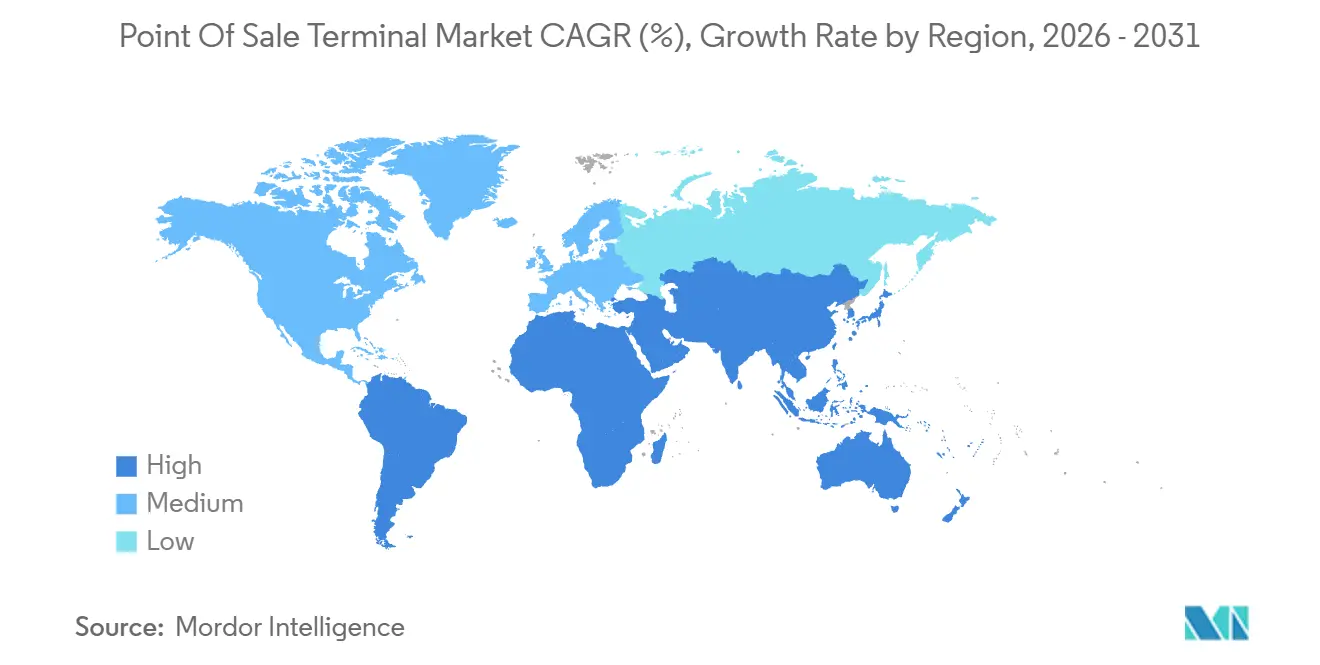
| Fastest Growing Market | South America |
| Largest Market | Asia Pacific |
| Market Concentration | Medium |
Major Players *Disclaimer: Major Players sorted in no particular order Image © Mordor Intelligence. Reuse requires attribution under CC BY 4.0. | |
Point Of Sale Terminal Market Analysis by Mordor Intelligence
The Point-of-Sale Terminal market size stood at USD 130.61 billion in 2026 and is projected to reach USD 197.14 billion by 2031, translating into an 8.58% CAGR during 2026-2031. Demand is rising as governments legislate electronic invoicing, retailers orchestrate seamless omnichannel checkout, and healthcare providers accelerate digital billing. Hardware commoditization, cloud-native software, and embedded finance are reshaping vendor economics, while contactless acceptance and mobile wallets keep card-present payments relevant. Semiconductor supply-chain volatility is easing, yet cybersecurity standards such as PCI DSS v4.0 have lifted compliance costs. Competition is shifting toward software-centric platforms that monetize subscriptions rather than single-device sales, trimming margins for traditional hardware makers.
Key Report Takeaways
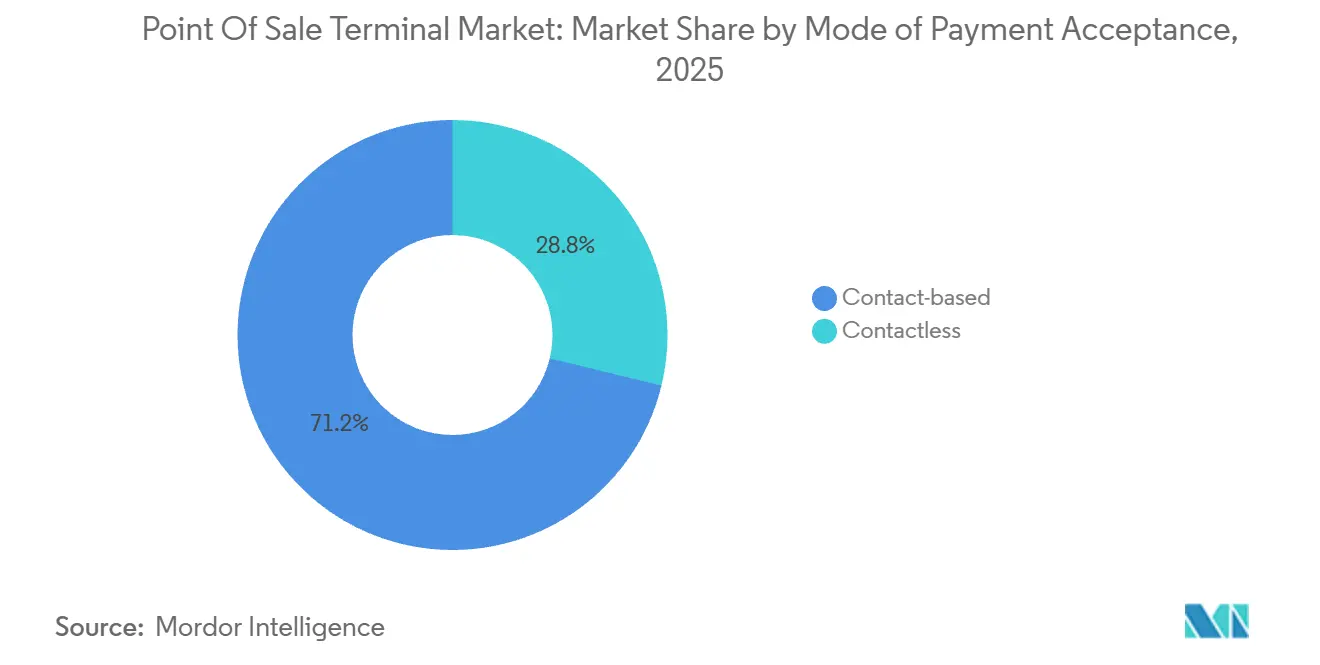
- By mode of payment acceptance, contact-based terminals led with 71.23% revenue share in 2025; contactless systems are expanding at a 9.32% CAGR through 2031.
- By POS type, fixed systems commanded 54.42% of the Point-of-Sale Terminal market share in 2025, yet mobile and portable variants are advancing at a 9.67% CAGR to 2031.
- By component, hardware generated 63.14% of 2025 revenue, whereas software is poised to grow at a 9.83% CAGR over 2026-2031.
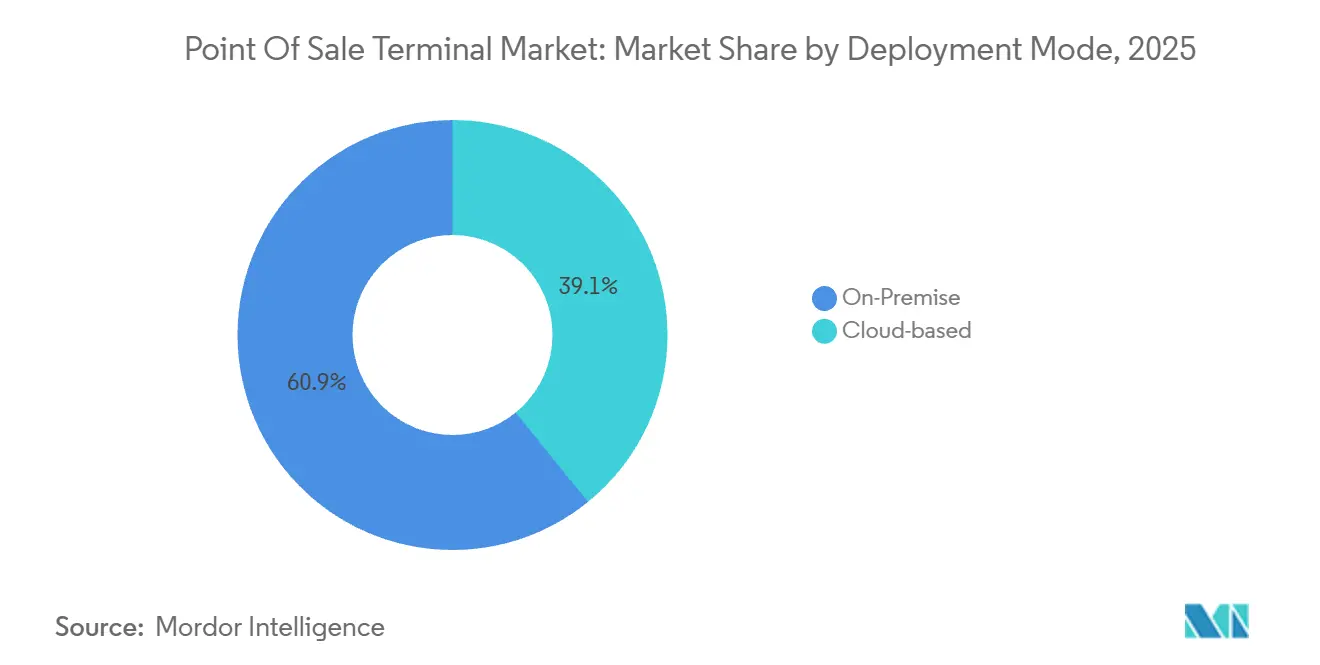
- By deployment mode, on-premise installations held 60.86% share in 2025; cloud architectures are scaling at a 9.48% CAGR during the forecast window.
- By end-user industry, retail captured 34.83% of 2025 demand, while healthcare is projected to post a 10.23% CAGR to 2031.
- By geography, Asia-Pacific accounted for 40.52% of 2025 turnover, and South America is forecast to expand at a 10.18% CAGR through 2031.
Note: Market size and forecast figures in this report are generated using Mordor Intelligence’s proprietary estimation framework, updated with the latest available data and insights as of January 2026.
Global Point Of Sale Terminal Market Trends and Insights
Drivers Impact Analysis
| Driver | (~) % Impact on CAGR Forecast | Geographic Relevance | Impact Timeline |
|---|---|---|---|
| Growing Adoption in the Retail Sector | +1.8% | Asia-Pacific, North America | Medium term (2-4 years) |
| Rising Adoption of Cloud-based POS Platforms | +1.6% | North America, Europe | Short term (≤2 years) |
| Accelerating Demand for Contactless and Mobile Payments | +1.5% | Europe, Asia-Pacific | Short term (≤2 years) |
| Integration of POS Data with Advanced Analytics and CRM | +1.2% | North America, Europe | Medium term (2-4 years) |
| Regulatory Push for Fiscalisation and E-invoicing Mandates | +1.4% | Europe, South America, Asia-Pacific | Long term (≥4 years) |
| Subscription-based POS-as-a-Service Models Lowering Cap-Ex | +1.1% | North America, Europe | Medium term (2-4 years) |
| Source: Mordor Intelligence | |||
Growing Adoption in the Retail Sector
Unified commerce initiatives allow store, online, and mobile purchases to clear through a single terminal interface, enabling stock sourced from store shelves to fulfill digital orders and trimming last-mile costs. Quick-service restaurants deploy self-service kiosks that marry payment with menu customization, cutting labor expenses and boosting basket size by presenting algorithmic add-ons. Grocery chains in Europe and North America piloted scan-and-go phone apps that let shoppers bypass staffed lanes, though theft controls and age-verification rules remain hurdles. Fashion stores equip associates with mobile devices that close sales on the showroom floor, slashing queue abandonment. Luxury retailers embed fingerprint readers to streamline identity confirmation for installment financing and loyalty redemption.
Rising Adoption of Cloud-based POS Platforms
Cloud architectures decouple processing logic from fixed hardware, so merchants retrieve transaction, stock, and customer data from any web device, a model that trims on-site IT costs.[1] PCI Security Standards Council, “Data Security Standard v4.0,” pcisecuritystandards.org Automatic software updates end the expense of technician truck rolls, a boon to chains operating hundreds of terminals. Subscription pricing converts cap-ex to forecastable op-ex, making upgrades affordable for small businesses. Open application-programming-interfaces weave accounting, workforce scheduling, and marketing functions around the core payment flow, transforming terminals into business-management hubs. Continuous cloud backup improves disaster recovery, and provider-level PCI compliance shifts audit complexity away from individual merchants.
Accelerating Demand for Contactless and Mobile Payments
Contactless accounted for more than 60% of card-present purchases in the United Kingdom during 2025.[2]UK Finance, “UK Payment Statistics 2025,” ukfinance.org.uk Central banks across Europe and Asia raised no-PIN limits in 2024-2025, making tap-to-pay viable for mid-value tickets. Smartphones and wearables with near-field communication chips are displacing plastic, especially among urban millennials who find wallets inconvenient. Quick-response code rails dominate in China and India, letting merchants display static codes that customers scan using mobile banking apps and cutting terminal hardware costs. Transit agencies worldwide now accept open-loop cards at turnstiles, reducing fare-card production outlays and improving commuter throughput.
Integration of POS Data with Advanced Analytics and CRM
Modern systems capture granular metadata time, basket mix, tender type and feed machine-learning models that forecast demand, optimize staffing, and personalize offers. Linking receipts to customer profiles lets retailers trigger automated messages when order frequency dips, raising lifetime value. Restaurants mine check-level data to spot menu items with high waste, correcting portion sizes and lifting margin. Real-time fraud engines flag suspicious patterns such as unusually rapid high-value purchases, lowering chargebacks. Privacy statutes like Europe’s General Data Protection Regulation require anonymized storage that still preserves analytical utility.
Restraints Impact Analysis
| Restraint | (~) % Impact on CAGR Forecast | Geographic Relevance | Impact Timeline |
|---|---|---|---|
| Data-Security and Cyber-fraud Concerns | -0.9% | North America, Europe | Short term (≤2 years) |
| Hardware Reliability and Maintenance-cost Issues | -0.7% | Emerging and developed markets | Medium term (2-4 years) |
| Fragmentation of Regional Payment Standards | -0.6% | Asia-Pacific, Africa | Long term (≥4 years) |
| Semiconductor Supply-chain Volatility | -0.8% | Global | Short term (≤2 years) |
| Source: Mordor Intelligence | |||
Data-Security and Cyber-fraud Concerns
Malware that scrapes volatile memory can snatch raw card data before encryption if firmware patches lag, keeping terminals an attractive attack vector. PCI DSS penalties may reach USD 500,000 per breach and prolonged non-compliance can lead to terminated processing privileges. Small businesses often lack cybersecurity staff, so outdated software persists. Tokenization and point-to-point encryption curb risk, yet hardware and acquirer upgrades impose costs that deter adoption. Europe’s Digital Operational Resilience Act now forces payment providers to report incidents within 24 hours, lifting compliance budgets.
Hardware Reliability and Maintenance-cost Issues
Terminals endure spills, dust, and thousands of keypresses, so failures cause immediate revenue loss for quick-service operators whose customers depart if cards cannot be accepted. Standard maintenance contracts run 10-15% of purchase price each year, eroding perceived ownership savings. Peripheral devices such as receipt printers introduce extra points of failure, and sourcing parts for discontinued models can take weeks. Emerging-market merchants must often ship devices to distant service hubs, sidelining capital and disrupting workflows. Mobile units degrade faster because battery cycles shorten lifespan, and e-waste rules in Europe and North America impose extra disposal costs.[3]United States Environmental Protection Agency, “Electronics Waste Management,” epa.gov
Segment Analysis
By Mode of Payment Acceptance: Contactless Gains Despite Contact-based Dominance
Contact-based terminals accounted for 71.23% of the Point-of-Sale Terminal market revenue in 2025, a legacy of chip-and-PIN rollouts following global liability shifts. High-ticket merchants still favor the added security of PIN verification. Contactless acceptance is scaling at a 9.32% CAGR through 2031, fueled by tap-and-go convenience and government incentives that penalize cash-heavy operations. Transit agencies, convenience stores, and quick-service restaurants lead adoption because faster throughput trims queue times.
Hybrid devices accepting both contact and contactless are becoming standard, as a near-field antenna adds only USD 2-3 to the bill of materials. In the Asia-Pacific region, static quick-response codes further diversify checkout options, allowing merchants to forgo costly hardware. Early pilots of biometric authentication, fingerprint and facial recognition, are underway in luxury retail and hospital pharmacies to accelerate identity proofing.
Get Detailed Market Forecasts at the Most Granular Levels
Download PDF
By POS Type: Mobile Variants Disrupt Fixed-terminal Incumbents
Fixed countertop systems still accounted for 54.42% of the Point-of-Sale Terminal market in 2025, buoyed by grocery chains and pharmacies that process high transaction volumes at staffed stations. Integrated scanners and cash drawers maximize cashier efficiency where space and power are plentiful. Mobile and portable units, however, are advancing at a 9.67% CAGR, enticing food trucks, repair technicians, and outdoor vendors that require payment anywhere service is delivered.
Tablet-based systems dominate upscale restaurants, allowing servers to split checks and process payments tableside, reducing table turns and boosting tip percentages. Wearable forms such as wristbands and rings are trialed at festivals and stadiums, though limited battery life keeps usage niche. Ruggedized handhelds serve warehouses and courier fleets, marrying inventory scanning with payment collection under harsh conditions.
By Component: Software Monetization Reshapes Vendor Economics
Hardware contributed 63.14% of the Point-of-Sale Terminal market in 2025, yet vendor focus is tilting toward recurring software revenue. Software is projected to post a 9.83% CAGR, powered by artificial-intelligence fraud scoring, live stock synchronization, and customer-relationship modules that merchants prize more than incremental hardware speed. Remote update capability compresses feature cycles from years to weeks, creating algorithmic moats.
Global contract manufacturers now produce white-label terminals that software firms brand and ship, eroding margins for incumbent vendors reliant on proprietary devices. Standardized application programming interfaces enable merchants to swap software without discarding hardware, diluting lock-in. Embedded finance features, buy-now-pay-later or working-capital advances, allow vendors to earn interchange and loan fees on top of subscriptions.
By Deployment Mode: Cloud Migration Accelerates Despite On-premise Inertia
On-premise deployments still held 60.86% the Point-of-Sale Terminal market share in 2025, notably among large chains that invested in self-hosted data centers for sovereignty and uptime. This approach slows upgrade cadence and inflates disaster-recovery budgets. Cloud architectures are on an upward 9.48% CAGR trajectory as small and mid-sized merchants embrace subscription pricing that eliminates upfront spend and sends automatic updates overnight.
Hybrid models keep payment logic local for offline resilience yet replicate data to the cloud for analytics. Grocers and pharmacies favor this architecture, balancing uptime with insight. Edge computing trials aim to shave latency for real-time fraud checks, but adoption is early. PCI DSS v4.0 now codifies controls for virtualized environments, smoothing compliance hurdles.
Get Detailed Market Forecasts at the Most Granular Levels
Download PDF
By End-User Industry: Healthcare Emerges as Growth Frontier
Retail captured 34.83% of 2025 demand and remains the largest vertical, though expansion stems mainly from replacement and feature upsell. Healthcare is forecast to compound at 10.23% through 2031 as hospitals roll out bedside kiosks that collect co-pays during patient care, shortening revenue cycles and improving satisfaction. Hospitality operators integrate terminals with property-management software to unify guest billing, while logistics fleets outfit drivers with handheld readers that speed cash-on-delivery reconciliation.
Healthcare momentum flows from electronic-health-record mandates and reimbursement models that penalize claim delays. Terminals tied to record systems enable nurses to confirm insurance coverage, process payments, and issue receipts without leaving patient rooms. Pharmacies are rolling out prescription-verification features to meet controlled-substance rules, and telemedicine providers embed payment links at session end to raise collection rates.
Geography Analysis
Asia-Pacific delivered 40.52% of 2025 turnover, anchored by China’s vast merchant base and India’s Unified Payments Interface. China’s shift from QR codes to contactless near-field communication is accelerating as global wallets compete for traffic. India’s tax digitization push lifted terminal density, though rural adoption lags due to connectivity and fee sensitivity. Japan’s aging demography tempers mobile uptake yet the 2025 Osaka Expo spurred hospitality upgrades. South Korea serves as a sandbox for biometric settlement trials, while Indonesia, Thailand, and Vietnam lean on omnichannel platforms to mesh e-commerce with storefronts.
Europe is in a replacement cycle triggered by fiscalization edicts such as the VAT in the Digital Age plan and Germany’s Kassensicherungsverordnung. Certified security modules raise hardware costs but give tax agencies real-time visibility. The United Kingdom’s post-Brexit divergence forces retailers to juggle distinct device configurations. Nordic countries are nearing cashless status, reducing demand for hybrid cash-card terminals, while EU accession is spurring infrastructure modernization in Eastern Europe.
North America is mature yet innovation-rich. Integrated platforms from Square and Toast displace legacy vendors by bundling payroll, analytics, and loyalty. State-level tax variation and patchwork privacy rules create compliance complexity that favors automated software. Canada’s real-time rails improve cash flow for merchants, while Mexico’s expanded e-invoicing mandate pushes micro-businesses toward certified devices despite uneven rural enforcement.
South America is the fastest riser at a predicted 10.18% CAGR, led by Brazil’s Nota Fiscal Eletrônica, which fines non-compliant merchants in real time. Argentina’s inflation pushes consumers toward installment card plans, expanding electronic acceptance. Chile and Colombia are drafting similar fiscal frameworks, opening regional opportunities for vendors with service coverage. The Middle East and Africa remain nascent, but mobile money in Kenya and Nigeria is laying alternative rails that may leapfrog conventional terminals.
Get Analysis on Important Geographic Markets
Download PDF
Competitive Landscape
Competition is moderately fragmented. Legacy hardware leaders Ingenico, Verifone, and PAX Technology face margin squeeze from software-first challengers like Square, Toast, and Shopify that anchor revenue in subscriptions. Incumbents respond with cloud launches and acquisitions, yet entrenched sales channels slow pivot speed. Vertical specialization intensifies as vendors craft pharmacy-ready prescription checks, restaurant table management, or salon appointment modules.
Technology differentiation centers on artificial-intelligence fraud engines, live inventory data, and embedded finance. Worldline is integrating biometric authentication and blockchain settlement into its terminals after acquiring Ingenico, though integration delays have slowed rollouts.
Patent filings show continued work on miniaturized contactless antennas and hardened secure-element chips, where incumbents retain engineering heft. Low-cost entrants leveraging open-source stacks and contract manufacturing undercut prices, appealing to cost-sensitive merchants but raising long-term support questions.
Point Of Sale Terminal Industry Leaders
Ingenico SA (Worldline)
VeriFone Systems Inc.
PAX Technology Ltd.
NCR Corporation
Diebold Nixdorf Inc.
- *Disclaimer: Major Players sorted in no particular order

Need More Details on Market Players and Competitors?
Download PDF
Recent Industry Developments
- January 2026: Worldline partnered with Microsoft to embed Azure artificial-intelligence models into terminals, enabling real-time fraud scoring and contextual offers.
- December 2025: Block Inc. released Square Terminal 3 with a larger display, faster processor, and extended battery, targeting restaurants and field service fleets.
- November 2025: PAX Technology secured USD 150 million from Ant Group to expand Southeast Asian manufacturing and accelerate contactless product launches.
- October 2025: Toast acquired Sling for USD 400 million, adding workforce scheduling and payroll to its restaurant-focused platform.
Research Methodology Framework and Report Scope
Market Definitions and Key Coverage
Our study defines the point-of-sale (POS) terminal market as all new fixed or mobile electronic devices, together with the embedded software, that authorize, route, and record card or wallet payments at a merchant location, while also delivering core functions such as inventory tracking and basic customer data capture. According to Mordor Intelligence analysts, values reflect factory-built hardware plus pre-installed applications and the first year of bundled services.
Scope exclusion: Fiscal printers, stand-alone card readers without inventory capability, and refurbished or rental units have been kept outside the sizing.
Segmentation Overview
- By Mode of Payment Acceptance
- Contact-based
- Contactless
- By POS Type
- Fixed Point-of-Sale Systems
- Mobile / Portable Point-of-Sale Systems
- By Component
- Hardware
- Software
- Services
- By Deployment Mode
- Cloud-based
- On-Premise
- By End-User Industry
- Retail
- Hospitality
- Healthcare
- Transportation and Logistics
- Other End-User Industries
- By Geography
- North America
- United States
- Canada
- Mexico
- Europe
- Germany
- United Kingdom
- France
- Spain
- Italy
- Rest of Europe
- Asia-Pacific
- China
- Japan
- India
- South Korea
- Southeast Asia
- Rest of Asia-Pacific
- South America
- Brazil
- Argentina
- Rest of South America
- Middle East and Africa
- Middle East
- GCC
- Turkey
- Rest of Middle East
- Africa
- South Africa
- Nigeria
- Rest of Africa
- Middle East
- North America
Detailed Research Methodology and Data Validation
Primary Research
Mordor's team interviewed POS hardware makers, payment processors, large retailers, and regional fintech associations across North America, Europe, and Asia.
These discussions validated channel inventory levels, cloud-subscription attach rates, and the speed at which merchants retire legacy cash registers, giving us confidence to adjust secondary indicators and seasonality factors.
Desk Research
We began with publicly available government data, such as U.S. Census retail sales tables, Reserve Bank of India digital-payments dashboards, and Eurostat's card-in-circulation series, which helped us anchor transaction pools and replacement cycles.
Trade bodies, for example, the Electronic Transactions Association and Payments UK, offered shipment benchmarks and regulatory timelines on contactless limits.
Company 10-Ks, investor decks, and customs shipment records (sourced through Volza) further clarified average selling prices and export flows.
Paid resources like D&B Hoovers and Dow Jones Factiva supplied revenue splits and recent contract wins that sharpened competitive share estimates.
The sources listed are illustrative; many others informed data validation and gap checks.
Market-Sizing & Forecasting
A top-down model starts with card and mobile payment volumes, converts them to terminal demand through penetration ratios, and is then reconciled with bottom-up roll-ups from leading suppliers and sampled distributor checks.
Key variables include: 1) installed base aging curve, 2) yearly cash-to-digital share shift, 3) average terminal ASP, 4) cloud POS subscription penetration, 5) retail floor-space growth, and 6) replacement mandates tied to fiscalisation or PCI updates.
Multivariate regression on these drivers, combined with scenario analysis for macro shocks, produces the 2025-2030 outlook.
Where supplier roll-ups fell short in emerging regions, we bridged gaps using import data and calibrated ASPs before final triangulation.
Data Validation & Update Cycle
Each draft passes two analyst reviews that flag anomalies against independent payment and retail indices.
Variances beyond three percentage points trigger re-checks with industry contacts.
Reports are refreshed annually, and material events, such as sudden regulatory shifts, prompt interim updates so clients always receive an up-to-date baseline.
Why Mordor's Point Of Sale Terminal Baseline Is Trusted by Decision-Makers
Published market sizes often diverge because firms vary geographic scope, count software differently, or refresh data on uneven cadences.
By aligning definitions with what merchants actually deploy and by updating models every twelve months, Mordor provides a balanced midpoint that executives can benchmark with minimal adjustment.
Benchmark comparison
| Market Size | Anonymized source | Primary gap driver |
|---|---|---|
| USD 121.35 Bn (2025) | Mordor Intelligence | - |
| USD 113.38 Bn (2024) | Global Consultancy A | Includes refurbished units and a limited Asia sample, causing lower total |
| USD 106.18 Bn (2025) | Trade Journal B | Excludes cloud-based POS subscriptions and applies a single global ASP |
The comparison shows that once differences in scope and ASP logic are stripped out, other estimates converge toward our number, underscoring how Mordor's disciplined variable selection and annual refresh cycle yield a dependable, transparent baseline for planning.
Need A Different Region or Segment?
Customize Now
Key Questions Answered in the Report
How large is the Point-of-Sale Terminal market in 2026?
The Point-of-Sale Terminal market size reached USD 130.61 billion in 2026.
What CAGR is expected for global POS terminals through 2031?
Worldwide revenue is forecast to expand at an 8.58% CAGR between 2026 and 2031.
Which payment acceptance mode is growing fastest?
Contactless systems are projected to grow at a 9.32% CAGR, reflecting consumer preference for tap-and-go transactions.
Why are healthcare providers investing in POS terminals?
Hospitals and pharmacies deploy bedside kiosks and verification features to shorten billing cycles and boost compliance, driving a 10.23% CAGR in the sector.
How are cloud deployments affecting POS economics?
Subscription-based cloud platforms shift spending from cap-ex to op-ex, reduce on-site IT work, and enable rapid software updates, accelerating vendor revenue diversification.
Which region will record the highest growth to 2031?
South America is poised for the fastest regional expansion with a projected 10.18% CAGR, led by Brazilian and Argentine fiscal mandates.


