Piston Engine Aircraft Market Size and Share
Market Overview
| Study Period | 2019 - 2031 |
|---|---|
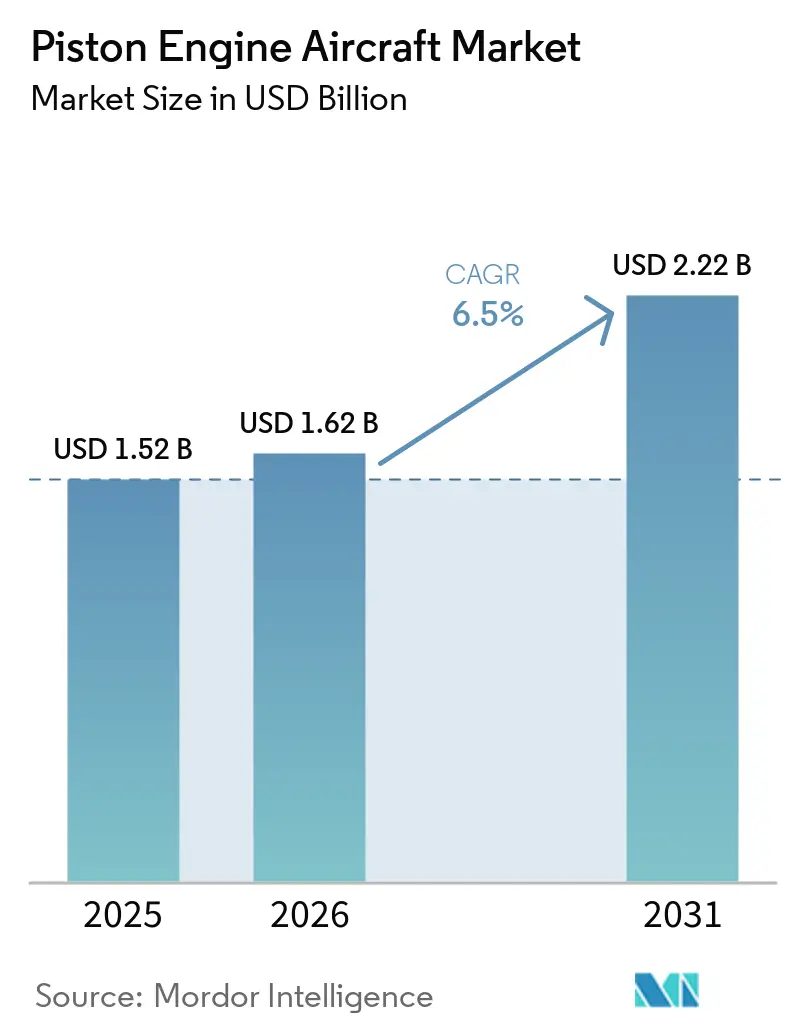
| Market Size (2026) | USD 1.62 Billion |
| Market Size (2031) | USD 2.22 Billion |
| Growth Rate (2026 - 2031) | 6.50% CAGR |
| Fastest Growing Market | Asia Pacific |
| Largest Market | North America |
| Market Concentration | Medium |
Major Players *Disclaimer: Major Players sorted in no particular order Image © Mordor Intelligence. Reuse requires attribution under CC BY 4.0. | |
Piston Engine Aircraft Market Analysis by Mordor Intelligence
The piston engine aircraft market size is expected to grow from USD 1.52 billion in 2025 to USD 1.62 billion in 2026, and is forecast to reach USD 2.22 billion by 2031 at a 6.50% CAGR over 2026-2031. The near-term outlook is supported by pilot retirements that tighten training capacity, steady gains from diesel piston adoption that reduce fuel burn, and China’s acceleration of general-aviation airport approvals that expand addressable demand for trainers and utility platforms. Training throughput rises as major US airlines sustain hiring pipelines, which keep primary trainers and multi-engine fleets busy across collegiate and independent flight schools. Diesel-powered models such as Piper’s Seminole DX signal a pivot to Jet A compatibility and lower hourly costs for schools operating across regions where avgas is expensive or inconsistent. China’s 2024 authorization of new general-aviation airports compounds long-term fleet additions in Asia-Pacific and creates durable demand for multi-mission piston fleets. North America remains the anchor for deliveries and fleet utilization, supported by the densest general aviation infrastructure and a high share of global piston shipments.
Key Report Takeaways
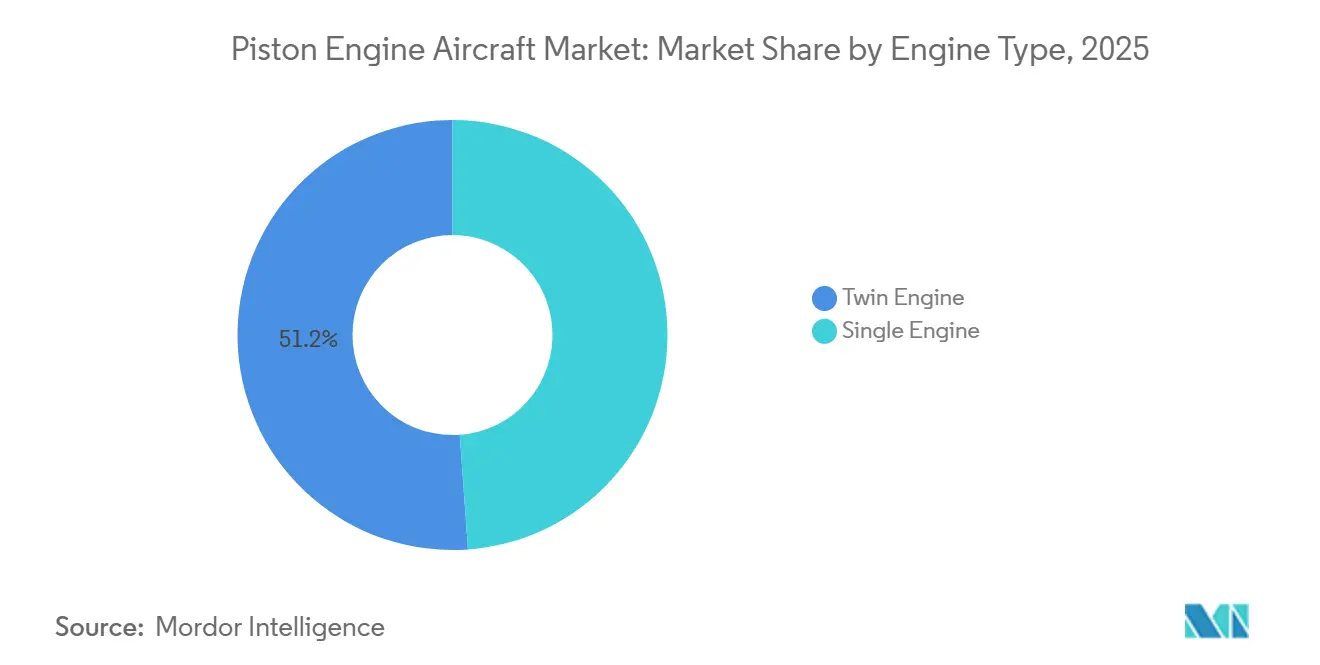
- By engine type, twin-engine variants led with 51.15% revenue share in 2025; single-engine platforms are forecasted to expand at a 6.83% CAGR through 2031.
- By end-user, government and military accounted for 74.55% of 2025 consumption; civil and commercial operators are projected to grow at a 6.74% CAGR through 2031.
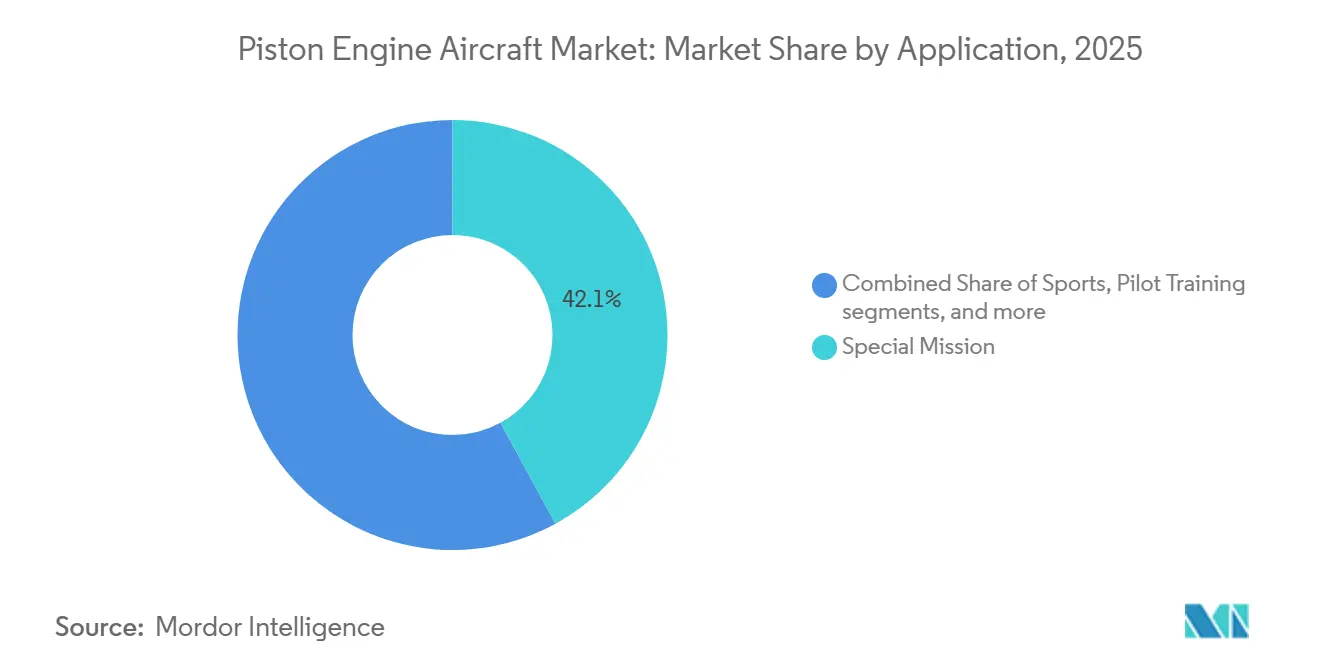
- By application, special-mission platforms captured a 42.05% share of the piston engine market in 2025; air-taxi and charter services are projected to grow at an 8.88% CAGR through 2031.
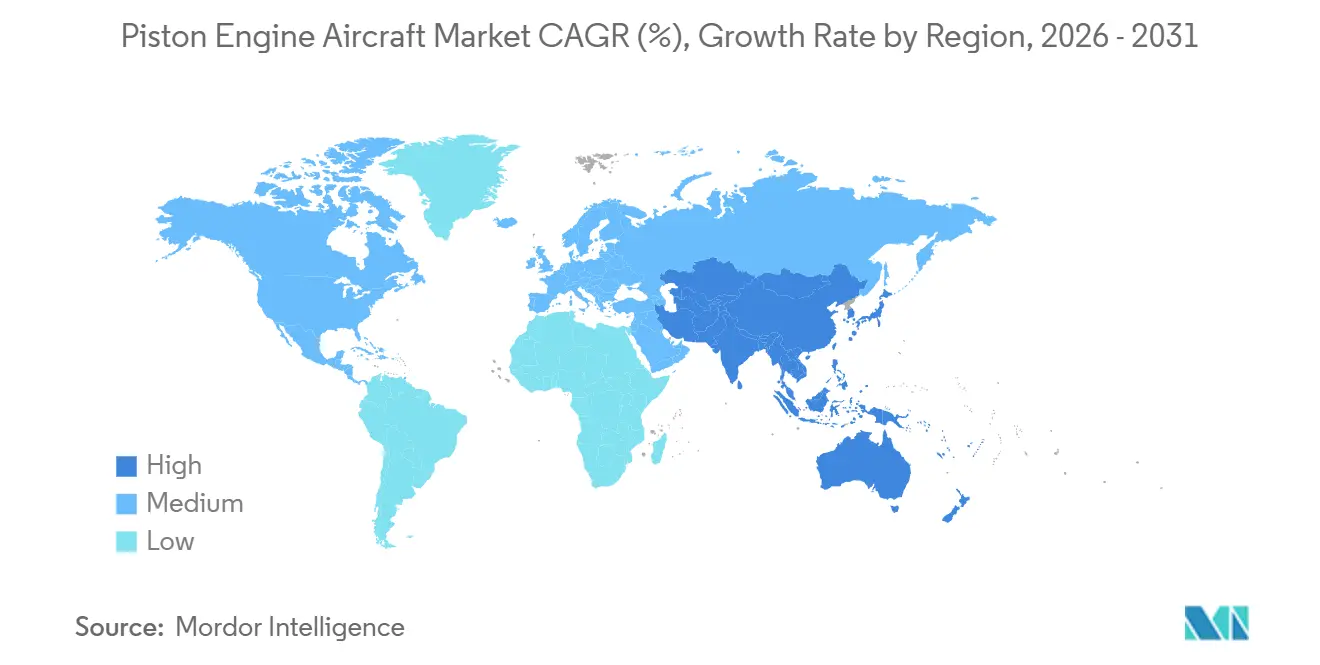
- By geography, North America held a 39.1% share in 2025, while Asia-Pacific is projected to post a 6.98% CAGR through 2031.
Note: Market size and forecast figures in this report are generated using Mordor Intelligence’s proprietary estimation framework, updated with the latest available data and insights as of 2026.
Global Piston Engine Aircraft Market Trends and Insights
Driver Impact Analysis*
| Driver | (~) % Impact on CAGR Forecast | Geographic Relevance | Impact Timeline |
|---|---|---|---|
| Growing demand for training aircraft due to pilot shortage | +1.8% | Global, with early gains in North America, Asia-Pacific | Medium term (2-4 years) |
| Rising adoption of piston-diesel engines for fuel efficiency | +1.2% | Europe, North America core, spill-over to Asia-Pacific | Long term (≥ 4 years) |
| Expanding general aviation infrastructure in emerging markets | +1.4% | APAC core, Middle East, Latin America | Long term (≥ 4 years) |
| Recreational flying boom among high-net-worth individuals (HNWIs) | +0.9% | North America, Europe, Middle East | Short term (≤ 2 years) |
| Light sport aircraft regulatory relaxation | +1.0% | National US, with early gains in Europe | Medium term (2-4 years) |
| Electronic ignition and FADEC innovations reducing maintenance costs | +0.7% | Global | Medium term (2-4 years) |
| Source: Mordor Intelligence | |||
Growing Demand for Training Aircraft Due to Pilot Shortage
Demand for training aircraft remains strong as global pilot demand remains elevated and large US carriers continue hiring at a pace in 2026. United Airlines targets 2,500 pilot hires in 2026, with American near 1,500 and Delta near 600 in Q1 alone, which sustains the flow of students into primary and multi-engine training programs that rely on piston fleets. Flight schools are scaling capacity with fleet orders, including Embry-Riddle’s 50-unit Archer TX addition in 2024 and the University of North Dakota’s deal for up to 188 Piper aircraft over eight years starting 2027, valued at USD 155 million. CAE projects demand for 300,000 new pilots over 2025-2034, including 101,000 in Asia-Pacific and 79,000 in North America, which anchors multi-year trainer procurement plans.[1]CAE, “Aviation Talent Forecast 2025–2034,” CAE, cae.com In China, the Civil Aviation Flight University operates a 400-aircraft training fleet that logs 500,000 annual flight hours, and the country’s plan calls for more private and sport licenses supported by an expanding base of certified schools. These dynamics strengthen the piston engine aircraft market, as trainers are the foundational aircraft for ab initio and instrument proficiency programs.
Rising Adoption of Piston-Diesel Engines for Fuel Efficiency
Operators are adopting diesel piston platforms that run on widely available Jet A, lowering operating costs and extending range for training and utility roles. Piper’s diesel-powered Seminole DX with the DHK4A180 engine targets 35% lower fuel burn, faster single-engine climb, and a significantly higher single-engine ceiling, with FAA approval expected in Q3 2026 and deliveries beginning in 2027. Diesel powerplants can reduce fuel consumption by up to 40% versus avgas equivalents, helping schools and charter operators manage volatility in avgas availability and price. Diamond’s DA40 NG and DA42 NG, powered by Austro AE300 or AE330 jet-fuel piston engines, surpassed 5 million flight hours across 5,500 engines in 82 countries by December 2025, a scale milestone that validates fleet reliability and service support.[2]Diamond Aircraft Industries, “Austro Engine Surpasses 5 Million Flight Hours Across Global Diamond Aircraft Fleet,” Diamond Aircraft Industries, diamonaircraft.com EASA’s environmental framework reinforces the move toward lower-emission solutions. At the same time, electric propulsion’s noise signature points the way to quieter operations, positioning diesel pistons as a pragmatic bridge to future hybrid and electric concepts. As schools standardize on Jet A platforms and FADEC-enabled controls, training organizations gain dispatch reliability and simplified engine management compared to legacy avgas architectures.
Expanding General Aviation Infrastructure in Emerging Markets
Infrastructure investment creates the runway for new training and multi-mission operations, especially in the Asia-Pacific and the Middle East. China authorized 239 new general-aviation airports in 2024 and plans to expand the registered general aviation aircraft base and emergency rescue capabilities across more provinces by 2025, unlocking demand for trainers and utility pistons for aerial work. The country’s longer-range fleet outlook to 2040 anticipates a large general aviation fleet, with a high share dedicated to training, which will sustain a procurement cycle for popular piston models from global and local OEMs. Intercontinental Aviation Enterprise’s late-2025 order for 10 Diamond aircraft across DA40 NG and DA42-VI variants for multi-country training further demonstrates cross-border fleet placement aligned with growing student cohorts. Saudi Arabia’s investment plan for new general aviation fields points to higher charter and training activity. At the same time, India’s efforts to streamline licensing for non-scheduled operators make it easier for flight schools and service providers to scale. These moves expand the geographic footprint of demand, supporting a broader installed base across the piston engine aircraft market.
Light Sport Aircraft Regulatory Relaxation
The FAA’s MOSAIC rule, effective October 22, 2025, expands light-sport parameters with higher stall speeds, retractable gear, constant-speed props, and up to four seats for airplanes, which enlarges the fleet that can be flown under sport-pilot privileges. The rule allows pilots to operate popular four-seat trainers with only one passenger under sport-pilot privileges in certain conditions, reducing barriers to entry and helping flight schools broaden pipelines for prospective students.[3]Aircraft Owners and Pilots Association, “Light sport rules expand dramatically,” AOPA, aopa.org AOPA notes that there were 7,309 sport-pilot certificate holders at the end of 2024, leaving significant headroom for growth under the expanded envelope. The rule credits limited simulator time and allows night operations with proper endorsements and medicals, which improves training flexibility and utilization for schools. DLA Piper’s analysis highlights that MOSAIC’s Statement of Compliance process can lower certification burdens for eligible models, drawing new capital and non-traditional entrants into the category. Together, these changes increase the available fleet and improve the pipeline of new pilots, benefiting the piston engine aircraft market as training expands.
Restraint Impact Analysis*
| Restraint | (~) % Impact on CAGR Forecast | Geographic Relevance | Impact Timeline |
|---|---|---|---|
| Stringent emission regulations on leaded Avgas | -1.1% | Global, with early peaks in EU, US East Coast | Medium term (2-4 years) |
| Supply chain disruptions for critical engine components | -0.8% | Global, with concentrated effects in North America, Europe | Short term (≤ 2 years) |
| High insurance premiums for general aviation operators | -0.6% | North America core, spill-over to Europe | Short term (≤ 2 years) |
| Competition from advanced eVTOL and turboprop options | -0.4% | Global | Long term (≥ 4 years) |
| Source: Mordor Intelligence | |||
Stringent Emission Regulations on Leaded Avgas
Regulatory momentum against aviation lead emissions is reshaping fuel planning and upgrade paths for the in-service piston fleet. The EPA’s endangerment finding sets the stage for new emission standards, which will ultimately require FAA action to enable unleaded replacements for 100LL and manage certification pathways for affected engines and airframes. Federal Register records outline the scale of lead emissions from piston operations and their public health implications, prompting state actions, including New York’s law restricting the sale of leaded avgas after January 2031, with limited exemptions. The FAA’s EAGLE initiative coordinates the industry shift with candidate unleaded fuels from multiple suppliers, balancing safety, engine durability, and distribution considerations as the 2030 horizon approaches.[4]National Air Transportation Association, “July 2025 EAGLE Update,” NATA, nata.aero As of April 2025, no single unleaded formula had universal FAA authorization for nearly all affected engines, which means owners and MROs must plan for compatibility, detonation margins, and potential modifications as solutions progress. Diesel piston models that use Jet A can avoid lead restrictions, but most of the current fleet remains avgas-dependent and faces transition uncertainty, which weighs on near-term investment decisions in the piston engine aircraft market.
High Insurance Premiums for General Aviation Operators
Insurance costs rose on the back of higher claim severity and broader risk headwinds, narrowing margins for training providers and charter operators. Operators also face higher repair costs tied to advanced materials and the scarcity of skilled mechanics, which lengthen downtimes and raise the cost of minor incidents. AOPA guidance indicates that pilots with strong currency, recurrent training, and modern avionics can still secure better terms, yet baseline premiums remain elevated for many piston operators. In the piston engine aircraft market, these conditions can slow fleet expansion among private owners and some schools, especially where training margins are thin, and financing is sensitive to total ownership costs. Over time, broader adoption of safety technologies such as autoland and connected diagnostics can improve risk profiles and reduce premiums. Still, the benefits will phase in as new fleets enter service.
*Our forecasts treat driver/restraint impacts as directional, not additive. The impact forecasts reflect baseline growth, mix effects, and variable interactions.
Segment Analysis
By Engine Type: Single-Engine Platforms Fuel Training Expansion
Twin-engine variants captured 51.15% of the piston engine aircraft market share in 2025, while single-engine platforms are projected to post a 6.83% CAGR through 2031 as schools and private owners prioritize acquisition costs and operating simplicity. The piston engine aircraft market remains anchored by single-engine trainers that serve as the entry point for ab initio, instrument, and commercial ratings under evolving standards. Cirrus has maintained leadership among high-performance singles by enhancing safety features, including emergency autoland systems to reduce pilot workload. Textron has improved the Cessna 172 Skyhawk by introducing dual electronic ignition, reducing moving parts, and enabling extended maintenance intervals. Diesel-powered twins and singles are gaining traction in regions where Jet A is more economical than avgas and where unleaded fuel transitions are advancing.
Single-engine models continue to dominate the market as MOSAIC expands sport-pilot privileges and schools adopt technically advanced aircraft for commercial ratings. Modern singles, equipped with glass cockpits and digital engine monitoring, emulate airline-style workflows, enhancing safety and shortening learning curves. Diesel singles, such as the DA40 NG, offer extended range and reduced fuel costs in Europe and parts of Asia. In contrast, gasoline singles remain popular in North America due to the availability of avgas. On the twin-engine side, models like the Seminole DX provide significant fuel savings and improved performance metrics, supporting growth across both single and twin-engine categories as schools transition students through various training phases.


By End-User Service: Civil/Commercial Operators Chase Public-Funded Training Contracts
Government and military end-users accounted for 74.55% of the piston engine aircraft market share in 2025, supported by public training contracts, search-and-rescue missions, and surveillance missions. Public funding underwrites high-utilization fleets such as the US Civil Air Patrol, which ordered 15 new Cessna piston aircraft in December 2025 to support missions that rely on piston economics and visual reconnaissance capabilities. China’s Civil Aviation Flight University continues to operate one of the world’s largest training fleets, which helps sustain volumes for popular piston trainers used across primary, instrument, and multi-engine phases. Large-scale institutional orders, such as the University of North Dakota’s multi-year Piper deal, improve OEM production visibility while streamlining student progression through standardized fleets. Diesel-powered configurations offer range and fuel-cost advantages for public academies in markets where Jet A supply chains are more mature than avgas networks.
Civil and commercial operators, including flight training organizations, air-taxi firms, and aerial-work companies, are projected to grow at a 6.74% CAGR through 2031, with MOSAIC reducing entry barriers for pilots and enabling more flexible training and aerial work operations. Fleet strategies emphasize standardization on a small set of single- and twin-engine models to simplify maintenance and training while maintaining high dispatch rates in the piston engine aircraft market. Cross-border training ecosystems are scaling, as shown by Intercontinental Aviation Enterprise’s multi-country configuration strategy for DA40 NG and DA42-VI deliveries scheduled in 2026. Air India’s structured orders for Archer DX trainers reflect airline-linked pipelines that utilize domestic and international training partners to meet throughput targets. As regulatory harmonization improves and BasicMed or sport-pilot privileges are extended to more pilots under specific conditions, commercial training and select aerial work roles expand the usage base for piston fleets.
By Application: Air Taxi and Charter Services Outpace Legacy Roles
Special-mission platforms accounted for 42.05% of the piston engine aircraft market in 2025, anchored by observation, patrol, agricultural spraying, and emergency response roles that favor low-altitude, low-speed profiles. Public agencies leverage piston aircraft for inland search-and-rescue, wildlife surveys, and disaster-relief assessments where fuel economy and visual acuity are essential. China’s plan to extend air emergency rescue services to more provinces creates steady requirements for utility piston fleets as airports and training capacity expand. This segment also benefits from diesel engines that extend endurance on Jet A and simplify operations through FADEC control in the piston engine aircraft market. As avionics maturity increases, special-mission aircraft benefit from integrated autopilots, synthetic vision, and engine monitoring that improve safety and reduce pilot workload during extended sorties.
Air-taxi and charter services are set to grow at an 8.88% CAGR as operators address thin regional connectivity in parts of Southeast Asia and Latin America, as well as in remote geographies that cannot support larger aircraft. MOSAIC’s framework may expand aerial work opportunities for light-sport aircraft and boost pilot inflows, thereby indirectly supporting charter and shuttle segments that depend on a steady pipeline of qualified pilots. Regional training partners in the Middle East and Europe are expanding multi-location ecosystems, aligning instructor currency and parts inventories to support higher utilization in piston fleets. For longer-range or premium charter needs, turboprops still dominate. Still, single- and twin-piston aircraft fill a cost-effective niche for short-stage missions with basic field requirements in the piston engine aircraft market. Over the forecast window, charter growth, resilient pilot training, and persistent special-mission demand support the application mix across the piston engine aircraft market.
Geography Analysis
North America retained 39.1% of the 2025 value, accounting for 72.6% of global piston deliveries, a position supported by the region's robust general aviation infrastructure and a large installed base. FAA forecasts continue to track activity by fleet category, and US flight schools benefit from MOSAIC's broader operational envelope, which can bring more pilots into the funnel while meeting manageable medical and training requirements.[5]Federal Aviation Administration, “FAA Aerospace Forecast Fiscal Years 2025–2045,” FAA, faa.gov The Civil Air Patrol's 2025 fleet expansion illustrates the role of public funding in sustaining piston missions for search-and-rescue and community service initiatives. Diesel adoption remains incremental in North America due to the availability of avgas and legacy support. Yet, Textron's move to dual electronic ignition demonstrates how incremental technology helps improve uptime and total cost of ownership for training fleets. The piston engine aircraft market in North America remains anchored by a balanced mix of private owners, flight schools, and public agencies that collectively underpin steady demand through 2031.
Europe's operators continue to embrace Jet A diesel pistons, and Diamond's Austro Engine milestones underscore widespread adoption tied to lower fuel costs and environmental policies that support unleaded and lower-emission operations. EASA's environmental roadmap influences design standards and certification focus areas that favor quieter, lower-emissions propulsion while retaining the practical performance needed for training and utility roles. European flying clubs, ATOs, and DTOs offer a mature pipeline for private and commercial training, with events such as AERO Friedrichshafen showcasing continuous improvements in piston avionics, safety systems, and support packages for the piston engine aircraft market. Garmin's widespread adoption of avionics across popular piston models reinforces standardization on digital flight decks that align with airline-style training in Europe. As European operators implement noise-reduction and fuel-transition measures, diesel pistons and improved ignition systems help manage lifecycle costs and ensure compliance in a region with tighter environmental norms.
Asia-Pacific is projected to grow at a 6.98% CAGR, underpinned by China's infrastructure buildout, growing training demand, and supportive policies in markets such as India that streamline licensing and non-scheduled operations. China authorized 239 new general-aviation airports in 2024, and plans to register more general aviation aircraft and expand emergency rescue coverage by 2025, demonstrating broad support for piston trainers and utility fleets. The Civil Aviation Flight University's 400-aircraft fleet and 500,000 annual flight hours are emblematic of sustained investment in training capacity that anchors demand for popular piston types. ITA projects a long-term expansion of China's general aviation fleet, with a significant portion dedicated to training, supporting OEM production planning, and expanding the aftermarket network in the region. Southeast Asian and Australasian markets continue to deploy piston aircraft for regional shuttles, aerial work, and training in remote environments that require robust, economical platforms, thereby strengthening the piston engine aircraft market's regional footprint.

Competitive Landscape
Market activity highlights steady product innovation and strategic fleet deals tailored to training and owner-operator needs. Cirrus introduced the 2026 SR Series G7+ with standard Safe Return emergency autoland and a connected ecosystem for updates and enhanced runway awareness, reinforcing its leadership in the piston engine aircraft market. Textron’s 2025 launch of dual electronic ignition on new Skyhawks improves reliability and maintenance efficiency, benefiting training organizations with high dispatch requirements. Piper secured a significant UND order valued at nearly USD 155 million and transitioned to diesel in multi-engine training with the Seminole DX, resulting in fuel savings and performance improvements.
Diamond reintroduced the DA20i Katana in Europe and delivered it to CAE, supporting ab initio and multi-engine training with the DA40 NG and DA42-VI, both of which are certified to Jet A and equipped with FADEC controls. Cross-border training platforms are expanding with multi-country registrations to optimize fleet use and student placements. BAE Systems’ expertise in FADEC technology highlights the growing role of digital engine controls in enhancing reliability, enabling predictive diagnostics, and integrating with modern avionics across piston and turbine categories.
Market trends emphasize safety, digital integration, and fuel flexibility in the piston engine aircraft sector. Cirrus’s standardization of emergency autoland aligns with a broader focus on risk mitigation, potentially aiding insurance negotiations. Piper’s diesel twin strategy targets fuel resilience and scalability in international training, while Textron’s ignition upgrade simplifies operations for large training fleets. OEMs are also enhancing customer support and parts availability, crucial for standardized fleets requiring quick turnarounds and predictable maintenance. These strategies collectively support a competitive market focused on uptime, safety, and cost control through the forecast period.
Piston Engine Aircraft Industry Leaders
Textron Inc.
Piper Aircraft, Inc.
Diamond Aircraft Industries GmbH
Cirrus Design Corporation
Costruzioni Aeronautiche Tecnam S.p.A.
- *Disclaimer: Major Players sorted in no particular order

Recent Industry Developments
- January 2026: Cirrus Aircraft unveiled the 2026 SR Series G7+ models with Safe Return emergency autoland standard, automatic database updates through Cirrus IQ PRO Advanced, runway occupancy awareness, and smart pitot heat, plus expanded connectivity for automatic weather updates along the route.
- October 2025: Diamond Aircraft reintroduced the DA20i Katana to European production at its Austrian facility, with AELO Swiss Academy placing an initial fleet order and deliveries scheduled for 2027.
- July 2025: Textron Aviation introduced dual electronic ignition systems as standard on all new Cessna Skyhawk aircraft, replacing dual magnetos to improve maintenance intervals, fuel efficiency, and dispatch reliability.


Global Piston Engine Aircraft Market Report Scope
Piston engine aircraft, also known as reciprocating-engine aircraft, use internal combustion engines to propel themselves. Predominantly, these aircraft serve general aviation, catering to training, business, and light utility roles. Typically, they have 1–6 seats, operate at altitudes below 15,000 feet, and often use horizontally opposed engines for efficient air cooling.
The piston engine market is segmented by engine type, end-user service, application, and geography. By engine type, the market is segmented into single-engine and twin-engine. By end-user service, the market is classified into civil/commercial and government and military. By application, the market is segmented into sports, pilot training, aerial surveying, agriculture and forestry, air taxi and charter, and special mission. The report also covers market sizes and forecasts for the piston engine aircraft market in major countries across different regions. For each segment, the market size is provided in terms of value (USD).
| Single Engine |
| Twin Engine |
| Civil/Commercial |
| Government and Military |
| Sports |
| Pilot Training |
| Aerial Surveying |
| Agriculture and Forestry |
| Air Taxi and Charter |
| Special Mission |
| North America | United States | |
| Canada | ||
| Mexico | ||
| Europe | United Kingdom | |
| France | ||
| Germany | ||
| Italy | ||
| Spain | ||
| Russia | ||
| Rest of Europe | ||
| Asia-Pacific | China | |
| India | ||
| Japan | ||
| South Korea | ||
| Indonesia | ||
| Australia | ||
| Rest of Asia-Pacific | ||
| South America | Brazil | |
| Rest of South America | ||
| Middle East and Africa | Middle East | Saudi Arabia |
| United Arab Emirates | ||
| Qatar | ||
| Rest of Middle East | ||
| Africa | South Africa | |
| Nigeria | ||
| Rest of Africa | ||
| By Engine Type | Single Engine | ||
| Twin Engine | |||
| By End-User Service | Civil/Commercial | ||
| Government and Military | |||
| By Application | Sports | ||
| Pilot Training | |||
| Aerial Surveying | |||
| Agriculture and Forestry | |||
| Air Taxi and Charter | |||
| Special Mission | |||
| By Geography | North America | United States | |
| Canada | |||
| Mexico | |||
| Europe | United Kingdom | ||
| France | |||
| Germany | |||
| Italy | |||
| Spain | |||
| Russia | |||
| Rest of Europe | |||
| Asia-Pacific | China | ||
| India | |||
| Japan | |||
| South Korea | |||
| Indonesia | |||
| Australia | |||
| Rest of Asia-Pacific | |||
| South America | Brazil | ||
| Rest of South America | |||
| Middle East and Africa | Middle East | Saudi Arabia | |
| United Arab Emirates | |||
| Qatar | |||
| Rest of Middle East | |||
| Africa | South Africa | ||
| Nigeria | |||
| Rest of Africa | |||


Market Definition
- Aircraft Type - Piston fixed-wing aircraft segment is included under the General Aviation aircraft type.
- Sub-Aircraft Type - All piston fixed-wing aircraft that are used by pilot training institutes, agricultural purposes, sporting activities, and other applications are included under general aviation category of this study.
- Body Type -
| Keyword | Definition |
|---|---|
| IATA | IATA stands for the International Air Transport Association, a trade organization composed of airlines around the world that has an influence over the commercial aspects of flight. |
| ICAO | ICAO stands for International Civil Aviation Organization, a specialized agency of the United Nations that supports aviation and navigation around the globe. |
| Air Operator Certificate (AOC) | A certificate granted by a National Aviation Authority permitting the conduct of commercial flying activities. |
| Certificate Of Airworthiness (CoA) | A Certificate Of Airworthiness (CoA) is issued for an aircraft by the civil aviation authority in the state in which the aircraft is registered. |
| Gross Domestic Product (GDP) | Gross domestic product (GDP) is a monetary measure of the market value of all the final goods and services produced in a specific time period by countries. |
| RPK (Revenue Passenger Kilometres) | The RPK of an airline is the sum of the products obtained by multiplying the number of revenue passengers carried on each flight stage by the stage distance - it is the total number of kilometers traveled by all revenue passengers. |
| Load Factor | The load factor is a metric used in the airline industry that measures the percentage of available seating capacity that has been filled with passengers. |
| Original Equipment Manufacturer (OEM) | An original equipment manufacturer (OEM) traditionally is defined as a company whose goods are used as components in the products of another company, which then sells the finished item to users. |
| International Transportation Safety Association (ITSA) | International Transportation Safety Association (ITSA) is an international network of heads of independent safety investigation authorities (SIA). |
| Available Seats Kilometre (ASK) | This metric is calculated by multiplying Available Seats (AS) in one flight, defined above, multiplied by the distance flown. |
| Gross Weight | The fully-loaded weight of an aircraft, also known as “takeoff weight,” which includes the combined weight of passengers, cargo, and fuel. |
| Airworthiness | The ability of an aircraft, or other airborne equipment or system, to operate in flight and on the ground without significant hazard to aircrew, ground crew, passengers or to other third parties. |
| Airworthiness Standards | Detailed and comprehensive design and safety criteria applicable to the category of aeronautical product (aircraft, engine or propeller). |
| Fixed Base Operator (FBO) | A business or organization that operates at an airport. An FBO provides aircraft operating services like maintenance, fueling, flight training, charter services, hangaring, and parking. |
| High Net worth Individuals (HNWIs) | High Net worth Individuals (HNWIs) are individuals with over USD 1 million in liquid financial assets. |
| Ultra High Net worth Individuals (UHNWIs) | Ultra High Net worth Individuals (UHNWIs) are individuals with over USD 30 million in liquid financial assets. |
| Federal Aviation Administration (FAA) | The division of the Department of Transportation is concerned with aviation. It operates Air Traffic Control and regulates everything from aircraft manufacturing to pilot training to airport operations in the United States. |
| EASA (European Aviation Safety Agency) | The European Aviation Safety Agency is a European Union agency established in 2002 with the task of overseeing civil aviation safety and regulation. |
| Airborne Warning and Control System (AW&C) aircraft | Airborne Warning and Control System (AEW&C) aircraft is equipped with a powerful radar and on-board command and control center to direct the armed forces. |
| The North Atlantic Treaty Organization (NATO) | The North Atlantic Treaty Organization (NATO), also called the North Atlantic Alliance, is an intergovernmental military alliance between 30 member states – 28 European and two North American. |
| Joint Strike Fighter (JSF) | Joint Strike Fighter (JSF) is a development and acquisition program intended to replace a wide range of existing fighter, strike, and ground attack aircraft for the United States, the United Kingdom, Italy, Canada, Australia, the Netherlands, Denmark, Norway, and formerly Turkey. |
| Light Combat Aircraft (LCA) | A light combat aircraft (LCA) is a light, multirole jet/turboprop military aircraft, commonly derived from advanced trainer designs, designed for engaging in light combat. |
| Stockholm International Peace Research Institute (SIPRI) | Stockholm International Peace Research Institute (SIPRI) is an international institute that provides data, analysis, and recommendations for armed conflict, military expenditure, and arms trade as well as disarmament and arms control. |
| Maritime Patrol Aircraft (MPA) | A maritime patrol aircraft (MPA), also known as maritime reconnaissance aircraft is a fixed-wing aircraft designed to operate for long durations over water in maritime patrol roles, in particular, anti-submarine warfare (ASW), anti-ship warfare (AShW), and search and rescue (SAR). |
| Mach Number | The Mach number is defined as the ratio of true airspeed to the speed of sound at the altitude of a given aircraft. |
| Stealth Aircraft | Stealth is a Common term applied to low observable (LO) technology and doctrine, that makes an aircraft near invisible to radar, infrared or visual detection. |


Research Methodology
Mordor Intelligence follows a four-step methodology in all our reports.
- Step-1: Identify Key Variables: In order to build a robust forecasting methodology, the variables and factors identified in Step-1 are tested against available historical market numbers. Through an iterative process, the variables required for market forecast are set and the model is built on the basis of these variables.
- Step-2: Build a Market Model: Market-size estimations for the historical and forecast years have been provided in revenue and volume terms. For sales conversion to volume, the average selling price (ASP) is kept constant throughout the forecast period for each country, and inflation is not a part of the pricing.
- Step-3: Validate and Finalize: In this important step, all market numbers, variables and analyst calls are validated through an extensive network of primary research experts from the market studied. The respondents are selected across levels and functions to generate a holistic picture of the market studied.
- Step-4: Research Outputs: Syndicated Reports, Custom Consulting Assignments, Databases & Subscription Platforms


