Photocatalyst Market Size and Share
Market Overview
| Study Period | 2019 - 2030 |
|---|---|
| Market Size (2025) | USD 2.96 Billion |
| Market Size (2030) | USD 4.70 Billion |
| Growth Rate (2025 - 2030) | 9.68% CAGR |
| Fastest Growing Market | North America |
| Largest Market | Asia Pacific |
| Market Concentration | Medium |
Major Players
*Disclaimer: Major Players sorted in no particular order Image © Mordor Intelligence. Reuse requires attribution under CC BY 4.0. |
|

Photocatalyst Market Analysis by Mordor Intelligence
The Photocatalyst Market size is estimated at USD 2.96 billion in 2025, and is expected to reach USD 4.70 billion by 2030, at a CAGR of 9.68% during the forecast period (2025-2030). Strong regulatory pressure on air and water pollutants, wider acceptance of self-cleaning construction materials and breakthroughs that move titanium-dioxide (TiO₂) systems into the visible-light spectrum headline the growth narrative. Market demand is reinforced by construction firms seeking lifetime maintenance savings, utilities tackling emerging water contaminants and consumer-electronics producers adding antimicrobial coatings. Accelerated scale-up is also visible as modular reactors and 3-D printed composites cut capital costs, while regional supply chains adapt to European antidumping tariffs on Chinese TiO₂ imports. Finally, research momentum in plasmonic nanocomposites and MOF-derived catalysts signals a broadening application base that now reaches agrivoltaic glass and renewable-hydrogen production.
Key Report Takeaways
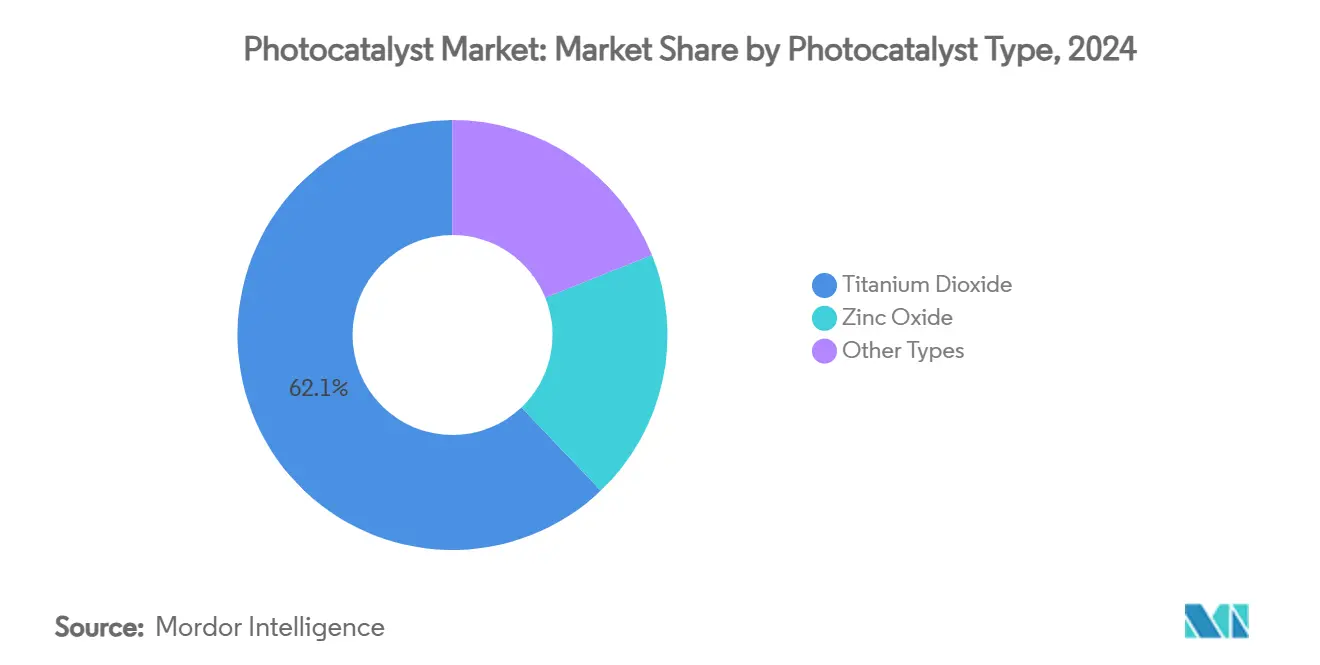
- By photocatalyst type, TiO₂ captured 62.12% of photocatalysts market share in 2024, whereas ZnO is projected to advance at a 9.91% CAGR through 2030.
- By application, self-cleaning held 60.45% of the photocatalysts market size in 2024 and is expanding at a 10.85% CAGR between 2025-2030.
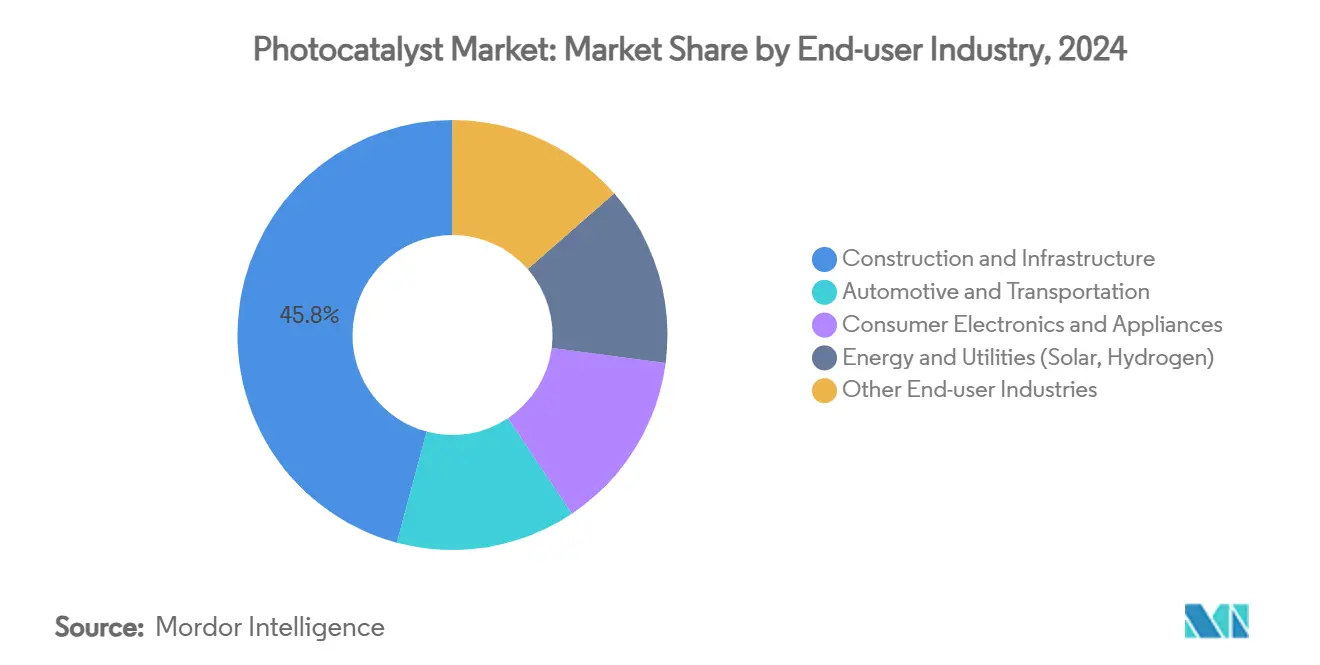
- By end-use industry, construction and infrastructure accounted for 45.83% of revenue in 2024 and is growing at a 10.18% CAGR to 2030.
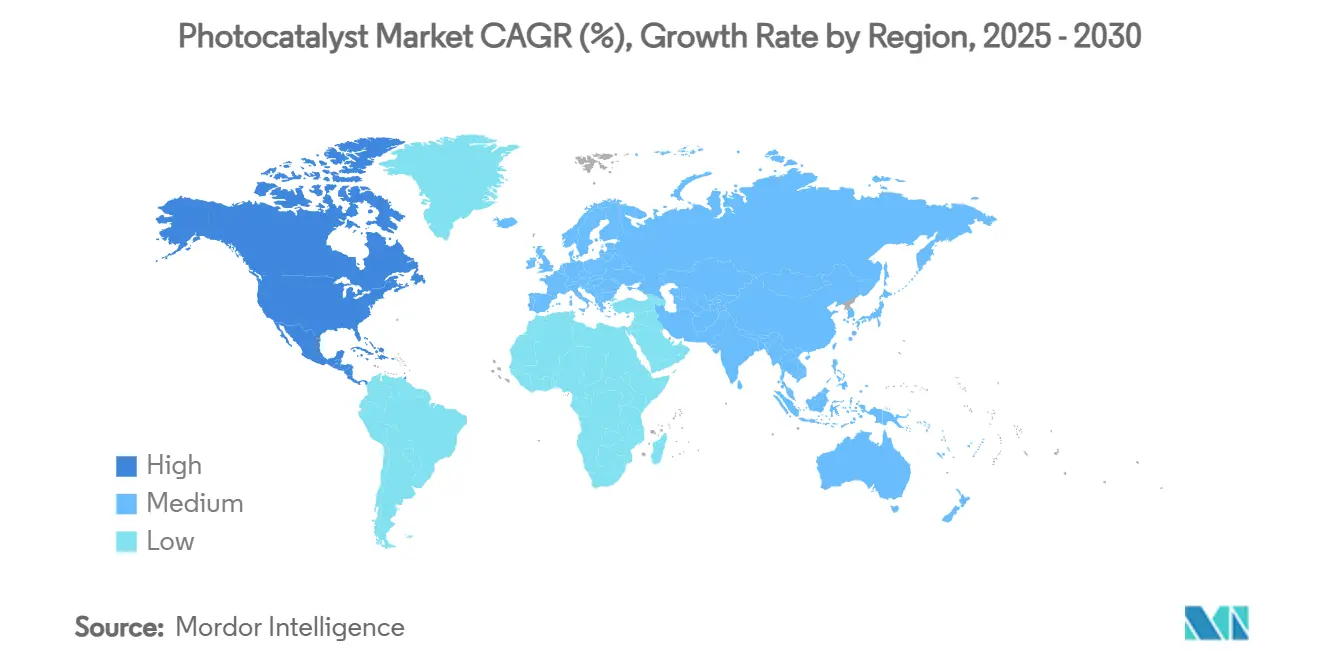
- By geography, Asia-Pacific led with 66.89% revenue share in 2024, while North America registers the fastest 10.04% CAGR over the forecast period.
Global Photocatalyst Market Trends and Insights
Driver Impact Analysis
| Driver | (~) % Impact on CAGR Forecast | Geographic Relevance | Impact Timeline |
|---|---|---|---|
| Surging demand for TiO₂ photocatalysts in self-cleaning construction materials | +2.1% | Global, focus in Asia-Pacific & Europe | Medium term (2-4 years) |
| Rising adoption in municipal water & wastewater treatment plants | +1.8% | North America & EU, spreading to Asia-Pacific | Long term (≥ 4 years) |
| Stricter indoor-air VOC regulations boosting photocatalytic air purifiers | +1.6% | North America & EU | Short term (≤ 2 years) |
| Visible-light plasmonic nanocomposites enabling indoor consumer-electronics coatings | +1.4% | Global, led by Japan & South Korea | Medium term (2-4 years) |
| Photocatalytic coatings for agrivoltaic glass reducing bio-fouling | +0.9% | Global, early uptake in Europe & Australia | Long term (≥ 4 years) |
| Source: Mordor Intelligence | |||
Surging Demand for TiO₂ Photocatalysts in Self-Cleaning Construction Materials
Building owners now specify nano-textured TiO₂ coatings that cut façade washing expenses by as much as 40% across a building’s life. Recent formulations achieve 95% optical transmittance, meeting the aesthetic needs of high-profile glass architecture. Photocatalytic surfaces also remove 63% of airborne toluene under daylight, easing urban air-quality concerns. High-rise projects adopt these coatings because rope-access cleaning is expensive and disruptive, while novel Bi@Bi₄Ti₃O₁₂/TiO₂ films extend the benefit to visible light, broadening design freedom for shaded elevations[1]Lv et al., “Bi@Bi₄Ti₃O₁₂/TiO₂ Photocatalyst Films Under Visible Light,” rsc.org.
Rising Adoption in Municipal Water & Wastewater Treatment Plants
Utilities turn to solar-driven photocatalytic tertiary treatment to tackle pesticides such as 2,4-D, MCPP and dicamba, achieving up to 99.8% degradation without external power[2]Heydari et al., “Passive Solar Photocatalytic Removal of Herbicides,” acs.org. Photocatalytic membrane reactors gain traction for their precise effluent quality control and resilience to contaminant peaks. Additive-manufactured composite structures push costs down by customizing surface area and light-distribution geometry, making remote installations viable where grid electricity is scarce.
Stricter Indoor-Air VOC Regulations Boosting Photocatalytic Air Purifiers
New EPA rules on benzene and hydrocarbon emissions spark demand for continuous, filter-free air cleaners in offices, schools and vehicles. Polypropylene membranes embedded with TiO₂ nanoparticles degrade VOCs efficiently under LED lighting, and automotive prototypes already lower evaporative-fuel vapor by 60% in diurnal cycles. Designs that mimic the troposphere’s OH-radical chemistry enable effective treatment even at the very low contaminant concentrations typical of conditioned interiors.
Visible-Light Plasmonic Nanocomposites Enabling Indoor Consumer-Electronics Coatings
Silver-enhanced Ag/AgCl-glass maintains high transparency yet delivers strong photocatalytic activity under everyday indoor lighting, lending self-cleaning and antibacterial properties to touchscreens. Subnanometric MoOₓ clusters on TiO₂ nanosheets further raise selectivity, avoiding unwanted by-products and reaching 95% reaction efficiency. Manufacturers appreciate the dual hygiene and aesthetic value, while 3-D flower-like Ag/Bi₅O₇I coatings show 99.63% bacterial kill alongside 95% pollutant removal in tablet-lens tests.
Restraints Impact Analysis
| Restraint | (~) % Impact on CAGR Forecast | Geographic Relevance | Impact Timeline |
|---|---|---|---|
| High capital expenditure for industrial-scale photocatalytic reactors | -1.9% | Global, acute in emerging markets | Medium term (2-4 years) |
| Catalyst deactivation from surface fouling & electron-hole recombination | -1.5% | Global, worst in polluted settings | Long term (≥ 4 years) |
| Regulatory uncertainty on nanoparticle release & disposal | -0.8% | North America & EU | Short term (≤ 2 years) |
| Source: Mordor Intelligence | |||
High Capital Expenditure for Industrial-Scale Photocatalytic Reactors
Economic modeling shows treatment costs spike when reaction rate constants fall below 0.1 min⁻¹, pushing developers to cut catalyst price rather than over-engineer reactors. UV-lamp arrays, precision flow control and fouling mitigation further inflate capex, often pushing projects 3-5 times above initial budgets. Modular units and hybrid photo-bioreactors emerge as workable answers, spreading investment over time and keeping payback within acceptable 5-15 year windows where energy prices and water-quality mandates align.
Catalyst Deactivation from Surface Fouling & Electron-Hole Recombination
Field deployments reveal that multicomponent pollutant streams quickly passivate catalytic surfaces, while high recombination rates sap quantum efficiency. Regeneration by thermal or chemical means consumes both energy and labor, eroding the cost advantage of “sunlight-only” treatment. Research now tailors co-catalysts and surface modifiers to extend lifetime, but added material complexity raises procurement cost and validation cycles, particularly in automotive fuel-vapor control where light alkanes accelerate deactivation.
Segment Analysis
By Photocatalyst Type: TiO₂ Dominance Faces ZnO Challenge
In 2024, TiO₂ held 62.12% of photocatalyst market share owing to mature production scale and decades of formulation know-how. Concurrent advances such as Ti³⁺ self-doping via triethanolamine routes widen its visible-light window, reinforcing performance leadership even as antidumping duties change supply logistics. ZnO meanwhile posts the fastest 9.91% CAGR because its surface reaction pathway favors hydrogen generation, an area receiving generous green-fuel funding across Asia-Pacific and North America.
Momentum is nonetheless shifting toward multi-component systems. Bismuth-oxides, graphene composites and MOF-derived structures demonstrate quantum yields above 10%, targeting CO₂ conversion and specialty chemical synthesis. Market selection is expected to tilt on application specificity more than on universal metrics, suggesting TiO₂ might relinquish some high-margin niches even while retaining overall volume leadership in the photocatalyst market.
Note: Segment shares of all individual segments available upon report purchase
By Application: Self-Cleaning Leads Diversification
Self-cleaning captured 60.45% of the photocatalyst market size in 2024 and continues to pace expansion at 10.85% CAGR, leveraging its ubiquity across construction façades, automotive clear-coats and phone glass. Architectural cladding gains particular traction from life-cycle maintenance savings and enhanced urban aesthetic. Air purification ranks second as offices retrofit HVAC units to comply with stricter VOC thresholds, while water treatment grows as a tertiary barrier against trace organics that evade biological steps.
Anti-fogging lenses and mirrors exploit the same hydrophilic surface property that underpins self-cleaning, giving OEMs an easy bolt-on feature set. Over the horizon, CO₂ reduction, methane oxidation and renewable hydrogen collectively seed an emerging application cluster where higher value per kilogram of catalyst could offset lower volumes, further diversifying revenue streams for the photocatalyst market.
By End-Use Industry: Construction Drives Adoption
Construction and infrastructure commanded 45.83% demand in 2024, supported by building codes that incentivise sustainable materials and façade longevity. Developers tout 40% cleaning cost cuts in tender documents, and city planners welcome the 63% toluene removal capability that improves street-level air quality. Automotive and transportation follow as OEMs explore self-healing clear-coats and vapor-reducing canisters, yet deactivation under hydrocarbon load remains a hurdle.
Consumer electronics, although a smaller base, show outsized potential as visible-light plasmonic films enable in-situ antimicrobial and smudge-free screens. Energy and utilities weave photocatalysts into solar panel glass and pilot hydrogen generators, broadening the industrial canvas. Healthcare facilities and agritech greenhouses round out adoption as specialty users that prize continuous sterilisation and light-management efficiency.
Note: Segment shares of all individual segments available upon report purchase
Geography Analysis
Asia-Pacific maintained 66.89% share in 2024 as Japan’s research leadership and China’s low-cost TiO₂ output anchor a vertically integrated cluster from laboratory to factory floor. Post-Fukushima R&D grants propel visible-light innovation, and China’s scale—2.65 million tons TiO₂ via the sulphate route in 2017—supports price competitiveness even amid tightening environmental rules. Rapid urbanisation and seasonal smog further drive municipal demand for photocatalytic air-scrubbed façades and subway stations.
North America expands fastest at a 10.04% CAGR thanks to EPA VOC limits that accelerate HVAC retrofits and automotive fuel-vapor controls. Municipal utilities implement passive solar tertiary treatment to meet trace-contaminant discharge permits, while federal clean-hydrogen credits stimulate ZnO-based water-splitting demonstrations. Canadian green building codes and Mexico’s expanding industrial base add regional volume beyond the United States.
Europe benefits from the Green Deal’s circular-economy clauses, channelling subsidies into sustainable construction and agrivoltaic pilots that pair photocatalytic glazing with transparent PV. Antidumping tariffs on Chinese TiO₂ galvanise local pigment makers to diversify into higher-margin catalyst grades, thereby shortening supply chains. South America and Middle East & Africa represent early-stage arenas where point-of-use water treatment and solar-panel coatings can leapfrog conventional solutions, especially in remote agriculture and mining camps.
Competitive Landscape
Competitive Landscape
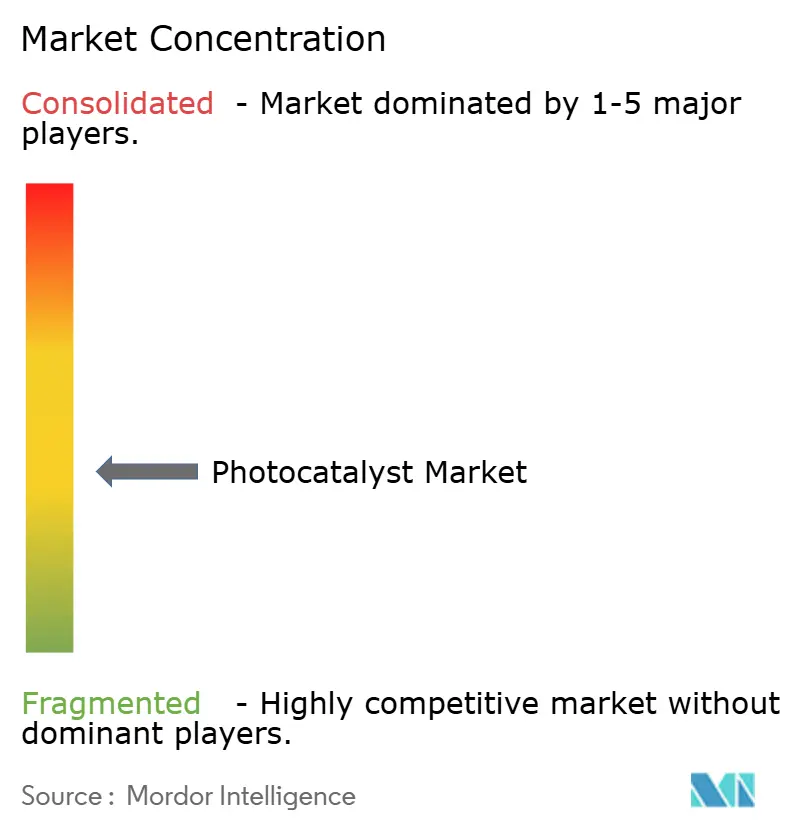
The sector is moderately fragmented: global pigment leaders such as BASF, Kronos Worldwide and Chemours leverage scale, logistics and customer service to defend TiO₂ franchises, while mid-cap specialists pursue visible-light or MOF-driven breakthroughs. Tronox’s recent Netherlands plant idling underscores price pressure from Chinese exports, yet Chemours offset margin squeeze through premium pigment and catalyst grades tied to construction megaprojects.
Strategic moves highlight the industry’s pivot toward sustainability. Resonac’s tie-up with Neste and Marubeni channels bio-based feedstocks into photocatalyst precursors, and BASF’s 2024 catalyst research centre focuses on decarbonising chemical processes via advanced photocatalysis. Start-ups harness 3-D printing to craft bespoke reactor internals, and AI-guided material discovery platforms cut lab cycles, accelerating time-to-pilot for combinatorial nanocomposites that outperform legacy TiO₂. White-space opportunity clusters include indoor electronics coatings, agrivoltaic glass and decentralized hydrogen generators, setting the stage for cross-industry alliances that blend materials, device and service expertise within the photocatalysts market.
Photocatalyst Industry Leaders
-
KRONOS Worldwide Inc
-
Tronox Holdings Plc
-
The Chemours Company
-
LB Group
-
ISHIHARA SANGYO KAISHA, LTD.
- *Disclaimer: Major Players sorted in no particular order
Recent Industry Developments
- June 2025: Researchers at the Chinese Academy of Sciences unveiled TiO₂ catalysts doped with subnanometric MoOₓ clusters achieving 95% selectivity in methane oxidation, curbing CO₂ by-products for natural-gas processing.
- December 2024: BASF inaugurated a catalyst research centre dedicated to sustainable chemistries, with photocatalytic water-remediation and solar-fuel prototypes among its first pilot lines.
Global Photocatalyst Market Report Scope
A photocatalyst is a material that undergoes photosensitization, wherein a photochemical modification occurs as a result of the absorption of radiation from solar (UV) as well as other visible light sources. The photocatalyst market is segmented by type, application, and geography. Based on type, the market is segmented by titanium dioxide, zinc oxide, and other types. Based on application, the market is segmented into self-cleaning, air purification, water treatment, anti-fogging, and other applications. The report also covers the market size and forecasts for the market in 15 countries across major regions. For each segment, the market sizing and forecasts have been done on the basis of value (USD million).
| Titanium Dioxide |
| Zinc Oxide |
| Other Types |
| Self-Cleaning |
| Air Purification |
| Water Treatment |
| Anti-Fogging |
| Other Applications |
| Construction and Infrastructure |
| Automotive and Transportation |
| Consumer Electronics and Appliances |
| Energy and Utilities (Solar, Hydrogen) |
| Other End-user Industries (Healthcare and Hygiene, Agriculture and Aquaculture) |
| North America | United States |
| Canada | |
| Mexico | |
| South America | Brazil |
| Argentina | |
| Rest of South America | |
| Europe | Germany |
| United Kingdom | |
| France | |
| Italy | |
| Rest of Europe | |
| Asia-Pacific | China |
| India | |
| Japan | |
| South Korea | |
| Rest of Asia-Pacific | |
| Middle East and Africa | Saudi Arabia |
| South Africa | |
| Rest of Middle East and Africa |
| By Photocatalyst Type | Titanium Dioxide | |
| Zinc Oxide | ||
| Other Types | ||
| By Application | Self-Cleaning | |
| Air Purification | ||
| Water Treatment | ||
| Anti-Fogging | ||
| Other Applications | ||
| By End-Use Industry | Construction and Infrastructure | |
| Automotive and Transportation | ||
| Consumer Electronics and Appliances | ||
| Energy and Utilities (Solar, Hydrogen) | ||
| Other End-user Industries (Healthcare and Hygiene, Agriculture and Aquaculture) | ||
| By Geography | North America | United States |
| Canada | ||
| Mexico | ||
| South America | Brazil | |
| Argentina | ||
| Rest of South America | ||
| Europe | Germany | |
| United Kingdom | ||
| France | ||
| Italy | ||
| Rest of Europe | ||
| Asia-Pacific | China | |
| India | ||
| Japan | ||
| South Korea | ||
| Rest of Asia-Pacific | ||
| Middle East and Africa | Saudi Arabia | |
| South Africa | ||
| Rest of Middle East and Africa | ||
Key Questions Answered in the Report
What is the current size of the photocatalyst market?
The photocatalyst market size is valued at USD 2.96 billion in 2025, with expectations to reach USD 4.7 billion by 2030 on a 9.68% CAGR trajectory.
Which segment holds the largest photocatalysts market share?
TiO₂ remains dominant with 62.12% share in 2024, largely due to entrenched manufacturing scale and broad application acceptance.
Why are self-cleaning applications growing so quickly?
Self-cleaning coatings lower façade maintenance costs by up to 40% and simultaneously remove urban air pollutants, driving 10.85% CAGR growth through 2030.
Which region is expanding fastest in photocatalysts demand?
North America leads growth at a 10.04% CAGR because of stringent VOC regulations and rapid uptake of photocatalytic air purification systems.
What is the main hurdle to wider industrial adoption?
High capital expenditure for large-scale reactors and catalyst-deactivation challenges together shave about 3.4 percentage points off potential CAGR, underscoring the need for cost-effective, long-life designs.
Page last updated on:


