
OTT Programmatic Advertising Market Size and Share
Market Overview
| Study Period | 2020 - 2031 |
|---|---|
| Market Size (2026) | USD 87.30 Billion |
| Market Size (2031) | USD 168.90 Billion |
| Growth Rate (2026 - 2031) | 14.11 % |
| Fastest Growing Market | Asia-Pacific |
| Largest Market | North America |
| Market Concentration | Medium |
Major Players *Disclaimer: Major Players sorted in no particular order Image © Mordor Intelligence. Reuse requires attribution under CC BY 4.0. | |
OTT Programmatic Advertising Market Analysis by Mordor Intelligence
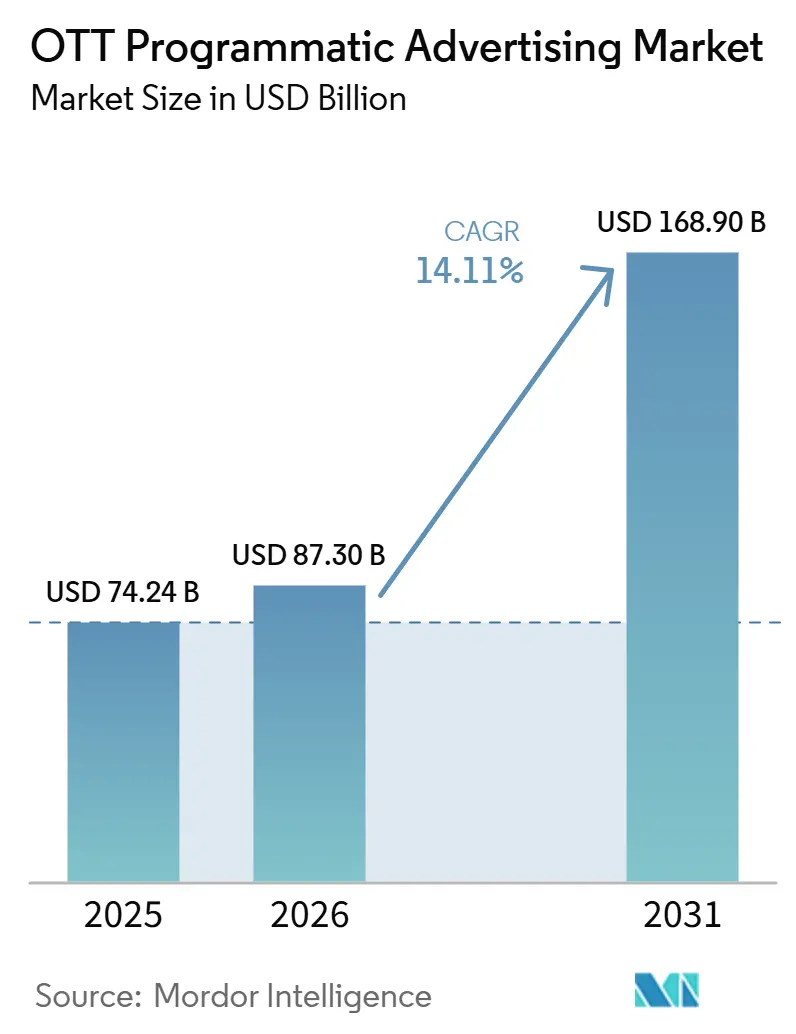
The OTT programmatic advertising market size is projected to expand from USD 74.24 billion in 2025 and USD 87.30 billion in 2026 to USD 168.90 billion by 2031, registering a CAGR of 14.11% between 2026 to 2031. Growth is being supported by a clear migration of ad budgets away from linear television and into connected TV environments where targeting, automation, and outcome tracking are stronger. The buyer base is also widening, as self-serve tools and simplified programmatic workflows are bringing smaller advertisers into the same OTT buying environment that larger brands have used for years. The supply side is expanding at the same time, as premium streaming publishers, FAST channels, and live content owners are making more inventory available through automated pipes with better fill and yield management. Competition is tightening across demand-side, supply-side, identity, measurement, and optimization layers, which is pushing providers to compete on transparency, fraud control, data access, and workflow efficiency instead of scale alone. The main opportunity remains in combining premium video reach with first-party identity, retail data, and AI-led execution, while the main pressure points remain fraud, privacy-driven signal loss, and fragmented measurement.
Key Report Takeaways
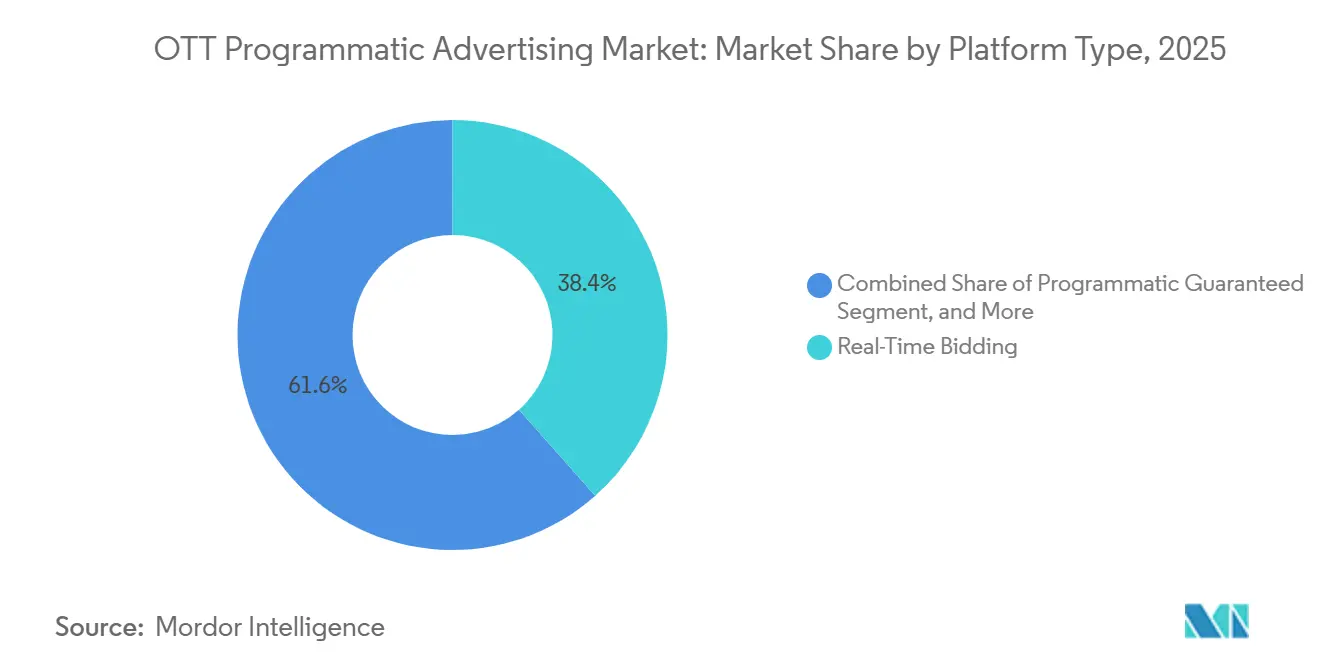
- By platform type, real-time bidding held 38.44% share of the OTT programmatic advertising market in 2025, while programmatic guaranteed is projected to expand at a 14.43% CAGR through 2031.
- By ad format, video ads accounted for 55.26% share of the OTT programmatic advertising market in 2025, while interactive ads are projected to grow at a 14.57% CAGR through 2031.
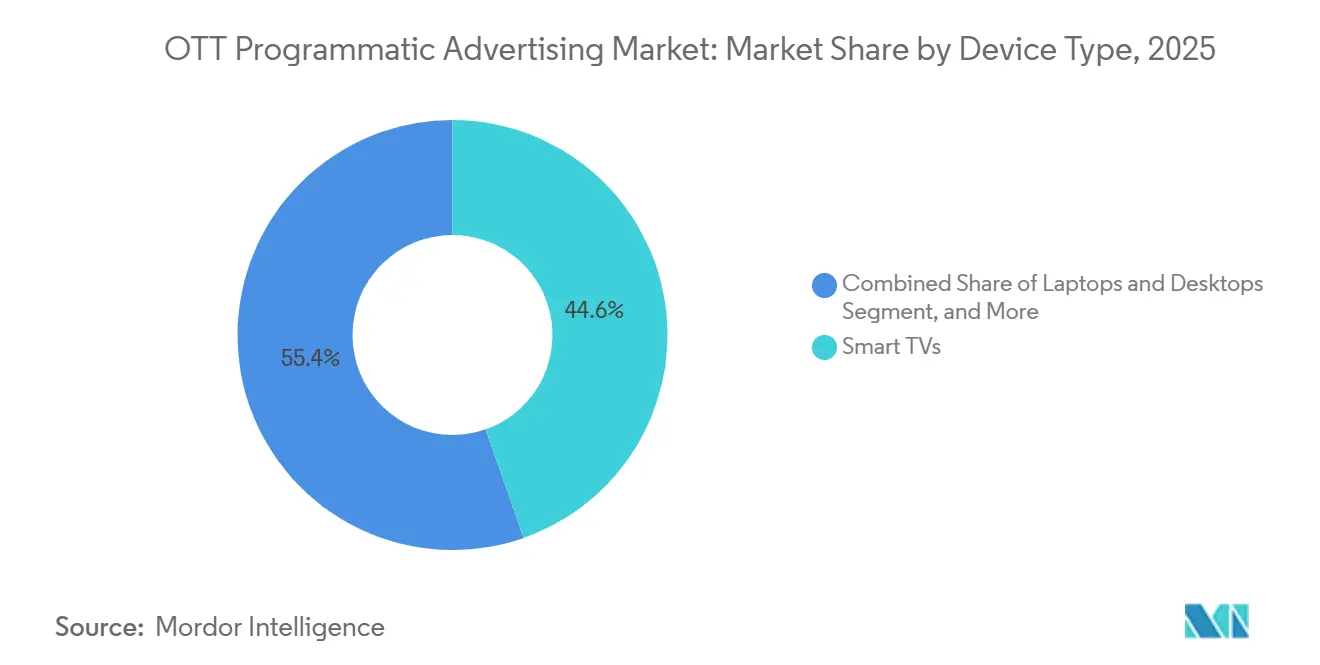
- By device type, smart TVs held 44.63% of the OTT programmatic advertising market share in 2025 and also recorded the highest projected CAGR at 14.66% through 2031.
- By end-user industry, retail and e-commerce captured 26.67% share in 2025, while financial services is projected to expand at a 14.62% CAGR through 2031.
- By geography, North America accounted for 40.56% share of the OTT programmatic advertising market size in 2025, while Asia-Pacific is projected to grow at a 14.72% CAGR through 2031.
Note: Market size and forecast figures in this report are generated using Mordor Intelligence’s proprietary estimation framework, updated with the latest available data and insights as of January 2026.
Global OTT Programmatic Advertising Market Trends and Insights
Drivers Impact Analysis*
| Driver | (~) % Impact on CAGR Forecast | Geographic Relevance | Impact Timeline |
|---|---|---|---|
| CTV-Led Programmatic Spend Expansion | +3.5% | Global, intensity concentrated in North America and Asia-Pacific | Short term (≤ 2 years) |
| Third-Party Cookie Deprecation Accelerating First-Party Targeting | +2.8% | North America and Europe, with spill-over to Asia-Pacific | Medium term (2-4 years) |
| AI-Powered Bid Optimization and Dynamic Creative Deployment | +2.2% | Global | Medium term (2-4 years) |
| Retail Media Data Infrastructure Extending Into OTT Inventory | +1.8% | North America and Asia-Pacific core | Medium term (2-4 years) |
| Curated Marketplaces Reducing Open-Exchange Waste | +1.2% | North America and Europe | Long term (≥ 4 years) |
| Server-Side Ad Insertion Improving Monetizable Ad Load | +0.9% | Global | Short term (≤ 2 years) |
| Source: Mordor Intelligence | |||
CTV-Led Programmatic Spend Expansion
Connected television has become the clearest demand engine inside the OTT programmatic advertising market, and it is changing how advertisers split television, video, and performance budgets across screens.[1]Premion and Advertiser Perceptions, “2026 CTV/OTT Advertiser Survey,” Premion, premion.com Premion and Advertiser Perceptions reported that most CTV advertisers expected to increase spending, which shows that budget growth is not limited to a narrow set of early adopters. The same study found that a significant share of CTV and OTT volume was projected to transact programmatically, while integrated hybrid buying teams controlled a large portion of CTV budgets, which points to automation becoming the operational norm rather than a specialist channel. The IAB also found that many advertisers increasing CTV spending were funding that rise from linear television budgets, which confirms that the OTT programmatic advertising market is absorbing money from legacy media pools instead of waiting for entirely new ad demand. The buyer base is broadening at the same time, as participation from small advertisers investing in CTV has increased notably, which means access barriers are falling as tools become more self-serve and easier to manage. This mix of shifting budget origin, higher programmatic throughput, and wider buyer participation gives the OTT programmatic advertising market a stronger demand profile than subscriber counts alone would suggest.[2]Interactive Advertising Bureau, “2026 IAB Digital Video Ad Spend and Strategy Report, Part One,” IAB, iab.com
Third-Party Cookie Deprecation Accelerating First-Party Targeting
Third-party cookie uncertainty stopped being a single platform issue and became a broader signal quality issue, which has pushed advertisers to favor environments with durable, permissioned identity foundations. Google’s April 2025 decision not to fully deprecate third-party cookies in Chrome settled one technical question, but Safari restrictions, Firefox cookie partitioning, and consent-led data loss still narrowed usable audience signals across much of digital advertising.[3]Consenteo, “Third-Party Cookies in 2026, What Actually Happened After Google’s Reversal,” Consenteo, consenteo.com That shift creates a comparative advantage for the OTT programmatic advertising market because streaming services usually anchor audience recognition in subscriber or app logins rather than browser cookies alone. It also increases the value of broadcaster, telecom, and platform partnerships that can sustain privacy-compliant audience matching across screens and sessions. The result is that spend does not disappear, but it moves toward publishers and inventory owners with better consented data depth, stronger identity persistence, and cleaner authentication frameworks. In practice, this is helping the OTT programmatic advertising market capture budgets that previously depended on weaker open-web targeting signals and less stable audience resolution.
AI-Powered Bid Optimization and Dynamic Creative Deployment
AI is moving from a supporting role to a decision layer inside the OTT programmatic advertising market, especially in pacing, targeting, measurement, fraud control, and creative testing. Proximic by Comscore found that most marketers considered AI-powered optimization essential when evaluating programmatic partners, which shows that AI capability is becoming a core selection factor rather than an optional feature. The same study showed that buyers were already using AI heavily for audience targeting and modeling, campaign pacing and bid automation, measurement and attribution, and fraud detection and brand safety. The IAB reported that digital video buyers were either already in market or on a near-term path to adopting agentic AI, with especially strong usage among smaller and mid-sized spenders that need efficiency without large internal analytics teams. Comscore also showed a clear protection gap, as campaigns using pre-bid invalid traffic avoidance kept fraud violation rates low, while unprotected campaigns recorded higher exposure, which turns AI from a productivity tool into a direct budget protection tool. As these systems handle more optimization work in real time, the OTT programmatic advertising market becomes more scalable for smaller agencies, lean internal teams, and publishers that previously lacked heavy manual support capacity.
Retail Media Data Infrastructure Extending Into OTT Inventory
Retail media infrastructure is becoming a demand accelerator for the OTT programmatic advertising market because it connects purchase intent, audience targeting, and outcome measurement inside the same workflow. Nielsen reported that U.S. retail media spending was growing 20% in 2025, which was much faster than the wider advertising market and gave retailers more room to extend data-led campaigns beyond their owned properties. Off-site formats, including programmatic display, social, and CTV, were growing at nearly 3 times the rate of on-site inventory, which shows that high-value commerce data is now being deployed where reach can scale more efficiently. The Trade Desk’s April 2026 integration with Pacvue and Skai brought programmatic CTV and retail media activation into a unified workflow, which reduced the gap between commerce planning and premium video execution. That matters because advertisers in retail, apparel, consumer electronics, and CPG can use purchase-based signals to target high-intent households in full-screen streaming environments where linear television cannot support the same level of audience specificity. As more retail networks and demand platforms link their data layers, the OTT programmatic advertising market is likely to favor participants that can combine premium inventory access with commerce-grade audience enrichment.
Restraints Impact Analysis*
| Restraint | (~) % Impact on CAGR Forecast | Geographic Relevance | Impact Timeline |
|---|---|---|---|
| Privacy-Driven Signal Loss Limiting Audience Graphs | -1.80% | Global, most acute in Europe and markets with strict consent frameworks | Long term (≥ 4 years) |
| Supply-Path Complexity Raising Take Rates and Transparency Costs | -1.30% | Global | Medium term (2-4 years) |
| CTV Ad Fraud and Invalid Traffic Pressure | -1.00% | Global, highest rates in Asia-Pacific and Europe, the Middle East, and Africa | Short term (≤ 2 years) |
| Fragmented Measurement Standards Slowing Budget Reallocation | -0.70% | Global | Medium term (2-4 years) |
| Source: Mordor Intelligence | |||
Privacy-Driven Signal Loss Limiting Audience Graphs
Signal loss is no longer a temporary adjustment issue, and it now acts as a steady pressure point on the OTT programmatic advertising market, especially for inventory without strong login depth or persistent user relationships. Safari restrictions, Firefox cookie partitioning, consent-led opt-outs, and mobile identifier resets all reduce how much addressable data remains available for audience matching across the wider digital ecosystem. This creates a clear split between premium streaming platforms that can rely on authenticated subscriber environments and long-tail OTT or FAST inventory, where audience match rates and CPM support are weaker. Comscore found that many respondents planned to increase contextual targeting, which shows that many buyers are adjusting to lower identity precision instead of fully replacing lost cross-platform recognition. Frequency management becomes harder in the same environment because a weaker identity spine makes it more difficult to control repeated exposure across multiple streaming services and devices. The net effect is that the OTT programmatic advertising market still grows, but more of that growth concentrates around data-rich platforms that can preserve audience utility under tighter privacy conditions.
Supply-Path Complexity Raising Take Rates and Transparency Costs
Supply-path complexity remains a structural drag on the OTT programmatic advertising market because each added intermediary can reduce working media efficiency and make inventory accountability harder to verify. Buyers are increasingly responding by reducing the number of supply-side partners they use and concentrating spending on cleaner, more direct, and better-documented paths that align with verification tools such as ads.txt and sellers.json. The IAB Tech Lab’s SupplyChain Object v1.1, released in 2026, strengthened that push by requiring disclosure of all technical custodians involved in the bid request flow, not only the direct commercial relationships. That improves trust, but it also raises implementation and compliance demands for smaller publishers that do not have dedicated ad-tech teams or mature supply-path governance. Premium publishers with direct, transparent paths are therefore better positioned to capture budget from supply-path optimization programs, while fragmented inventory owners face lower pricing power and weaker buyer confidence. This creates a widening quality gap inside the OTT programmatic advertising market, where access to premium demand increasingly depends on verifiable infrastructure as much as on audience scale.
*Our forecasts treat driver/restraint impacts as directional, not additive. The impact forecasts reflect baseline growth, mix effects, and variable interactions.
Segment Analysis
By Platform Type: Programmatic Guaranteed Reshaping Premium Inventory Allocation
Real-time bidding held the largest platform share at 38.44% in 2025, while programmatic guaranteed is projected to post the fastest growth at a 14.43% CAGR through 2031 within the OTT programmatic advertising market. Real-time bidding kept its lead because it has long served as the default transaction method for digital video and connected TV inventory across broad demand pools. That legacy still matters, since many advertisers use RTB to preserve flexibility, scale testing activity quickly, and compare inventory performance across publishers without committing budget too early. Even so, the center of gravity in the OTT programmatic advertising market is shifting toward premium inventory structures that offer more control over price, delivery, and audience quality. This is why programmatic guaranteed is growing faster than other platform types, as premium streaming owners seek digital execution without giving up revenue stability or inventory discipline.
Programmatic guaranteed is gaining traction because it gives publishers fixed-price certainty and guaranteed delivery, while still preserving targeting, reporting, and workflow efficiencies that brand advertisers expect from digital infrastructure. That balance matters in the OTT programmatic advertising industry, where premium publishers need to protect yield and buyer trust at the same time. Private marketplace activity also remains important because it gives vetted buyers access to brand-safe inventory pools that usually command better pricing and stronger campaign quality than open auction routes. Curated marketplaces are becoming more relevant as buyers look for verified supply, audience packaging, and lower waste in the same transaction path, which reinforces the move away from undifferentiated open exchange buying. Preferred deals still serve selective use cases, but the broader direction of the OTT programmatic advertising market points toward transaction models that combine automation with tighter inventory governance.



By Ad Format: Interactivity Extending Video’s Commercial Surface Area
Video ads accounted for 55.26% of segment revenue in 2025, while interactive ads are projected to grow at a 14.57% CAGR through 2031 in the OTT programmatic advertising market. Video remained the dominant format because OTT is built around full-screen video consumption, and pre-roll and mid-roll placements remain the native monetization unit for most premium streaming environments. This base also benefits from established advertiser familiarity, as many brand buyers still evaluate OTT performance through a television lens even when campaigns are executed through digital systems. The strength of video, therefore, reflects both product-market fit and a long-standing buyer comfort with sight, sound, and motion in lean-back viewing environments. At the same time, the fastest growth is moving toward formats that add interaction and performance utility to the viewing experience without abandoning the premium visual context.
Interactive ads are expanding because pause ads, shoppable overlays, and second-screen commerce links turn passive exposure into measurable action opportunities that are easier to connect to business outcomes. The IAB reported that targeting capabilities overtook content quality as the top purchase criterion for TV and video buyers in 2026, rising 10 percentage points year over year, which supports the broader move toward more data-responsive and outcome-aware ad formats. That shift is especially relevant for smaller and mid-sized buyers that value measurable performance and faster learning loops more than broad reach alone. Display placements, including homescreen banners and pause-state surfaces, are also widening the commercial surface area of the OTT programmatic advertising market, especially after Equativ and Titan OS launched a programmatic home-screen video solution for connected TVs in Europe and South America in May 2026. Audio-only pre-roll and other minor overlay formats remain small, but they still support monetization in FAST and radio-adjacent streaming categories where flexible inventory packaging is useful.
By Device Type: Smart TV’s Twin Advantage In Share And Growth
Smart TVs held 44.63% share in 2025 and are projected to record the fastest growth at a 14.66% CAGR through 2031, which places them at the center of the OTT programmatic advertising market. This pairing of leadership in both size and growth is notable because the largest segment in a market often grows slower than emerging segments, not faster. Smart TV inventory keeps attracting demand because the big-screen environment closely mirrors the brand-building feel of traditional television while still supporting digital-style targeting and optimization. That mix supports higher pricing power, especially for premium content, long-form viewing, and household-level brand campaigns that benefit from visual scale and a more attentive viewing setting. As a result, smart TVs continue to anchor where premium programmatic video budgets flow first inside the OTT programmatic advertising market.
Live and premium streaming use cases are also improving on smart TVs as ad delivery infrastructure becomes more seamless and less dependent on client-side limitations. Amazon launched server-side ad insertion support for Amazon IVS Low-Latency Streaming in April 2026, which enables live-stream publishers to deliver smoother ad breaks with real-time decisioning and better monetization control. Smartphones and tablets still matter as the second major device pool, especially in mobile-first streaming markets where household television penetration is lower but app-based viewing is deeply established. Laptops and desktops continue to serve browser-based streaming use cases, yet they face more exposure to ad blocking and weaker client-side insertion efficiency than server-oriented delivery environments. This leaves the OTT programmatic advertising market increasingly biased toward device contexts where seamless ad insertion, full-screen attention, and premium content alignment are strongest.
By End-User Industry: Retail’s Data Edge And Financial Services’ Audience Focus
Retail and e-commerce held 26.67% of the OTT programmatic advertising market size in 2025, while financial services is projected to expand at a 14.62% CAGR through 2031. Retail led because its first-party purchase data fits naturally with programmatic OTT targeting, allowing brands to connect high-intent audience signals with premium video placements in a way linear television cannot match. Closed-loop attribution also gives retail and commerce advertisers a stronger reason to keep scaling spend, since they can connect exposure, audience quality, and downstream purchase outcomes more directly. That advantage becomes even stronger as retail media networks extend off-site activation and as commerce platforms link campaign management across search, display, social, and connected TV environments. In effect, retail remains the clearest example of how data infrastructure can turn the OTT programmatic advertising market into both a branding channel and a measurable sales channel.
Financial services is the fastest-growing end-user segment because banks, insurers, wealth managers, and fintech brands increasingly view premium streaming audiences as high-value households that are difficult to reach efficiently through broad linear buys alone. This shift reflects growing confidence that audience quality, not just audience size, is becoming the more useful planning variable in premium connected TV. Media and entertainment remain an important contributor, although growth is moderating as major streaming platforms focus more tightly on retention efficiency and campaign return. Automotive showed softness in 2026 because tariff-linked supply pressures affected spending patterns across major ad categories, according to Magnite’s 2026 commentary on vertical demand trends. Healthcare, pharmaceuticals, travel, hospitality, and other user groups continue to participate in the OTT programmatic advertising market, but their pace is shaped more by compliance limits, seasonality, and campaign timing than by the structural data advantage that retail currently enjoys.
Geography Analysis
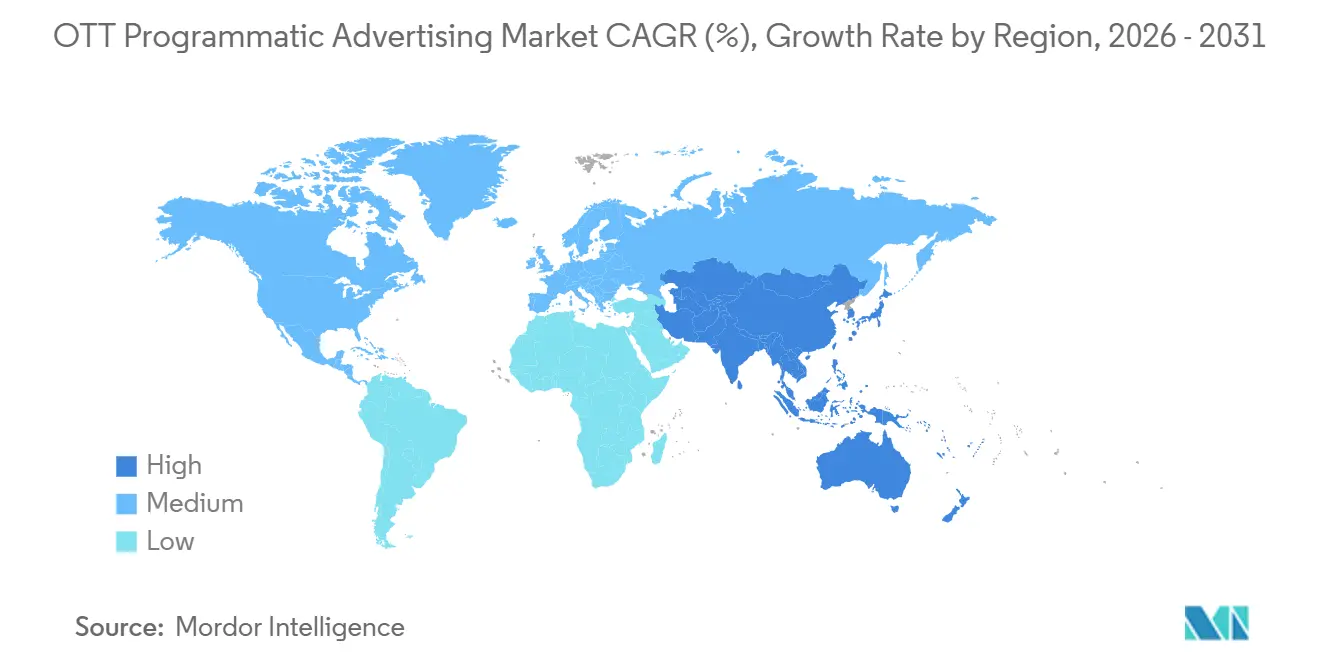
North America held 40.56% of the OTT programmatic advertising market share in 2025, which kept it as the largest regional revenue base. The region benefits from strong connected TV hardware penetration, mature DSP and SSP infrastructure, and a dense premium publisher base that is already configured for automated monetization. The Trade Desk’s January 2026 launch of OpenAds with partners including AccuWeather, The Guardian, Hearst, Newsweek, and BuzzFeed showed how the region is also leading in direct and more transparent auction design. North America also shows stronger buy-side discipline in fraud mitigation than many other regions, which helps protect premium connected TV budgets from waste. Pixalate reported a 19% connected TV invalid traffic rate in the United States in Q4 2025, the lowest among major global markets tracked in the supplied material, which supports North America’s position as the most operationally mature regional base.
Asia-Pacific is projected to grow at a 14.72% CAGR through 2031, making it the fastest-growing regional block in the OTT programmatic advertising market. Growth is being driven by strong streaming adoption in India and Southeast Asia, along with rising connected TV use in South Korea and Australia. The IAB SEA and India CTV and OTT Council found in 2025 that 74% of marketers across the region planned to increase connected TV and OTT investment, which shows that demand is scaling across multiple national markets rather than one isolated country. The Asia Video Industry Association projected in 2026 that premium video on demand would add USD 12.5 billion in incremental growth revenue across Asia-Pacific between 2025 and 2030 and reach USD 52 billion by decade's end, which underlines the size of the viewing base that programmatic buyers are moving toward. At the same time, Pixalate reported a 58% connected TV invalid traffic rate in Asia-Pacific in Q1 2026, which means the region’s rapid growth is also pushing buyers toward curated and private marketplace structures that can better control quality risk.
Europe, the Middle East, Africa, and South America show uneven maturity, with Europe standing out for scale, governance, and higher fraud sensitivity. Germany’s OVK and BVDW projected that programmatic revenue would exceed EUR 6 billion in 2026, equivalent to USD 6.84 billion at the supplied conversion, and account for 80% of all German online display and video revenue, which signals that automation is already the default operating model in one of Europe’s largest digital ad markets. Pixalate recorded Q1 2026 connected TV invalid traffic rates of 46.1% in the United Kingdom and 44% in Germany, which shows that mature demand does not remove the need for brand-safety controls and supply verification. The Middle East, Africa, and South America remain earlier-stage parts of the OTT programmatic advertising market, where adoption is rising, but infrastructure depth, premium publisher readiness, and local programmatic standards still vary widely across countries.

Competitive Landscape
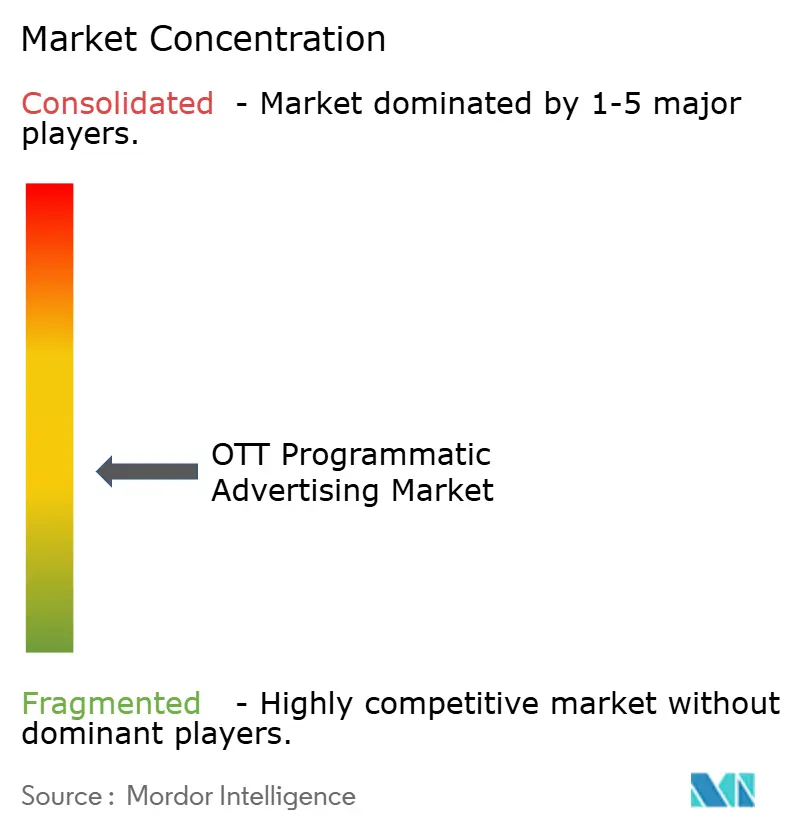
The OTT programmatic advertising market is moderately consolidated at the DSP layer, but it remains fragmented across measurement, identity, supply-side infrastructure, and curation services. This means competitive advantage is not secured by one capability alone, because buyers increasingly compare platforms on data access, transparency, fraud control, workflow speed, and the ability to connect premium supply with measurable outcomes. The Trade Desk remains central to the independent DSP conversation, and its recent moves show a strategy focused on cleaner supply paths and deeper commerce activation rather than scale for its own sake. Its January 2026 OpenAds launch pushed a publisher-direct auction model, while its April 2026 Pacvue and Skai integration linked programmatic CTV buying more closely with retail media workflows. Those moves suggest that future leadership in the OTT programmatic advertising market will depend as much on ecosystem design and interoperability as on raw media spend passing through a platform.
On the supply side, Magnite has become increasingly defined by connected TV infrastructure and premium omnichannel execution. Magnite reported 32% top-line connected TV revenue growth in Q4 2025, and connected TV exceeded 50% of total contribution ex-TAC by Q1 2026, which shows how deeply its revenue mix has shifted toward streaming monetization. In June 2026, the company launched Magnite Orchestration, a framework that connects AI-driven buyer agents with a seller agent across premium omnichannel inventory, which positions automation as a direct competitive lever rather than a background tool. PubMatic is pushing a related agenda through AgenticOS and its Creator Marketplace, which extends premium connected TV access to independent agencies and creator-led inventory pools that want structured programmatic demand. Together, these actions show that the OTT programmatic advertising market is moving toward automation layers that shape not only bidding decisions, but also how supply is packaged, qualified, and made discoverable.
The most consequential structural move in 2026 came from Publicis Groupe’s agreement to acquire LiveRamp for USD 2.2 billion, which signaled that identity and data collaboration infrastructure are becoming strategic control points in programmatic competition. That transaction raises pressure on independent measurement and attribution providers, because buyers will increasingly expect privacy-safe identity, outcome measurement, and media activation to work together rather than sit in separate operational silos. Competitive strategy in the OTT programmatic advertising market is therefore splitting between scale-oriented platform models and trust-oriented infrastructure models, with both sides trying to reduce margin leakage, improve addressability, and secure more direct access to premium inventory. The result is a market where partnerships, acquisitions, and workflow control matter nearly as much as pure share, which is why the field remains active but not dominated by a single fully integrated winner.
OTT Programmatic Advertising Industry Leaders
The Trade Desk, Inc.
Google LLC
Amazon.com, Inc.
Microsoft Corporation
Magnite, Inc.
- *Disclaimer: Major Players sorted in no particular order

Recent Industry Developments
- June 2026: Magnite launched Magnite Orchestration, a coordination layer enabling AI-driven buyer agents to connect to Magnite's seller agent and activate against its premium omnichannel inventory, with dentsu and DIRECTV Advertising among the first beta participants, a development that operationalizes agentic AI in the programmatic supply chain for the first time at SSP scale.
- June 2026: PubMatic launched its Creator Marketplace, the first programmatic CTV auction connecting independent creator media companies' premium CTV inventory with programmatic and agentic demand, with FreeWheel as inaugural ad server partner and MeatEater as launch publishing partner.
- May 2026: Publicis Groupe announced the acquisition of LiveRamp for a total enterprise value of USD 2.2 billion, positioning the holdco as a data-collaboration platform operator and triggering broad debate about the neutrality of identity infrastructure in the independent programmatic ecosystem.
- May 2026: Equativ and Titan OS launched the first programmatic home-screen video ad solution for CTV in Europe and South America, enabling programmatic video placements directly on smart TV home screens, a new OTT inventory surface previously inaccessible to automated buying.


Global OTT Programmatic Advertising Market Report Scope
The OTT Programmatic Advertising Market refers to the ecosystem for buying and selling ads on streaming platforms through automated, data-driven systems. It covers ad inventory on OTT and connected TV services where campaigns are optimized in real time using audience, behavioral, and contextual signals.
The OTT Programmatic Advertising Market Report is Segmented by Platform Type (Real-Time Bidding, Private Marketplace, Programmatic Guaranteed, and Preferred Deals), Ad Format (Video Ads, Display Ads, and Interactive Ads), Device Type (Smartphones and Tablets, Smart TVs, and Laptops and Desktops), End-User Industry (Media and Entertainment, Retail and E-Commerce, Automotive, Healthcare and Pharmaceuticals, Financial Services, and Travel and Hospitality), and Geography (North America, South America, Europe, Asia-Pacific, Middle East, and Africa). The Market Forecasts are Provided in Terms of Value (USD).
| Real-Time Bidding |
| Private Marketplace |
| Programmatic Guaranteed |
| Preferred Deals |
| Other Platform Types |
| Video Ads |
| Display Ads |
| Interactive Ads |
| Other Ad Formats |
| Smartphones and Tablets |
| Smart TVs |
| Laptops and Desktops |
| Other Device Types |
| Media and Entertainment |
| Retail and E-Commerce |
| Automotive |
| Healthcare and Pharmaceuticals |
| Financial Services |
| Travel and Hospitality |
| Other End User Industries |
| North America | United States |
| Canada | |
| Mexico | |
| South America | Brazil |
| Argentina | |
| Chile | |
| Rest of South America | |
| Europe | Germany |
| United Kingdom | |
| France | |
| Italy | |
| Spain | |
| Rest of Europe | |
| Asia-Pacific | China |
| Japan | |
| India | |
| South Korea | |
| Australia | |
| Rest of Asia-Pacific | |
| Middle East | Saudi Arabia |
| United Arab Emirates | |
| Qatar | |
| Rest of Middle East | |
| Africa | South Africa |
| Egypt | |
| Nigeria | |
| Rest of Africa |
| By Platform Type | Real-Time Bidding | |
| Private Marketplace | ||
| Programmatic Guaranteed | ||
| Preferred Deals | ||
| Other Platform Types | ||
| By Ad Format | Video Ads | |
| Display Ads | ||
| Interactive Ads | ||
| Other Ad Formats | ||
| By Device Type | Smartphones and Tablets | |
| Smart TVs | ||
| Laptops and Desktops | ||
| Other Device Types | ||
| By End-User Industry | Media and Entertainment | |
| Retail and E-Commerce | ||
| Automotive | ||
| Healthcare and Pharmaceuticals | ||
| Financial Services | ||
| Travel and Hospitality | ||
| Other End User Industries | ||
| By Geography | North America | United States |
| Canada | ||
| Mexico | ||
| South America | Brazil | |
| Argentina | ||
| Chile | ||
| Rest of South America | ||
| Europe | Germany | |
| United Kingdom | ||
| France | ||
| Italy | ||
| Spain | ||
| Rest of Europe | ||
| Asia-Pacific | China | |
| Japan | ||
| India | ||
| South Korea | ||
| Australia | ||
| Rest of Asia-Pacific | ||
| Middle East | Saudi Arabia | |
| United Arab Emirates | ||
| Qatar | ||
| Rest of Middle East | ||
| Africa | South Africa | |
| Egypt | ||
| Nigeria | ||
| Rest of Africa | ||


Key Questions Answered in the Report
What is the 2026 size of OTT programmatic advertising?
The OTT programmatic advertising market reached USD 87.30 billion in 2026 and is projected to reach USD 168.90 billion by 2031 at a 14.11% CAGR.
What is driving ad budget growth in connected TV?
The main drivers are budget migration from linear TV, broader programmatic access for smaller advertisers, stronger first-party targeting, and AI-led campaign optimization.
Which platform model is growing fastest in OTT ad buying?
Programmatic guaranteed is the fastest-growing platform type with a 14.43% CAGR through 2031, as premium publishers seek pricing control and guaranteed delivery.
Which ad format leads revenue and which one is expanding fastest?
Video ads led with 55.26% share in 2025, while interactive ads are projected to grow fastest at a 14.57% CAGR through 2031.
Why are smart TVs so important for streaming ad spend?
Smart TVs held 44.63% share in 2025 and are also the fastest-growing device segment at a 14.66% CAGR, supported by premium full-screen viewing and stronger advertiser pricing.
Which region is growing fastest for automated OTT campaigns?
Asia-Pacific is the fastest-growing region with a 14.72% CAGR through 2031, driven by rapid streaming growth, rising connected TV adoption, and expanding regional demand.
Page last updated on:





