
OTT Infrastructure Market Size and Share
Market Overview
| Study Period | 2020 - 2031 |
|---|---|
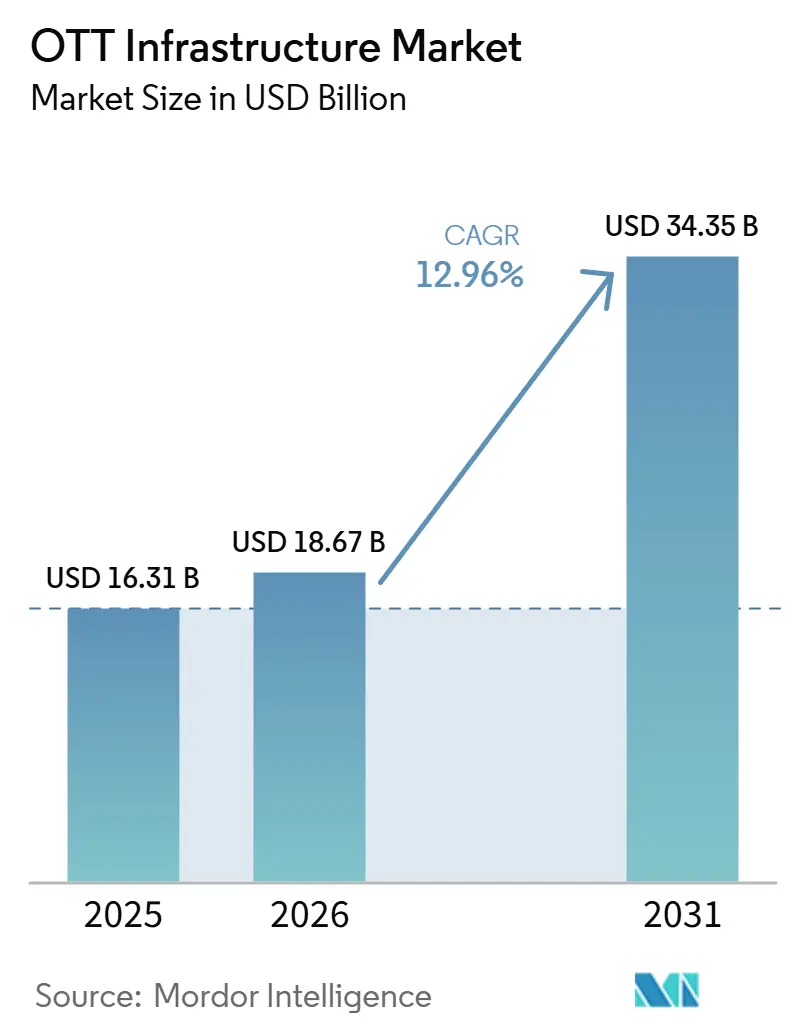
| Market Size (2026) | USD 18.67 Billion |
| Market Size (2031) | USD 34.35 Billion |
| Growth Rate (2026 - 2031) | 12.96 % |
| Fastest Growing Market | Asia-Pacific |
| Largest Market | North America |
| Market Concentration | Medium |
Major Players *Disclaimer: Major Players sorted in no particular order Image © Mordor Intelligence. Reuse requires attribution under CC BY 4.0. | |
OTT Infrastructure Market Analysis by Mordor Intelligence
The OTT infrastructure market size was valued at USD 16.31 billion in 2025 and is estimated to grow from USD 18.67 billion in 2026 to reach USD 34.35 billion by 2031, at a CAGR of 12.96% during the forecast period (2026-2031). Video distribution is moving from traditional broadcast systems to IP networks, making reliable streaming infrastructure a core operating requirement for content owners. Premium live events are raising expectations for latency, resilience, and concurrent viewing capacity across the OTT infrastructure market. Cloud-native workflows, edge processing, and automated video operations are increasingly intertwined as providers manage both large content libraries and live programming. Data residency rules in the Middle East, South Asia, Southeast Asia, and Europe are supporting local infrastructure investment alongside upgrade activity in mature markets. Competition is shifting toward integrated platforms that combine delivery, encoding, security, analytics, and AI-based workflow tools, while pure CDN delivery faces pricing pressure.
Key Report Takeaways
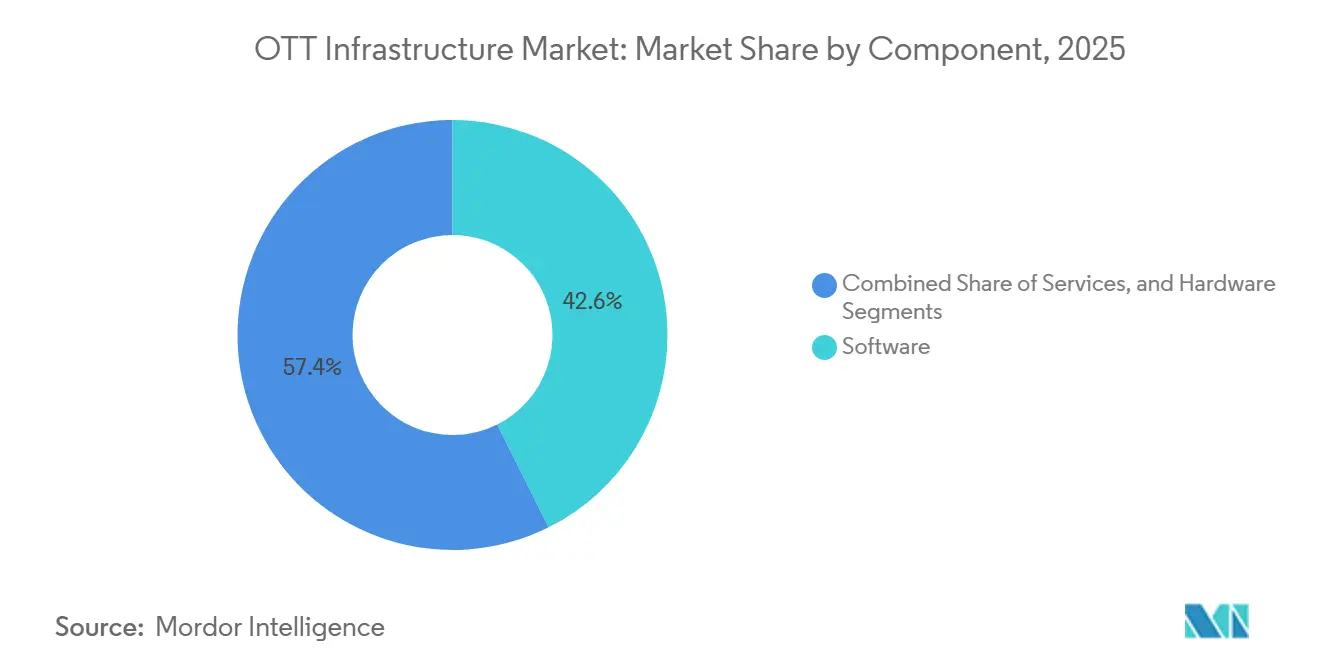
- By component, software held 42.61% of the OTT infrastructure market share in 2025 and is projected to expand at a 13.75% CAGR through 2031.
- By deployment, cloud-based systems accounted for 53.38% of the OTT infrastructure market share in 2025, while hybrid and edge deployments are projected to grow at a 13.21% CAGR through 2031.
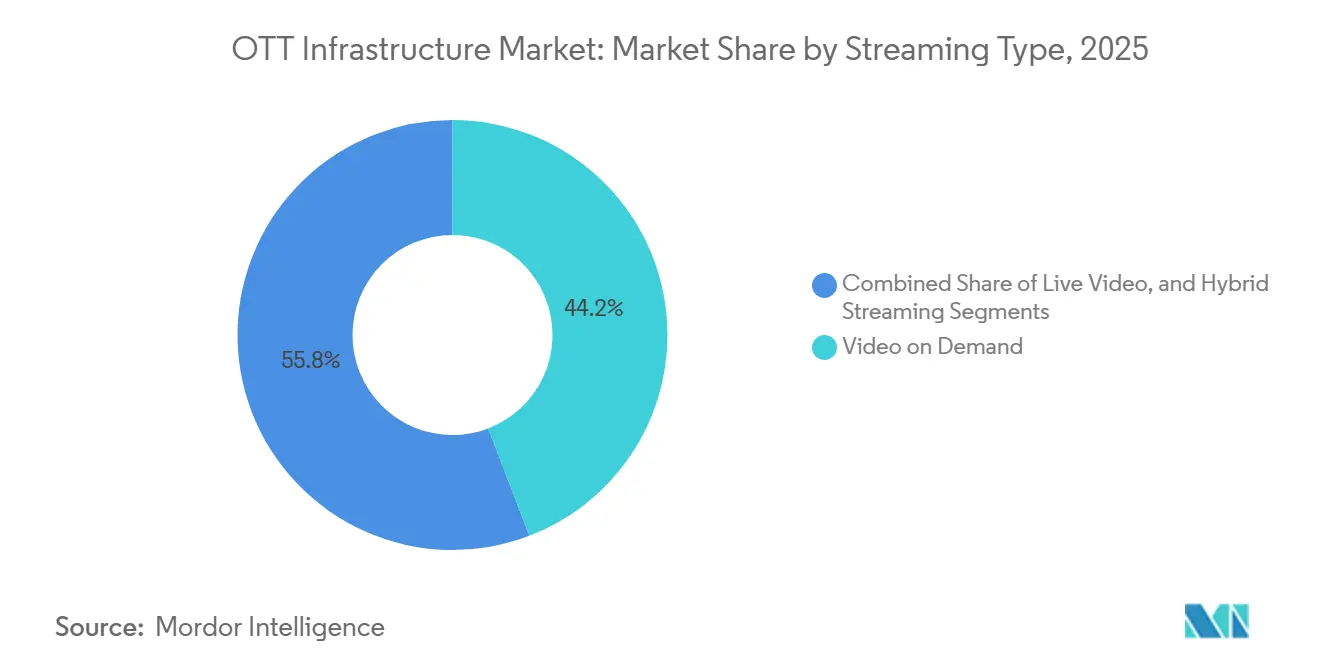
- By streaming type, video on demand accounted for 44.18% of the OTT infrastructure market share in 2025, while live video streaming is expected to grow at a 13.53% CAGR through 2031.
- By end user, media and entertainment accounted for 52.73% of the over-the-top (OTT) infrastructure market share in 2025, while e-learning and education are projected to expand at a 13.85% CAGR through 2031.
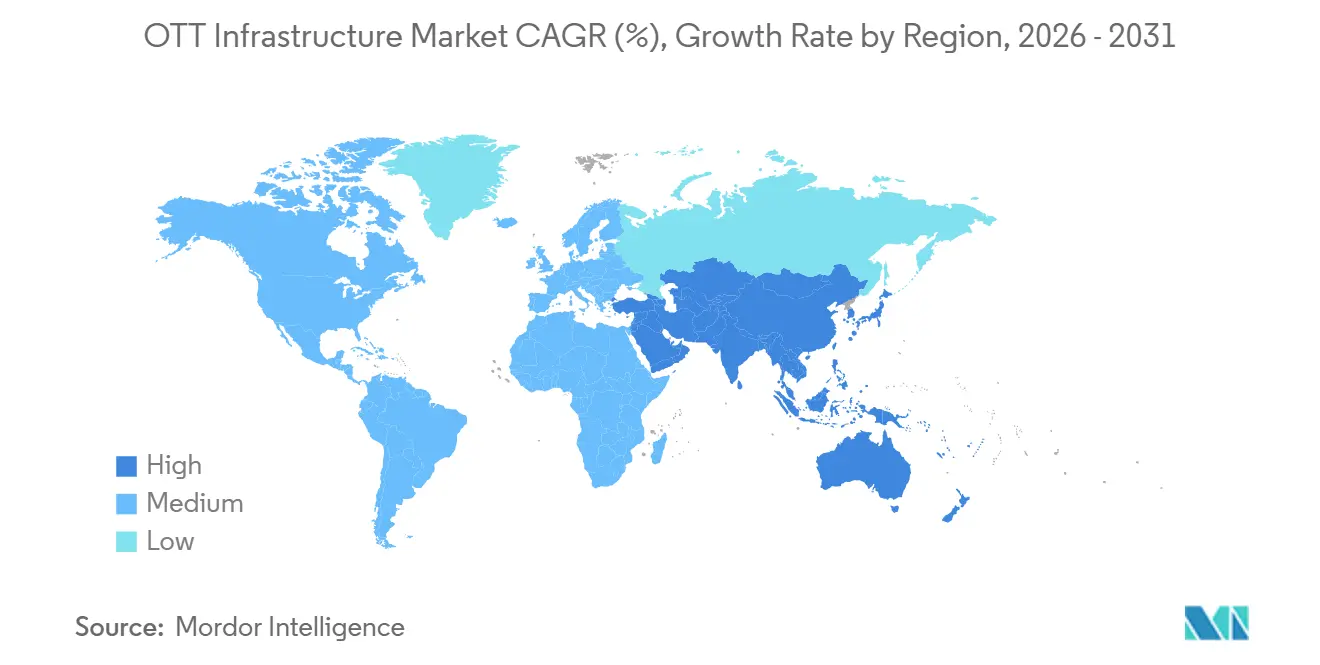
- By geography, North America held 38.57% of the OTT infrastructure market share in 2025, while Asia-Pacific is projected to advance at a 13.68% CAGR through 2031.
Note: Market size and forecast figures in this report are generated using Mordor Intelligence’s proprietary estimation framework, updated with the latest available data and insights as of January 2026.
Market Trends and Insights
Drivers Impact Analysis of OTT Infrastructure Market*
| Driver | (~) % Impact on CAGR Forecast | Geographic Relevance | Impact Timeline |
|---|---|---|---|
| OTT Video Traffic and 4K/8K Adoption | +3.2% | Global | Long term (≥ 4 years) |
| Low-Latency Live Sports and Interactive Streaming | +2.7% | North America and Europe, with Asia-Pacific growing | Medium term (2-4 years) |
| Cloud-Native and Edge-Based Workflow Migration | +2.3% | Global, led by North America and Asia-Pacific | Medium term (2-4 years) |
| AI-Optimized Video Operations and Metadata Automation | +1.9% | Global | Long term (≥ 4 years) |
| Multi-CDN Resilience and Network-API Monetization | +1.2% | North America and Europe | Short term (≤ 2 years) |
| Rights-Owner M&A and Full-Stack Infrastructure Consolidation | +0.8% | North America and Europe, with spillover to Asia-Pacific | Short term (≤ 2 years) |
| Source: Mordor Intelligence | |||
OTT Video Traffic and 4K/8K Adoption
IP video traffic is increasing the network capacity that streaming services must maintain during peak viewing periods. The move to 4K and early 8K formats increases bitrate needs for each stream and reduces available network headroom. This creates demand for more efficient encoding, larger origin storage, and denser CDN cache networks within the OTT infrastructure market. The Digital Television Group reported in 2025 that Netflix delivered nearly 30% of its streams in AV1, demonstrating how codec choices affect encoding, device certification, and delivery configurations simultaneously.[1]Digital Television Group, “Advancing the Media Ecosystem Through Next-Generation Codecs,” Digital Television Group, dtg.org.uk. Higher video quality cannot be achieved solely by adding capacity, because operators also need to redesign their delivery architecture. Providers that delayed 4K upgrades during the 2022-2024 cost-control period now face a shorter window to modernize their systems.
Low-Latency Live Sports and Interactive Streaming
Live sports have become a major driver of demand for low-latency streaming, as viewers can switch services when online coverage lags behind television coverage. DAZN used regional production centers in the United Kingdom, the Netherlands, Italy, Spain, and Japan for its 2026 World Cup workflows, following testing of the model during the 2025 Club World Cup. Big Blue Marble and Ateme also ran a Media over QUIC proof of concept during the 2026 tournament, reporting latency reductions of 20-40 seconds compared with other Austrian streaming platforms. These cases show why the OTT infrastructure market requires specialized origin packaging, CDN settings, and player optimization for live delivery. Low-latency HLS and DASH workflows cannot simply be added to older video-on-demand systems without operational changes. Broadcast rights windows and simulcast obligations in regulated European markets further increase the need for systems designed for live compliance.
Cloud-Native and Edge-Based Workflow Migration
Cloud-native migration now supports faster codec testing, flexible AI processing, and simpler management of separate video functions. Harmonic expanded its hybrid streaming platform in April 2026 with cloud-native deployment on Red Hat OpenShift and support for Model Context Protocol connections, before its video business moved to MediaKind in June 2026. In May 2026, Bitmovin moved MUBI from a legacy on-premises encoding stack to cloud-based VOD encoding through AWS Marketplace, supporting AVC, HEVC, and AV1 workflows. Equinix reported investment in Brazil, Mexico, Chile, and Colombia between 2025 and 2026 to expand data centers and hybrid-cloud interconnection, supporting the regional foundation for OTT infrastructure market deployments. Cloud and edge systems are not separate choices in many operating models because cloud platforms help manage distributed edge capacity. This supports hybrid models for providers that need cloud-scale but also require local processing for live events or data localization.
AI-Optimized Video Operations and Metadata Automation
AI tools are reducing the manual work needed to prepare, classify, localize, and monetize video libraries. Amagi introduced Agentic Media Operations on its NOW platform in April 2026 with tools for metadata enrichment, EPG-ready descriptions in more than 25 languages, ad-break identification, and captioning from 29 source languages into more than 100 output languages. Synamedia introduced its Quortex AI framework in 2025 to provide on-demand plugins for content understanding and real-time metadata creation using Amazon Bedrock. Wowza made its Video Intelligence Framework generally available on July 20, 2026, with production models for object detection and scene analysis that work with NVIDIA technology. These capabilities give over-the-top (OTT) infrastructure market participants a way to process larger content catalogs without keeping pace with the growth in manual operations. Providers without automated metadata systems may find it harder to maintain discovery quality and localization coverage at scale.
Restraints Impact Analysis of OTT Infrastructure Market*
| Restraint | (~) % Impact on CAGR Forecast | Geographic Relevance | Impact Timeline |
|---|---|---|---|
| Bandwidth, Egress, and Transcoding Cost Inflation | -1.8% | Global, most acute in Asia-Pacific and South America | Long term (≥ 4 years) |
| Device, Codec, and Playback Fragmentation | -1.3% | Global, most pronounced in Asia-Pacific and emerging markets | Medium term (2-4 years) |
| Data Residency and Cross-Border Privacy Constraints | -0.9% | Middle East, Europe, and Asia-Pacific | Medium term (2-4 years) |
| Power Availability and Carbon Intensity at Edge Locations | -0.6% | Europe and North America | Long term (≥ 4 years) |
| Source: Mordor Intelligence | |||
Bandwidth, Egress, and Transcoding Cost Inflation
Bandwidth, egress, and transcoding costs remain a margin concern for streaming operators as viewing volumes rise. A broader range of devices requires services to store and deliver multiple formats, which increases the cost of encoding and origin storage. Multi-codec ladders for AV1, HEVC, and H.264 can preserve audience coverage, but they also increase processing requirements. The OTT infrastructure market must therefore balance delivery quality against the cost of serving high-resolution video to large audiences. High delivery costs can delay platform upgrades and make expansion into bandwidth-intensive markets more difficult. Local caching, efficient codecs, and well-managed multi-CDN arrangements can reduce this pressure, although they require capital and operational expertise.
Device, Codec, and Playback Fragmentation
Different device capabilities make the change from H.264 to newer codecs more difficult than product roadmaps suggested. NETINT's March 2026 survey of nearly 200 streaming professionals found that 17% were using AV1 in production, 40% planned deployments in 2026, and 54% identified hardware-decode support as a barrier.[2]NETINT Technologies, “State of Video Encoding Survey,” NETINT Technologies, netint.com. Toolchain limitations and encoding compute costs were also cited as constraints in the survey. Fragmented HEVC licensing and uneven browser support mean many providers must maintain multiple codec paths. This adds testing, storage, quality assurance, and device-management work to OTT infrastructure market operations. The burden is particularly significant where older or lower-cost devices remain common, and providers cannot remove H.264 fallback support without losing viewers.
*Our forecasts treat driver/restraint impacts as directional, not additive. The impact forecasts reflect baseline growth, mix effects, and variable interactions.
OTT Infrastructure Market Segment Analysis
By Component:
Software Holds the Largest Share and Fastest GrowthSoftware held 42.61% of the OTT infrastructure market share in 2025 and is projected to grow at a 13.75% CAGR through 2031. Video management, orchestration, encoding, transcoding, DRM, and analytics are the central software categories. Operators are consolidating separate tools into platforms that can support cloud, edge, and on-premises systems. This helps them manage video workflows with fewer disconnected operating environments. The shift also improves operational visibility, supports faster service updates, and enables more consistent content delivery across devices and network conditions. As OTT platforms scale their live, on-demand, and personalized video offerings, software remains critical for improving workflow automation, protecting premium content, monitoring performance, and supporting monetization strategies.
Services include managed operations, professional support, and integration work for customers that lack specialized engineering teams. Demand for these services grows as operators adopt multi-CDN designs or shift critical workloads to the cloud. Hardware remains necessary for live contribution workflows, edge points of presence, storage, network equipment, and compute acceleration. Its role is changing as GPU-backed cloud resources take on encoding workloads once handled by dedicated appliances. Wowza's July 2026 collaboration with NVIDIA shows how hardware acceleration is increasingly delivered through managed software functions.



By Deployment:
Cloud-Based Systems Lead While Hybrid and Edge Systems Grow FasterCloud-based deployments accounted for 53.38% of the OTT infrastructure market share in 2025. It supports elastic scaling, usage-based pricing, and access to large pools of AI processing capability, making it suitable for operators that need flexible infrastructure without a heavy upfront investment. These attributes benefit platforms whose traffic changes sharply during live sports events, major content releases, seasonal viewing peaks, or high-demand premieres. Cloud systems also remain central to VOD encoding, origin storage, media management, content packaging, and workflow automation. In addition, cloud deployment enables faster service launches across multiple regions, supports integration with analytics and recommendation engines, and helps operators adjust compute and storage capacity as subscriber demand changes.
On-premises systems retain an installed base among broadcasters, organizations with domestic infrastructure requirements, and live production teams that need predictable latency. Hybrid and edge deployment is projected to expand at a 13.21% CAGR through 2031 as local processing supports data localization, interactive delivery, and lower egress costs. Bitmovin's work with MUBI showed the value of moving suitable encoding workloads to managed cloud services. At the same time, Lenovo's on-premises edge deployment for the 2026 FIFA World Cup IPTV distribution reflected the continued need for local infrastructure at latency-sensitive events. The over-the-top (OTT) infrastructure industry is consequently moving toward combined cloud and edge architectures rather than a single deployment model.
By Streaming Type:
Live Video Changes Delivery RequirementsVideo on demand held 44.18% of the OTT infrastructure market share in 2025. The segment benefits from established content libraries and the efficiency of pre-encoded, cached delivery, which helps platforms manage viewing demand while controlling distribution costs. Catalog depth remains important as subscribers continue to value broad access to movies, series, documentaries, and regional content. At the same time, platforms are adding sports, news, and reality programming to keep viewers engaged, increase session frequency, and reduce churn. This shift requires VOD platforms to add capabilities for live events, including low-latency streaming, real-time ad insertion, scalable cloud encoding, event-based traffic management, and stronger integration with content delivery networks.
Live video streaming is projected to grow at a 13.53% CAGR through 2031. Demand for low glass-to-glass latency in sports supports investment in low-latency HLS, DASH packaging, CDN configurations, and real-time monitoring. Hybrid streaming combines scheduled channel delivery with on-demand access and is relevant to free, ad-supported streaming television services. Ad insertion, program guide management, and playout automation add requirements that software suppliers such as Amagi and Synamedia address through cloud-based orchestration tools. Accessibility rules, content classifications, and broadcast obligations also make compliance tools more important for live and hybrid services.
By End User:
Media and Entertainment Leads While E-Learning and Education Grows FastestMedia and entertainment accounted for 52.73% of the OTT infrastructure market share in 2025. Streaming platforms, broadcasters adopting direct-to-consumer models, and sports rights holders need capabilities across encoding, DRM, analytics, CDN delivery, and content operations to support large-scale video delivery. Their high spending reflects the scale of content libraries, advertising activity, premium sports programming, and the need to deliver consistent viewing quality across devices and networks. As competition intensifies, these companies are investing in low-latency streaming, personalized recommendations, targeted advertising, multi-CDN strategies, and advanced audience measurement to improve engagement and monetization. This customer group remains the main revenue base for much of the OTT infrastructure market, as it continues to expand digital distribution, launch regional and global streaming services, and modernize workflows to support both subscription-based and ad-supported models.
E-learning and education are projected to grow at a 13.85% CAGR through 2031. Enterprises, universities, and public training organizations are increasingly using video for communication, instruction, and knowledge management. Kaltura launched its Avatar Video Production Studio in May 2026 to turn enterprise knowledge assets into interactive avatar-led videos. BFSI buyers use secure communication and compliant recording, while retail and e-commerce users use video for product launches and customer engagement. Healthcare, life sciences, government, and public-sector users also require secure systems that meet health data, residency, and security requirements.
Geography Analysis
North America OTT Infrastructure Market
North America held 38.57% of the OTT infrastructure market share in 2025. The region has high revenue per viewer, a large concentration of sports rights holders, and established CDN capacity that is gaining AI and edge computing functions. The United States drives most regional demand through investment by sports leagues, subscription platforms, and broadcasters moving toward direct distribution. Canada and Mexico benefit from domestic platform investment and from network buildouts that serve the wider North American footprint. Akamai reported USD 1.074 billion in first-quarter 2026 revenue, up 6% year over year, while cloud infrastructure services grew 40%, which reflected the move toward edge computing services.[3]Akamai Technologies, Inc., “Akamai Reports First Quarter 2026 Financial Results,” Akamai Technologies, May 7, 2026, akamai.com.
APAC OTT Infrastructure Market
Asia-Pacific is projected to advance at a 13.68% CAGR through 2031. India is a major demand center as streaming services expand beyond the largest metropolitan areas, supporting CDN deployment in tier-2 and tier-3 cities. Fastly expanded its points of presence in India during 2025 and 2026, underscoring the importance of local delivery capacity. China, Japan, and South Korea are mature regional markets with strong demand for premium video and low-latency sports coverage. India’s data protection framework and China’s cybersecurity rules can require data to be held and processed within national boundaries, increasing demand for locally located infrastructure. The over-the-top (OTT) infrastructure market in Asia-Pacific, therefore, combines high-growth markets with established systems that continue to improve video quality.
EMEA and South America OTT Infrastructure Market
Europe has steady demand from the United Kingdom, Germany, and France, where broadcaster digitization and platform competition support ongoing investment. The EU Data Act took effect in September 2025, and ongoing GDPR enforcement has increased interest in sovereign cloud arrangements. AWS launched its European Sovereign Cloud in early 2026 to address this requirement. South America is led by Brazil, where data center investment and 5G rollout support advertising-funded and FAST channel development. The Middle East is developing local streaming capacity as Saudi Arabia enforces its PDPL and the UAE prepares for full PDPL enforcement in January 2027. CDNetworks partnered with Salam Telecom in Saudi Arabia in February 2025 to improve low-latency international IP transit services. Africa remains at an earlier stage, with South Africa, Nigeria, and Egypt as key nodes, while power reliability and lower revenue per user constrain spending per subscriber.

Competitive Landscape
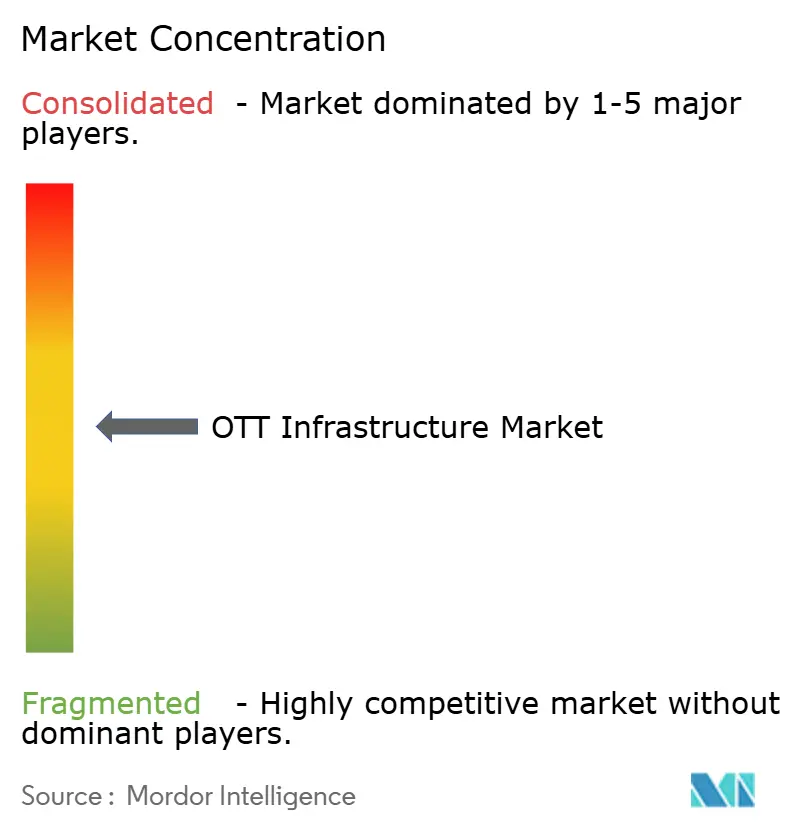
The OTT infrastructure market is moderately fragmented. Amazon Web Services, Microsoft, and Google have advantages in cloud scale, global points of presence, and access to AI processing capacity. Specialized providers compete through focused video workflows, playback tools, and systems designed for specific operational requirements. Cloudflare reported USD 2.1 billion in fiscal 2025 revenue, up 30% year over year, and guided to USD 2.79 billion for full-year 2026 as AI-agent networking and edge computing expand. This reflects the advantage of platforms that combine CDN, security, and compute services.[4]Cloudflare, “Cloudflare Announces Fourth Quarter and Fiscal Year 2025 Financial Results,” Business Wire, businesswire.com.
MediaKind completed its combination with Harmonic's video business on June 17, 2026. The combined business reported more than USD 100 million in annual recurring revenue and more than USD 150 million in annual appliance revenue, creating a broader independent offering across SaaS streaming, appliances, and cloud video technologies. This transaction shows that independent vendors are using consolidation to offer a wider range of services to operators that prefer fewer technology partners. Bending Spoons completed its USD 233 million acquisition of Brightcove in February 2025, reducing the number of standalone public streaming platform providers. Bitmovin partnered with Simplestream and Xperi in June 2026 to help OTT services launch on TiVo OS devices, using device integrations to extend playback reach. These moves show that the OTT infrastructure market rewards both fuller product portfolios and stronger distribution relationships.
AI-based operations, metadata intelligence, and audience engagement tools are becoming more important points of competition than basic delivery performance. Kaltura completed its USD 22 million acquisition of PathFactory in April 2026 and then launched the Avatar Video Production Studio in May 2026, broadening its role in AI-led content workflows. Providers that do not invest in automated content operations may struggle to match the discovery and monetization capabilities of better-integrated competitors. Data-residency rules in the Middle East and parts of Asia-Pacific create openings for regionally compliant platforms that can work alongside global cloud providers. Multi-codec support also adds to compliance work, as vendors must manage MPEG-DASH, HEVC licensing arrangements, and AV1 delivery models.
OTT Infrastructure Industry Leaders
Amazon Web Services, Inc.
Akamai Technologies, Inc.
Cloudflare, Inc.
Microsoft Corporation
Google LLC
- *Disclaimer: Major Players sorted in no particular order
OTT Infrastructure Market Companies Covered in this Report
- Amazon Web Services, Inc.
- Akamai Technologies, Inc.
- Cloudflare, Inc.
- Microsoft Corporation
- Google LLC
- IBM Corporation
- Cisco Systems, Inc.
- MediaKind
- Synamedia Limited
- Brightcove, Inc.
- Kaltura, Inc.
- Haivision Systems Inc.
- Bitmovin Inc.
- Wowza Media Systems, LLC
- Mux, Inc.
- Vimeo.com, Inc.
- Broadpeak SA
- Ateme S.A.
- Fastly, Inc.
- Qwilt Inc.
- CDNetworks Co., Ltd.
- Tata Communications Limited
- Verimatrix, Inc.
- Conviva, Inc.
- NPAW Spain, S.L.

Recent Industry Developments in OTT Infrastructure Market
- July 2026: Wowza Media Systems and NVIDIA jointly launched the Video Intelligence Framework, reaching general availability on July 20, 2026. The framework ships production-grade AI models, including RF-DETR object detection and CLIP-based scene analysis, with NVIDIA's Synthetic Video Detector available for customers running supported NVIDIA AI infrastructure, extending real-time video intelligence capabilities to OTT operators at scale.
- July 2026: Big Blue Marble and Ateme commenced a multi-month proof of concept for Media over QUIC (MoQ) streaming during a major international football championship, recording end-to-end latency reductions of 20 to 40 seconds compared to competing Austrian streaming platforms and outperforming terrestrial and satellite broadcasts by several seconds, establishing MoQ as a credible next-generation live streaming transport protocol.
- July 2026: Mediagenix announced new agentic AI capabilities on July 15, 2026, enabling media organizations to operationalize agentic workflows across channel operations, including title management, planning, and scheduling, powered by a semantic intelligence layer covering content, metadata, rights, and monetization relationships.
- June 2026: MediaKind completed its merger with Harmonic's video business on June 17, 2026. The combined company entered the market with over USD 100 million in annual recurring revenue and over USD 150 million in annual appliance revenue, creating the world's leading independent video infrastructure company with a full-stack portfolio spanning SaaS streaming, appliance platforms, and cloud video technologies.


Global OTT Infrastructure Market Report Scope
The OTT Infrastructure Market comprises the technologies, platforms, and services that enable the delivery, management, processing, storage, and distribution of over-the-top (OTT) content across internet-connected devices. It includes software solutions, infrastructure services, and hardware components that support content ingestion, encoding and transcoding, content delivery, storage, network optimization, security, analytics, and streaming operations. OTT infrastructure enables service providers to deliver high-quality video-on-demand (VOD), live streaming, and hybrid streaming experiences with scalability, reliability, and low latency across multiple devices and networks.
The OTT Infrastructure Market Report is Segmented by Component (Software, Services, and Hardware), Deployment (Cloud-Based, On-Premises, and Hybrid and Edge), Streaming Type (Video on Demand, Live Video, and Hybrid Streaming), End-User (Media and Entertainment, E-Learning and Education, BFSI, Retail and E-commerce, IT and Telecommunication, Healthcare and Life Sciences, Government and Public Sector, and Other End-Users), and Geography (North America, South America, Europe, Asia-Pacific, Middle East, and Africa). The Market Forecasts are Provided in Terms of Value (USD).
| Software | Video Management and Orchestration |
| Encoding, Transcoding, and Processing | |
| Video Security and DRM | |
| Video Analytics and QoE Monitoring | |
| Services | Managed Services |
| Professional Services | |
| Integration, Deployment, Training, and Support | |
| Hardware | Servers and Compute Accelerators |
| Encoders, Transcoders, and Codec Units | |
| Network Equipment and Appliances | |
| Storage and Origin Equipment |
| Cloud-Based |
| On-Premises |
| Hybrid and Edge |
| Video on Demand |
| Live Video |
| Hybrid Streaming |
| Media and Entertainment |
| E-Learning and Education |
| BFSI |
| Retail and E-commerce |
| IT and Telecommunication |
| Healthcare and Life Sciences |
| Government and Public Sector |
| Other End-Users |
| North America | United States |
| Canada | |
| Mexico | |
| South America | Brazil |
| Argentina | |
| Colombia | |
| Rest of South America | |
| Europe | Germany |
| United Kingdom | |
| France | |
| Italy | |
| Spain | |
| Russia | |
| Rest of Europe | |
| Asia-Pacific | China |
| India | |
| Japan | |
| South Korea | |
| Australia | |
| New Zealand | |
| Rest of Asia-Pacific | |
| Middle East | Saudi Arabia |
| United Arab Emirates | |
| Turkey | |
| Israel | |
| Rest of Middle East | |
| Africa | South Africa |
| Nigeria | |
| Egypt | |
| Rest of Africa |
| By Component | Software | Video Management and Orchestration |
| Encoding, Transcoding, and Processing | ||
| Video Security and DRM | ||
| Video Analytics and QoE Monitoring | ||
| Services | Managed Services | |
| Professional Services | ||
| Integration, Deployment, Training, and Support | ||
| Hardware | Servers and Compute Accelerators | |
| Encoders, Transcoders, and Codec Units | ||
| Network Equipment and Appliances | ||
| Storage and Origin Equipment | ||
| By Deployment | Cloud-Based | |
| On-Premises | ||
| Hybrid and Edge | ||
| By Streaming Type | Video on Demand | |
| Live Video | ||
| Hybrid Streaming | ||
| By End-User | Media and Entertainment | |
| E-Learning and Education | ||
| BFSI | ||
| Retail and E-commerce | ||
| IT and Telecommunication | ||
| Healthcare and Life Sciences | ||
| Government and Public Sector | ||
| Other End-Users | ||
| By Geography | North America | United States |
| Canada | ||
| Mexico | ||
| South America | Brazil | |
| Argentina | ||
| Colombia | ||
| Rest of South America | ||
| Europe | Germany | |
| United Kingdom | ||
| France | ||
| Italy | ||
| Spain | ||
| Russia | ||
| Rest of Europe | ||
| Asia-Pacific | China | |
| India | ||
| Japan | ||
| South Korea | ||
| Australia | ||
| New Zealand | ||
| Rest of Asia-Pacific | ||
| Middle East | Saudi Arabia | |
| United Arab Emirates | ||
| Turkey | ||
| Israel | ||
| Rest of Middle East | ||
| Africa | South Africa | |
| Nigeria | ||
| Egypt | ||
| Rest of Africa | ||


Key Questions Answered in the Report
What is the size of the OTT infrastructure market?
The OTT infrastructure market was valued at USD 16.31 billion in 2025 and is estimated at USD 18.67 billion in 2026. It is forecast to reach USD 34.35 billion by 2031, supported by greater use of IP video distribution, live streaming, cloud workflows, and edge processing. The OTT infrastructure market will require systems that handle high demand without reducing viewing quality.
What is driving demand for OTT infrastructure?
Higher video traffic, 4K delivery, live sports streaming, cloud migration, edge computing, and AI-based video operations are supporting demand. These requirements are increasing the need for reliable encoding, content delivery, origin storage, metadata, security, and monitoring systems.
Which component has the largest share of OTT infrastructure spending?
Software held 42.61% of spending in 2025 and is projected to grow fastest at a 13.75% CAGR through 2031. Video orchestration, encoding, DRM, analytics, and video management tools are central to this spending because they support cloud, edge, and on-premises operating models.
Why are hybrid and edge deployments gaining adoption?
They help operators meet low-latency requirements, support data localization, and reduce delivery costs through local processing and caching. Hybrid models allow a provider to use cloud capacity for flexible video workloads while keeping selected live, local, or regulated tasks closer to the audience.
Which end users are expanding spending most quickly?
E-learning and education is projected to grow at a 13.85% CAGR through 2031 as organizations use more video for training and knowledge management. Media and entertainment remained the largest end-user group in 2025 because streaming services, broadcasters, and sports rights holders require extensive video workflows.
What are the main operational challenges for streaming providers?
Egress and transcoding costs, device fragmentation, codec support, data-residency requirements, and power constraints at edge locations remain important challenges. Providers must maintain quality across varied devices and networks while controlling the added operational work created by multiple codecs and regional compliance rules.
Page last updated on:





