
OTT Entertainment Market Size and Share
Market Overview
| Study Period | 2020 - 2031 |
|---|---|
| Market Size (2026) | USD 92.41 Billion |
| Market Size (2031) | USD 119.49 Billion |
| Growth Rate (2026 - 2031) | 5.27 % |
| Fastest Growing Market | Asia-Pacific |
| Largest Market | North America |
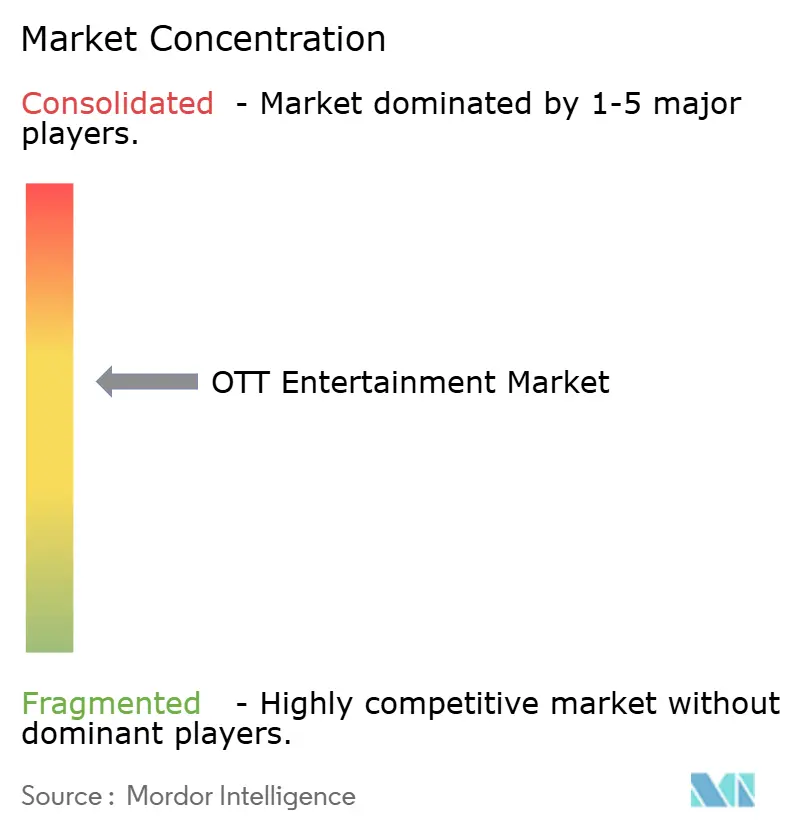
| Market Concentration | Medium |
Major Players *Disclaimer: Major Players sorted in no particular order Image © Mordor Intelligence. Reuse requires attribution under CC BY 4.0. | |
OTT Entertainment Market Analysis by Mordor Intelligence
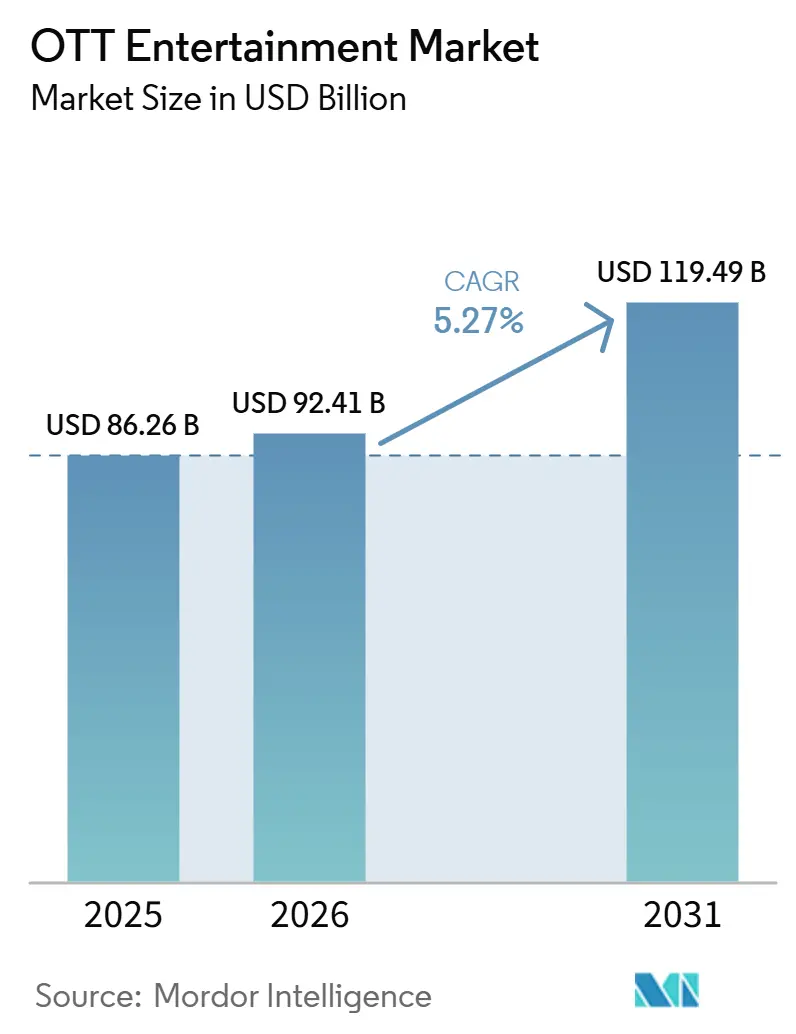
The OTT entertainment market size is projected to expand from USD 86.26 billion in 2025 and USD 92.41 billion in 2026 to USD 119.49 billion by 2031, registering a CAGR of 5.27% between 2026 to 2031. The OTT entertainment market is growing because viewers continue to move away from linear television and toward internet-based video that works across multiple screens and price points. Wider internet access, stronger home broadband, and the spread of connected devices are making the OTT entertainment market more reachable in both mature and developing economies. Ad-supported tiers and hybrid models are also widening the customer base, since platforms can serve users who want lower monthly spending without giving up premium content access. At the same time, the OTT entertainment market faces pressure from piracy, high content spending, and subscriber fatigue, which is pushing operators toward bundling, AI-led localization, and tighter control over content returns. Competition is becoming more scale driven, and platforms with deeper libraries, broader monetization models, and stronger distribution partnerships are better placed to defend margins and capture future demand.
Key Report Takeaways
- By device type, smartphones and tablets held 40.44% share in 2025, while smart TVs are projected to expand at a 5.65% CAGR through 2031.
- By monetization model, SVOD held 44.49% of the OTT entertainment market share in 2025, while AVOD is projected to expand at a 5.95% CAGR through 2031.
- By genre, drama accounted for 28.32% share in 2025, while action and adventure is projected to expand at a 6.70% CAGR through 2031.
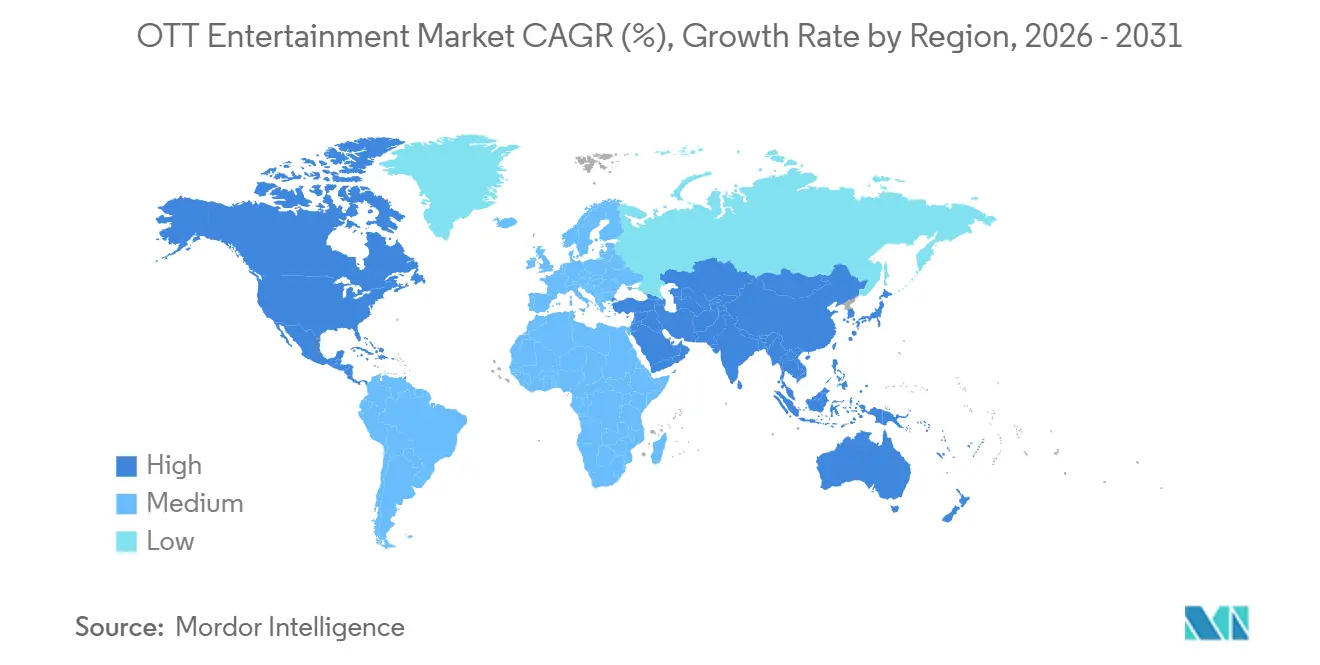
- By geography, North America accounted for 34.38% share of the OTT entertainment market size in 2025, while Asia-Pacific is projected to expand at a 5.80% CAGR through 2031.
Note: Market size and forecast figures in this report are generated using Mordor Intelligence’s proprietary estimation framework, updated with the latest available data and insights as of January 2026.
Market Trends and Insights
Drivers Impact Analysis of OTT Entertainment Market*
| Driver | (~) % Impact on CAGR Forecast | Geographic Relevance | Impact Timeline |
|---|---|---|---|
| Rising Internet Penetration and Fiber Availability | +1.4% | Global, with concentrated gains in Asia-Pacific, Africa, and South America | Medium term (2-4 years) |
| Proliferation of Smart TVs and Connected Devices | +1.1% | Global, strongest in North America, Europe, and core Asia-Pacific markets | Medium term (2-4 years) |
| AI-Enabled Localization and Dubbing at Scale | +0.8% | Global, with early gains in Asia-Pacific and South America | Short term (≤ 2 years) |
| Telco Bundling and Zero-Rating of OTT Data | +0.6% | Asia-Pacific and South America, with spillover into the Middle East and Africa | Medium term (2-4 years) |
| Live Sports, Event Streaming, and Interactive Viewing | +0.5% | North America, Europe, and India | Short term (≤ 2 years) |
| 5G-Enabled Low-Latency Streaming Experiences | +0.4% | North America, Europe, and East Asia | Long term (≥ 4 years) |
| Source: Mordor Intelligence | |||
Rising Internet Penetration and Fiber Availability
Broadband access remains the most basic growth condition for the OTT entertainment market because reliable connectivity determines how many people can stream regularly and how long they can stay engaged in each session. The International Telecommunication Union reported that mobile broadband represented 89% of global mobile subscriptions in 2025, which shows how deeply data-led access has become embedded in everyday media use across countries with very different income levels.[1]International Telecommunication Union, “ITU Facts and Figures 2025, Subscriptions,” ITU, itu.int The same institution also stated that around 6 billion people used the internet in 2025, which continued to widen the reachable audience for subscription, advertising, and hybrid video services. The Broadband Commission reported that 125 countries had national digital transformation strategies in place by 2025, which gives network expansion a firmer policy base and lowers entry friction for the OTT entertainment market in underpenetrated areas. As stronger fixed and mobile networks reach second-tier cities, viewing behavior shifts from short mobile sessions toward longer high-definition sessions, and that changes screen preference, content delivery demands, and platform economics at the same time.
Proliferation of Smart TVs and Connected Devices
Connected screens are changing how the OTT entertainment market is accessed, monetized, and discovered, because viewing is moving from personal handheld devices toward shared living room environments with richer ad inventory and stronger household engagement. CTAM reported that smart TVs were present in 83% of U.S. television households in 2026, which shows that the connected large screen is no longer a niche premium device in the most mature streaming market.[2]Cable and Telecommunications Association for Marketing, “Connected TVs and Streaming Apps,” CTAM, ctam.com CTAM also found that 61% of U.S. internet households used a smart TV as their primary streaming device, which supports the view that interface control and operating system placement now matter almost as much as content depth. This shift gives platforms an advantage when they secure operating system integration, pre-installation, or favored placement on home screens, because those arrangements can lower acquisition costs and increase repeat viewing without constant promotional spending. It also gives device makers more influence over discovery and advertising, which means the OTT entertainment market is increasingly shaped by hardware ecosystems as well as by studios and streaming brands.
AI-Enabled Localization and Dubbing at Scale
AI-led dubbing is becoming a practical growth tool for the OTT entertainment market because it reduces the cost and time needed to release the same title across many language groups. Verbit stated that AI dubbing can cut localization time by 80% or more compared with traditional studio workflows, which makes faster multilingual deployment commercially viable for broader content catalogs.[3]Verbit AI, “The Benefits of AI-Powered Dubbing and Content Localization,” Verbit, verbit.ai Deepdub launched its Agentic Dubbing Co-Worker in April 2026 and positioned it as a native part of the production workflow, which shows that localization tools are moving from isolated post-production tasks into daily operational use. Deepdub also introduced Phantom X 3.2 in March 2026 with studio-grade dubbing and ultra-low-latency voice capabilities, reinforcing the direction of travel toward faster and more scalable multilingual production pipelines. When platforms can localize catalogs more quickly and at lower cost, they gain deeper title breadth in non-English markets, improve recommendation quality through larger viewing data sets, and strengthen retention in markets where local language relevance matters as much as price.
Telco Bundling and Zero-Rating of OTT Data
Telecom bundling is helping the OTT entertainment market reach users who may not want a separate standalone subscription, especially in price-sensitive markets where monthly payment simplicity matters. Bharti Airtel announced in February 2025 that it would offer Apple TV+ and Apple Music to its Wi-Fi and postpaid customers in India, which showed how telecom billing relationships can be used to distribute premium video as part of a wider connectivity package. True Corporation launched its 5G Super Xtreme Entertainment package in Thailand in May 2025 and bundled Netflix, YouTube Premium, iQIYI, WeTV, and other apps into one plan, which highlighted the same model in Southeast Asia. These packages matter because they turn streaming into a service attached to a broader household or mobile relationship, and that tends to reduce churn relative to single-click direct subscriptions. Over time, telco-led packaging can also help the OTT entertainment market enter underpenetrated regions more efficiently by using existing distribution, billing, and customer service networks rather than building each of those layers from scratch.
Restraints Impact Analysis of OTT Entertainment Market*
| Restraint | (~) % Impact on CAGR Forecast | Geographic Relevance | Impact Timeline |
|---|---|---|---|
| Content Piracy and Unauthorized Redistribution | -1.2% | Global, most acute in South America, South Asia, and parts of Europe | Medium term (2-4 years) |
| Escalating Content Licensing and Production Costs | -0.9% | Global, most acute for mid-tier platforms in North America and Europe | Medium term (2-4 years) |
| Subscription Fatigue and Multi-Service Churn | -0.7% | North America, Western Europe, and mature Asia-Pacific markets | Short term (≤ 2 years) |
| Device and Codec Fragmentation Across Connected Screens | -0.4% | Global, most acute in emerging markets with fragmented device ecosystems | Long term (≥ 4 years) |
| Source: Mordor Intelligence | |||
Content Piracy and Unauthorized Redistribution
Piracy remains one of the clearest structural restraints on the OTT entertainment market because it weakens paid conversion, reduces expected returns on premium content, and makes local content investment harder to justify in high-leakage regions. A June 2025 study released by India’s Ministry of Information and Broadcasting with industry partners estimated that around 90 million users accessed pirated video content in 2024, causing USD 1.2 billion in lost revenue and representing around 10% of the country’s legal video sector revenue. CODA reported, in a survey commissioned by Japan’s Ministry of Economy, Trade and Industry, that losses from online piracy of Japanese digital content reached JPY 5.7 trillion, or USD 37.7 billion, in 2025. These figures show that piracy is not only a distribution problem, because it directly affects the willingness of platforms to keep funding local originals, smaller language catalogs, and long-tail content in exposed markets. When rights holders face weak monetization discipline, the OTT entertainment market often responds by concentrating spend into fewer global titles that travel well, even if that leaves local audiences with less culturally specific programming.
Escalating Content Licensing and Production Costs
Content spending is a major profitability constraint for the OTT entertainment market because premium sports, major franchises, and original programming all demand larger budgets while subscriber growth becomes harder to win in mature regions. Amazon confirmed an 11-year streaming agreement for NBA and WNBA rights, and that commitment illustrates how large platforms are using expensive live content to defend engagement and household value rather than relying only on scripted libraries. ESPN also announced a new rights agreement with Major League Baseball in November 2025, which reflects the ongoing intensity around premium sports inventory across digital and hybrid viewing channels. As more capital flows toward headline properties, smaller and mid-tier services have less room to maintain broad catalogs across drama, documentary, and niche genres without pressuring margins. The result is a market where scale matters more each year, because the OTT entertainment market increasingly rewards operators that can spread content costs across subscriptions, advertising, sports, and cross-platform partnerships.
*Our forecasts treat driver/restraint impacts as directional, not additive. The impact forecasts reflect baseline growth, mix effects, and variable interactions.
OTT Entertainment Market Segment Analysis
By Device Type:
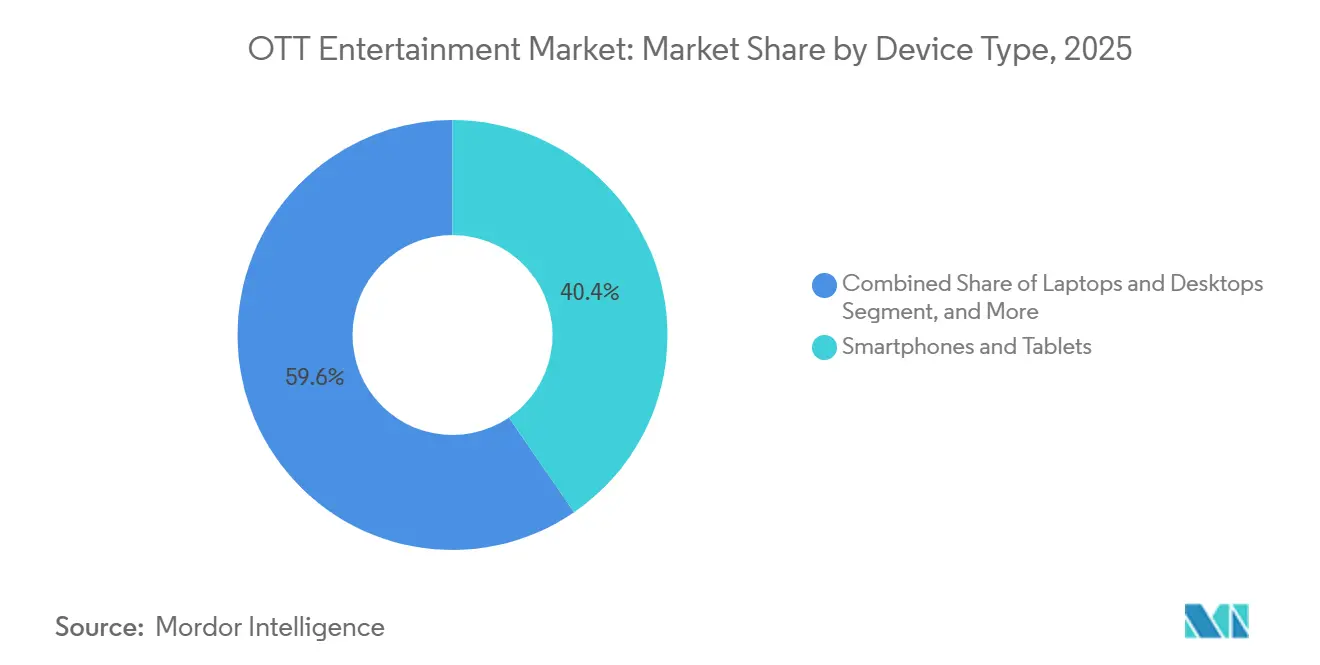
Smart TV Surge Challenges Smartphone PrimacySmartphones and tablets held 40.44% of the OTT entertainment market share in 2025, while smart TVs are projected to record the fastest growth at a 5.65% CAGR through 2031. That leadership still reflects mobile-first habits across developing markets in Asia-Pacific, South America, and Africa, where the smartphone often remains the most accessible screen for daily video use. The OTT entertainment market also benefited from the way mobile devices fit short viewing sessions, commuting patterns, and low-entry subscription behavior, especially when platforms design plans and interfaces for smaller screens from the start. Even so, the device mix is shifting as home broadband improves and viewers spend more time with connected large screens in the evening. That shift matters because the same title can deliver very different advertising value, interface control, and household reach depending on whether it is watched on a phone or on a smart TV.
CTAM stated that 61% of U.S. internet households used a smart TV as their primary streaming device, which shows how large-screen viewing is becoming the center of home streaming behavior in mature markets. As this behavior spreads, the OTT entertainment market is likely to see content discovery move closer to operating system ecosystems, manufacturer placement deals, and remote-control navigation rather than app-first search alone. Laptops and desktops still hold value as secondary screens for work-from-home and multitasking use, while gaming consoles and set-top boxes remain relevant where they serve as broader entertainment hubs. In the OTT entertainment industry, this device transition also changes data ownership, because hardware providers are gaining stronger audience insights that can compete with platform-level viewing data. Data privacy rules then shape how aggressively those insights can be monetized across regions, which adds another layer of strategic difference between device-led and platform-led distribution models.



By Monetization Model:
Ad-Supported Tiers Become the New Subscriber Acquisition StandardSVOD held 44.49% share in 2025, while AVOD is projected to expand at a 5.95% CAGR through 2031, which shows that the OTT entertainment market still relies on subscriptions for scale but is leaning more heavily on advertising to add the next wave of users. Pure subscription plans remain important because they support predictable recurring revenue, richer premium positioning, and stronger value perception for flagship content. TVOD still serves event-based spending, especially for major releases and premium live events, while hybrid and freemium structures are useful where price sensitivity limits full-price uptake. The monetization mix is therefore widening rather than moving in only one direction. That broader mix gives platforms more ways to match content value, household budgets, and viewing frequency across different customer groups.
The rise of ad-supported tiers is changing the economics of the OTT entertainment market because lower monthly entry points can bring in users who might otherwise avoid another paid service. This does not simply recreate the old television ad model, because ad value now depends more on algorithmic engagement, session length, and audience targeting across connected screens. That favors platforms that can keep viewers active over longer periods and across varied genres, not only those that can program around fixed time slots. It also gives operators a stronger reason to balance premium originals with dependable repeat-viewing libraries that generate stable ad impressions. In the OTT entertainment industry, the stronger role of AVOD also makes partnerships with telecom operators, smart TV ecosystems, and brand advertisers more central to long-term revenue design than they were during the earlier subscription-only phase.
By Genre:
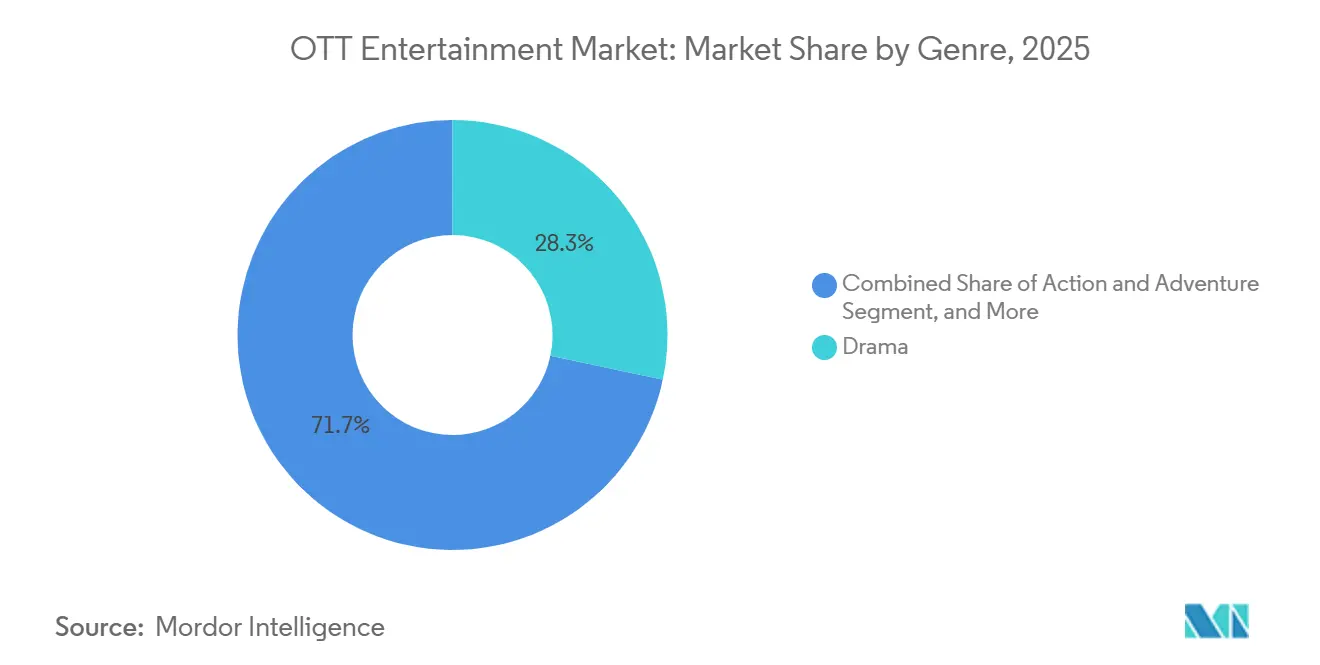
Drama Dominates Retention While Action Redefines Content EconomicsDrama accounted for 28.32% share in 2025, while action and adventure is projected to expand at a 6.70% CAGR through 2031, which captures the balance between stable retention content and faster-moving demand around event-led and franchise-driven viewing. Drama remains the anchor genre because serialized storytelling, recognizable casts, and multi-season arcs help platforms hold attention for longer periods and reduce cancellation risk after one title finishes. Comedy also keeps a meaningful role because it travels well, fills lighter viewing occasions, and can often be localized with less cost than dialogue-heavy prestige drama. Crime and thriller content remains dependable, especially where local productions build loyal followings and perform consistently on recommendation systems. Other genres such as documentary, animation, and reality programming still matter because they provide lower-cost catalog depth and help fill time-of-day viewing gaps outside headline premieres.
Action and adventure is growing faster because it aligns well with global franchise strategies, sports-adjacent storytelling, and high-impact visual formats that work across cultures. The OTT entertainment market is also seeing genre economics change as AI localization lowers barriers to distributing more titles across more languages. Verbit noted that AI dubbing can cut localization time by 80% or more, which supports faster international rollouts for visually driven formats that depend less on dense dialogue. Deepdub’s 2026 product releases point in the same direction, since they push localization closer to real-time production support and wider catalog deployment. As these tools mature, action-led titles may gain an even stronger distribution advantage because they can be repurposed across regions more efficiently than genres that rely heavily on culturally specific dialogue patterns.
Geography Analysis
North America OTT Entertainment Market
North America held 34.38% share in 2025, which kept it as the largest regional base in the OTT entertainment market because broadband access, paid streaming familiarity, and high household subscription depth remain firmly established. The region also benefits from a large concentration of global platforms, premium content spending, and strong advertiser interest in connected television environments. Smart TV adoption adds to that advantage, since CTAM reported that smart TVs were present in 83% of U.S. television households in 2026 and had become the default streaming interface for many homes. As a result, performance in North America is increasingly judged by revenue depth, viewing quality, and monetization mix rather than by subscriber totals alone.
APAC OTT Entertainment Market
Asia-Pacific is projected to expand at a 5.80% CAGR through 2031, making it the fastest-growing region in the OTT entertainment market and the clearest long-term expansion zone for both global and domestic platforms. The region combines very large mobile-first user bases with rising broadband quality, increasing smart TV adoption, and strong demand for local language content. India stands out because cricket rights, telecom bundles, and a deep domestic platform field are all supporting wider streaming use across price tiers. China remains important, but its next phase depends more on monetization mix and advertising-led models than on simple urban subscription expansion. Across the region, the OTT entertainment market gains from partnerships that lower payment friction, and the Airtel and True Corporation examples show how telecom distribution can speed adoption in large and price-sensitive user bases.
EMEA and South America OTT Entertainment Market
Europe, South America, the Middle East, and Africa each add a different source of demand to the OTT entertainment market, with Europe shaped by regulation and original content funding, South America led by mobile-first use and sports viewing, and the Middle East and Africa supported by regional platforms and telecom-led access. The European Audiovisual Observatory valued Europe’s audiovisual market at EUR 142 billion, or USD 153.6 billion, in 2024, while the share of European original content spending coming from global streaming platforms rose from 8% in 2019 to 24% in 2024. VAUNET reported that German TV, video streaming, and audio media advertising revenues were projected to rise 4.3% to EUR 6.55 billion, or USD 7.08 billion, in 2026, which supports the case for further ad-led streaming development in Europe. In South America, the Middle East, and Africa, the OTT entertainment market still has substantial room to deepen engagement as streaming rights, local content, and bundled data access continue to improve.

Competitive Landscape
The OTT entertainment market has a two-layer structure, with a limited group of global platforms competing through library depth, cross-border reach, and multi-model monetization, while regional and niche operators compete through local content, language fit, or specific rights. This structure makes scale valuable, but it does not remove the role of regional strength, especially in markets where domestic tastes, sports rights, or price architecture differ sharply from North American norms. The OTT entertainment market is therefore consolidating around a few large leaders at the top while still leaving meaningful space for focused specialists below them. The main strategic question is no longer only who can add subscribers fastest, but who can keep viewing time, protect margins, and spread content costs most effectively across several revenue streams.
Large platform combinations and takeover activity in 2025 and 2026 showed how important scale had become. Netflix and Warner Bros. Discovery announced a definitive agreement in December 2025 with a total enterprise value of USD 82.7 billion, and they amended the agreement to an all-cash transaction in January 2026, underscoring the premium attached to large content libraries and established streaming infrastructure. The OTT entertainment market is also being shaped by sports-rights accumulation, since Amazon confirmed an 11-year deal for NBA and WNBA streaming, giving Prime Video another major retention lever alongside its broader ecosystem value. That pattern shows that premium live rights are being used less as isolated profit centers and more as tools that protect the wider platform relationship. It also raises entry barriers for smaller services that cannot match this level of recurring rights investment.
Another clear strategy pattern is distribution-led bundling and operational efficiency. Airtel’s Apple partnership in India and True Corporation’s bundled entertainment package in Thailand both show how telecom operators can lower payment friction, widen reach, and make streaming part of an everyday utility-style plan rather than a separate household decision. AI localization is the third major competitive move, because vendors like Deepdub are turning multilingual rollout into a faster and more scalable operating capability for platforms with large international catalogs. Operators that combine those three levers, content scale, distribution partnerships, and localization efficiency, are more likely to extend their lead in the OTT entertainment market than services that rely on only one of them.
OTT Entertainment Industry Leaders
Netflix Inc.
Amazon.com, Inc.
Alphabet Inc.
The Walt Disney Company
Warner Bros. Discovery, Inc.
- *Disclaimer: Major Players sorted in no particular order
OTT Entertainment Market Companies Covered in this Report
- Netflix Inc.
- Amazon.com, Inc.
- Alphabet Inc.
- The Walt Disney Company
- Warner Bros. Discovery, Inc.
- Tencent Holdings Limited
- Apple Inc.
- Roku, Inc.
- iQIYI, Inc.
- DAZN Group Limited
- PCCW Limited
- JioStar India Private Limited
- Zee Entertainment Enterprises Limited
- Comcast Corporation
- Telefónica, S.A.
- EchoStar Corporation
- Paramount, a Skydance Corporation
- Fox Corporation
- Sony Group Corporation
- MBC Group

Recent Industry Developments in OTT Entertainment Market
- July 2026: South Korea's Ministry of Science and ICT announced the expansion of its AI dubbing program for Samsung and LG FAST platforms, with AI-localized K-FAST channels having drawn approximately 100 million cumulative viewers across 22 countries in five months, with the Global K-FAST Alliance growing from 22 to 82 participants.
- July 2026: Zee Entertainment Enterprises Ltd. secured exclusive television and digital media rights for Germany's Bundesliga in India for five seasons beginning with the 2026-27 season, with matches to be streamed on Zee5 and broadcast on its Unite8 Sports channels, following an earlier FIFA partnership.
- June 2026: Studio Freewillusion Inc. unveiled performance results for TailorDub, its AI-powered automatic dubbing technology, which demonstrated approximately a 48% advantage over a competing global AI dubbing SaaS platform in speech-pacing stability, based on an independent panel evaluation of 50 professional AI video creators.
- April 2026: Deepdub launched the industry's first Agentic Dubbing Co-Worker, embedded natively into its Hollywood-vetted dubbing and localization workflow, enabling real-time human-AI collaboration across enterprise-scale content localization pipelines at major streaming studios.


Global OTT Entertainment Market Report Scope
The Global OTT (Over-the-Top) Entertainment Market comprises digital platforms and services that deliver entertainment content, including movies, television shows, web series, live streaming events, sports, music, and other video and audio content, directly to consumers via the internet without requiring traditional cable, satellite, or broadcast television distribution.
The OTT Entertainment Market Report is Segmented by Device Type (Smartphones and Tablets, Smart TVs, Laptops and Desktops, and Other Device Types), Monetization Model (SVOD, AVOD, TVOD, Hybrid, and Freemium), Genre (Drama, Comedy, Action and Adventure, Crime and Thriller, and Other Genre), and Geography (North America, South America, Europe, Asia-Pacific, Middle East, and Africa). The Market Forecasts are Provided in Terms of Value (USD).
| Smartphones and Tablets |
| Smart TVs |
| Laptops and Desktops |
| Other Device Types |
| SVOD |
| AVOD |
| TVOD |
| Hybrid |
| Freemium |
| Drama |
| Comedy |
| Action and Adventure |
| Crime and Thriller |
| Other Genre |
| North America | United States |
| Canada | |
| Mexico | |
| South America | Brazil |
| Argentina | |
| Chile | |
| Rest of South America | |
| Europe | Germany |
| United Kingdom | |
| France | |
| Italy | |
| Spain | |
| Rest of Europe | |
| Asia-Pacific | China |
| Japan | |
| India | |
| South Korea | |
| Australia | |
| Rest of Asia-Pacific | |
| Middle East | Saudi Arabia |
| United Arab Emirates | |
| Qatar | |
| Rest of Middle East | |
| Africa | South Africa |
| Egypt | |
| Nigeria | |
| Rest of Africa |
| By Device Type | Smartphones and Tablets | |
| Smart TVs | ||
| Laptops and Desktops | ||
| Other Device Types | ||
| By Monetization Model | SVOD | |
| AVOD | ||
| TVOD | ||
| Hybrid | ||
| Freemium | ||
| By Genre | Drama | |
| Comedy | ||
| Action and Adventure | ||
| Crime and Thriller | ||
| Other Genre | ||
| By Geography | North America | United States |
| Canada | ||
| Mexico | ||
| South America | Brazil | |
| Argentina | ||
| Chile | ||
| Rest of South America | ||
| Europe | Germany | |
| United Kingdom | ||
| France | ||
| Italy | ||
| Spain | ||
| Rest of Europe | ||
| Asia-Pacific | China | |
| Japan | ||
| India | ||
| South Korea | ||
| Australia | ||
| Rest of Asia-Pacific | ||
| Middle East | Saudi Arabia | |
| United Arab Emirates | ||
| Qatar | ||
| Rest of Middle East | ||
| Africa | South Africa | |
| Egypt | ||
| Nigeria | ||
| Rest of Africa | ||


Key Questions Answered in the Report
What is the current and forecast value of OTT entertainment worldwide?
The OTT entertainment market was valued at USD 86.26 billion in 2025, stood at USD 92.41 billion in 2026, and is projected to reach USD 119.49 billion by 2031 at a 5.27% CAGR.
Which device category leads viewing today?
Smartphones and tablets led with 40.44% share in 2025, reflecting mobile-first behavior in many developing economies and strong everyday usage across short viewing sessions.
Which device category is growing the fastest through 2031?
Smart TVs are projected to grow at a 5.65% CAGR through 2031 as broadband quality improves and large-screen streaming becomes more central to household viewing.
Why are ad-supported plans becoming more important for streaming platforms?
AVOD is projected to grow at a 5.95% CAGR through 2031 because lower entry prices help platforms add users while keeping premium content accessible across wider income groups.
Which content genre is the biggest and which is expanding the fastest?
Drama led with 28.32% share in 2025 because it supports long viewing cycles and retention, while action and adventure is forecast to grow fastest at a 6.70% CAGR through 2031.
Which region offers the strongest growth opportunity over the forecast period?
Asia-Pacific is projected to grow at a 5.80% CAGR through 2031, supported by large mobile user bases, improving broadband, stronger local language demand, and active telecom bundling.
Page last updated on:





