
OTT Advertising Market Size and Share
Market Overview
| Study Period | 2020 - 2031 |
|---|---|
| Market Size (2026) | USD 136.42 Billion |
| Market Size (2031) | USD 213.78 Billion |
| Growth Rate (2026 - 2031) | 9.40 % |
| Fastest Growing Market | Asia-Pacific |
| Largest Market | North America |
| Market Concentration | Medium |
Major Players *Disclaimer: Major Players sorted in no particular order Image © Mordor Intelligence. Reuse requires attribution under CC BY 4.0. | |
OTT Advertising Market Analysis by Mordor Intelligence
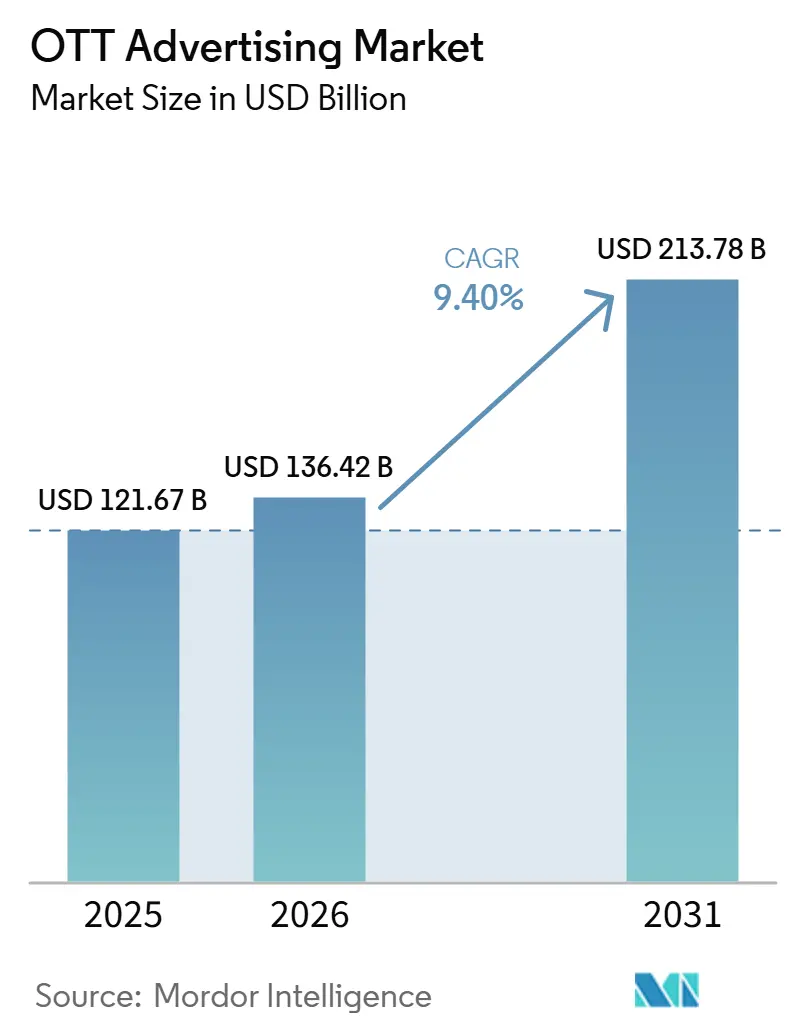
The OTT advertising market size is projected to expand from USD 121.67 billion in 2025 and USD 136.42 billion in 2026 to USD 213.78 billion by 2031, registering a CAGR of 9.40% between 2026 and 2031. The OTT advertising market is growing as linear television budgets continue to shift to streaming, and that shift is changing how agencies plan, buy, and measure video campaigns. Ad-supported streaming tiers, FAST services, and broader programmatic workflows are increasing the amount of monetizable inventory while also making campaign execution more flexible for advertisers. North America remains the most established revenue base, while Asia-Pacific continues to draw attention as mobile-first viewing habits expand advertiser reach in high-volume streaming markets. The OTT advertising market is also being reshaped by platform concentration, since companies with operating system scale and authenticated audience data can capture more value across targeting, pricing, and supply access. Measurement gaps across devices and tighter privacy rules still limit full budget acceleration, but the strongest opportunity now lies in linking streaming exposure to business outcomes through retail media data, clean-room collaboration, and more automated buying tools.
Key Report Takeaways
- By ad placement, mid-roll ads held 43.12% of the OTT advertising market share in 2025, while pre-roll ads are projected to expand at a 9.92% CAGR through 2031.
- By ad format, video ads led with a 66.54% share in 2025, while the over-the-top (OTT) advertising market size for interactive ads is projected to expand at a 10.54% CAGR through 2031.
- By platform type, smart TVs held 51.29% share in 2025, while smartphones and tablets are projected to grow at a 10.43% CAGR through 2031.
- By end user, media and entertainment held 38.43% share in 2025, while the OTT advertising market size for retail and e-commerce is projected to expand at a 10.78% CAGR through 2031.
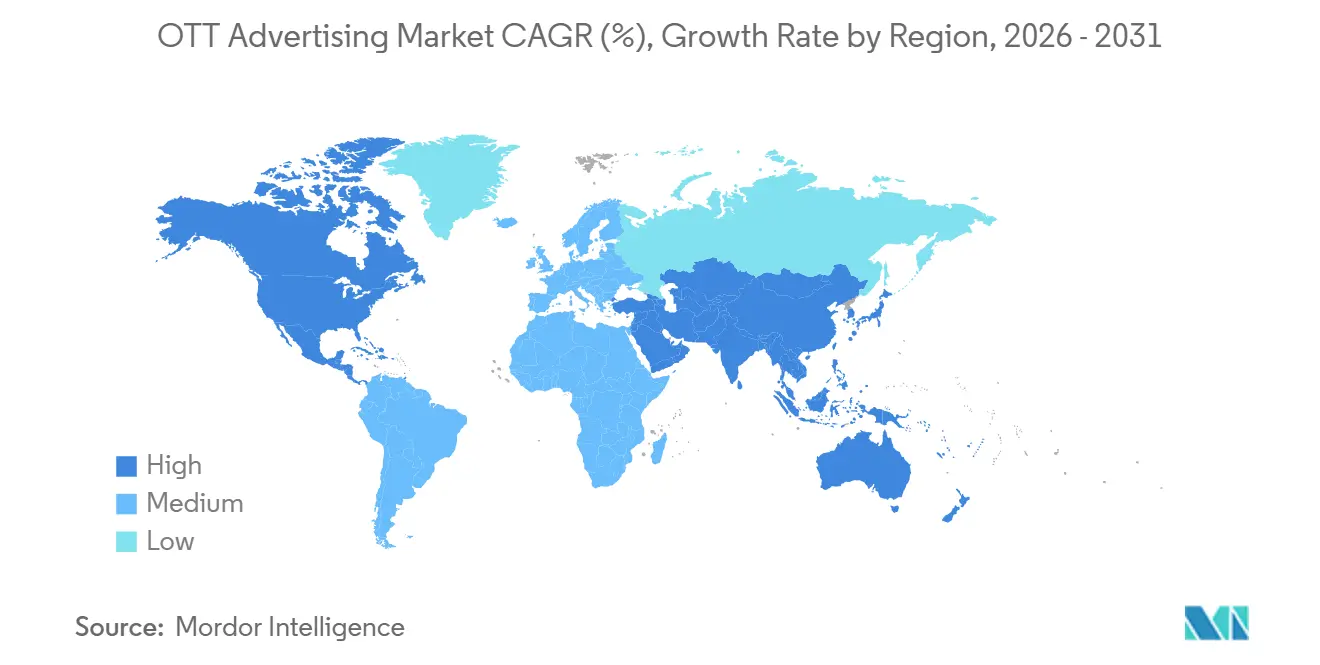
- By geography, North America held 41.09% of the OTT advertising market share in 2025, while Asia-Pacific is projected to expand at a 10.37% CAGR through 2031.
Note: Market size and forecast figures in this report are generated using Mordor Intelligence’s proprietary estimation framework, updated with the latest available data and insights as of January 2026.
Market Trends and Insights
Drivers Impact Analysis of OTT Advertising Market*
| Driver | (~) % Impact on CAGR Forecast | Geographic Relevance | Impact Timeline |
|---|---|---|---|
| Rising Shift From Linear TV to Streaming Ad Budgets | +2.5% | Global, concentrated in North America and Europe | Short term (≤ 2 years) |
| Expansion of Ad-Supported Streaming Tiers and FAST Inventory | +1.8% | North America and Asia-Pacific core, spill-over to South America | Short term (≤ 2 years) |
| Programmatic Buying and Real-Time Bidding Adoption | +1.5% | Global, most mature in North America | Medium term (2-4 years) |
| Better First-Party Audience Targeting and Measurement | +1.2% | North America and Europe, spill-over to Asia-Pacific | Medium term (2-4 years) |
| Retail Media and Commerce Data Collaboration in OTT Campaigns | +0.8% | North America, with early gains in South Korea, India, and Australia | Long term (≥ 4 years) |
| Cross-Screen Frequency Management Across OTT, CTV, and Mobile | +0.6% | North America and Europe, with expanding coverage in Asia-Pacific markets | Long term (≥ 4 years) |
| Source: Mordor Intelligence | |||
Rising Shift from Linear TV to Streaming Ad Budgets
Budget migration from linear television to streaming has reset video planning priorities across the OTT advertising market. Premion and Advertiser Perceptions found that 70% of CTV and OTT advertisers planned to increase streaming spend by an average of 17% in 2026, indicating the shift is no longer experimental for major buyers.[1]Premion, “New Survey Reveals That More Than 70% of CTV Advertisers Will Increase Spending by an Average of 17% in 2026,” Premion, premion.com The same survey showed that 28% of the planned increase was expected to come from broadcast linear TV and 24% from cable or satellite budgets, confirming that streaming is taking spend from legacy television pools rather than attracting only new money. Hybrid planning teams now control 55% of CTV budgets, so the old operational split between linear and digital buying is narrowing inside agencies and brand teams. That shift is shortening the path from upfront planning to programmatic execution, giving platforms that already control premium streaming supply greater leverage. In practical terms, the OTT advertising market is moving toward a planning model in which streaming is treated as the central video channel, while linear television is increasingly managed as a declining complement.
Expansion of Ad-Supported Streaming Tiers and FAST Inventory
Ad-supported tiers and FAST services are widening the amount of sellable inventory available across the OTT advertising market. Xumo expanded direct access to its premium streaming inventory through The Trade Desk's OpenPath framework in January 2026, which shows how ad-supported streaming platforms are opening more supply through direct programmatic routes. Roku introduced Roku Curate in April 2026 to connect its first-party audience insights with partner purchase data, signaling that ad-supported environments are now built around measurable outcomes rather than simple impression scale. Disney Advertising extended shoppable and actionable ad capabilities in June 2025, linking retailer datasets to streaming exposures and making ad-supported viewing more useful for commerce-led campaigns. Platforms are also refining ad experiences rather than just raising ad loads, because inventory expansion only supports growth if viewer engagement remains stable. This creates space for buyers to reach more viewers in ad-supported streaming environments while still maintaining campaign quality and attribution standards closer to those of premium television.
Programmatic Buying and Real-Time Bidding Adoption
Programmatic execution is gaining structural importance in the OTT advertising market because buyers want faster access to premium supply and better control over campaign pacing. Premion and Advertiser Perceptions reported that 50% of CTV and OTT advertising is expected to be purchased programmatically in 2026, which places automated buying at the center of future streaming transactions. Xumo's January 2026 OpenPath connection through FreeWheel showed that publishers are also trying to shorten supply paths and give buyers more direct access to premium inventory. Magnite's June 2026 launch of Magnite Orchestration added a coordination layer that lets buyer agents connect directly with their seller agent, reflecting a broader push to reduce manual work in campaign execution. These changes matter because programmatic growth is no longer limited to remnant inventory and is increasingly tied to premium connected television environments. As a result, the over-the-top (OTT) advertising market is moving toward a model in which software-driven deal execution is a competitive requirement rather than a side capability.
Better First-Party Audience Targeting and Measurement
First-party audience data is becoming a more decisive advantage in the OTT advertising market as privacy rules narrow the value of open behavioral targeting. Comcast Advertising launched Outcomes+ in March 2026 with deterministic data from more than 30 million Comcast households and more than 100 million authenticated viewers, while extending reach to more than 300 million viewers through partner platforms. Roku Curate followed in April 2026 by combining Roku audience intelligence with purchase behavior data from launch partners, which shows that the market is tying exposure data more directly to downstream sales measurement. Google also requires GDPR-compliant consent handling for personalized ads inventory in the EEA and UK, which reinforces the need for authenticated first-party environments in Europe. This favors companies that own login relationships and stable household identifiers, because they can offer targeting and attribution with fewer identity gaps. Over time, the OTT advertising market is likely to reward platforms that can combine premium content, authenticated audiences, and auditable measurement within a single operating environment.
Restraints Impact Analysis of OTT Advertising Market*
| Restraint | (~) % Impact on CAGR Forecast | Geographic Relevance | Impact Timeline |
|---|---|---|---|
| Fragmented Measurement Across Devices and Publishers | -1.4% | Global, most acute in North America and Europe | Short term (≤ 2 years) |
| Limited Inventory Transparency in Premium OTT Environments | -1.0% | North America and Europe, with emerging concerns in Asia-Pacific | Medium term (2-4 years) |
| Privacy and Consent Constraints on Audience Targeting | -0.8% | Europe, UK, with expanding US state-level regulatory exposure | Long term (≥ 4 years) |
| Ad Load Sensitivity and Viewer Churn Risk | -0.6% | North America, South Korea, Australia, markets with high SVOD saturation | Medium term (2-4 years) |
| Source: Mordor Intelligence | |||
Fragmented Measurement Across Devices and Publishers
Measurement fragmentation remains one of the clearest barriers to faster expansion in the OTT advertising market, as advertisers still struggle to compare performance across platforms with distinct identities and reporting systems. CIMM and the 4As reported in March 2026 that advertisers have access to more data and analytics tools than before, yet confidence in measurement accuracy still lags because teams must reconcile competing versions of campaign truth.[4]CIMM and 4As, “CIMM and 4As Study Finds Advertisers Face a Paradox of Plenty in Measurement as Confidence Lags Behind Capability,” CIMM, cimm-us.org The problem is not only technical, because major streaming platforms also have commercial reasons to keep audience and performance data inside proprietary environments. That makes frequency control, deduplicated reach, and cross-platform attribution harder to defend to finance and procurement teams. Google's consent rules for personalized advertising in the EEA and UK add another layer of variation across markets, since identity quality can change based on local permission signals. Until reporting standards become more comparable, the OTT advertising market will continue to carry friction that slows budget reallocation from channels where measurement practices are better understood.
Limited Inventory Transparency in Premium OTT Environments
Limited transparency into premium OTT inventory continues to constrain buyer confidence, especially when advertisers cannot fully verify placement quality, fee structures, or content context before committing to spend. This issue is more visible in large campaigns where several intermediaries can sit between the advertiser and the final publisher, making it harder to determine how much working media value reaches the screen. That encourages buyers to favor direct or more controlled supply paths, even when those routes reduce the breadth of available inventory. Xumo's OpenPath integration and Magnite's coordination layer both reflect the demand for clearer, shorter execution chains in premium streaming environments. The risk for the OTT advertising market is a two-track system; for instance, fully verified inventory attracts premium budgets, while less transparent supply remains dependent on price-led demand. Unless publishers, SSPs, and buyers align on more auditable transaction standards, transparency concerns will continue to pressure spending efficiency and trust.
*Our forecasts treat driver/restraint impacts as directional, not additive. The impact forecasts reflect baseline growth, mix effects, and variable interactions.
OTT Advertising Market Segment Analysis
By Ad Placement:
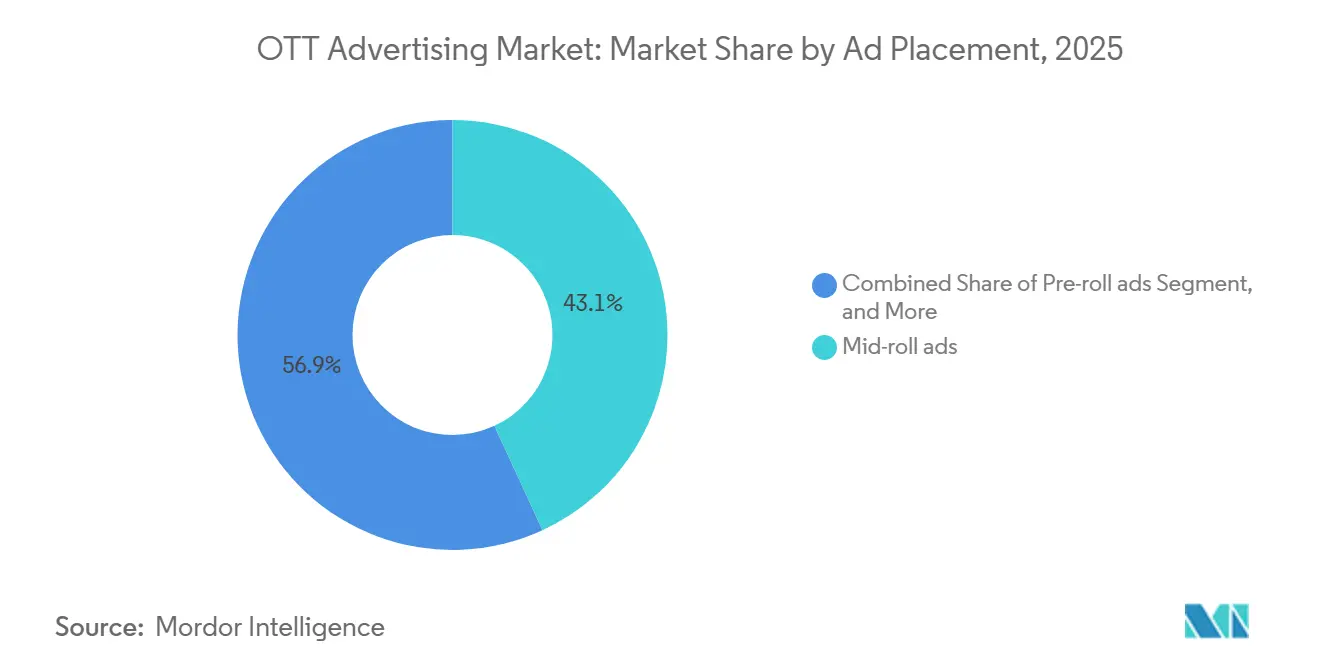
Mid-Roll Formats Drive Premium Revenue, Pre-Roll Leads GrowthMid-roll ads held 43.12% of the OTT advertising market share in 2025, which kept them at the center of premium streaming monetization. Their lead came from placement context, because ads shown during active viewing moments usually attract stronger attention and command better pricing power than inventory placed before or after the content. Buyers also continue to view mid-roll as a closer substitute for traditional television commercial breaks, which is helpful as linear budgets are redirected into streaming. Pre-roll ads are the fastest-growing placement type and are projected to expand at a 9.92% CAGR from 2026 to 2031. Post-roll ads remain the smallest part of the mix because they depend on viewers staying with the service after content ends, which narrows scale for many campaigns.
The placement mix in the OTT advertising market is also changing because publishers are managing ad break structures more carefully to protect completion rates and reduce viewer irritation. Pre-roll is benefiting from lower playback friction and better ad delivery workflows, which makes the format more acceptable for performance-led campaigns that need consistent starts. Mid-roll still holds the strongest revenue position because it sits inside the highest-value viewing window and supports premium pricing without requiring oversized ad pods. Post-roll remains useful for lower-disruption campaigns and direct-response activity, but it does not match the scale or pricing of mid-stream inventory. In Europe, placement-level targeting is also shaped by consent rules for personalized ad delivery, which can narrow the addressable scale for both pre-roll and mid-roll impressions.



By Ad Format:
Video Ads Dominate, Interactive Formats Accelerate Commerce IntegrationVideo ads accounted for 66.54% of the ad format mix in 2025, reflecting that streaming environments are still built around long- and short-form video viewing rather than static display experiences. The format remains dominant because most brand advertisers already have television-ready creative assets, which lowers the operational friction of moving budgets from linear channels to streaming. Interactive ads are projected to expand at a 10.54% CAGR from 2026 to 2031, indicating that the OTT advertising market is moving beyond passive exposure toward measurable engagement. Display formats, including overlays, companion units, and pause-based placements, remain relevant because they add incremental impressions without always interrupting the viewing session. The overall mix now points to a market where advertisers want both reach and action, rather than treating those goals as separate media plans.
That shift is becoming clearer as commerce functionality moves into premium streaming environments. Disney Advertising expanded its shoppable and actionable ad capabilities in June 2025 by connecting retailer datasets from Kroger Precision Marketing and Walmart Connect to CTV ad exposures. This gives interactive units a stronger role in campaign planning, because advertisers can connect video exposure with product discovery and transaction intent more directly. Display formats benefit from the same trend when they support lightweight calls to action inside the viewing session. Even so, video remains the anchor of the OTT advertising industry because it aligns with viewer expectations, fits premium content environments, and still enjoys the broadest acceptance among buyers and publishers.
By Platform Type:
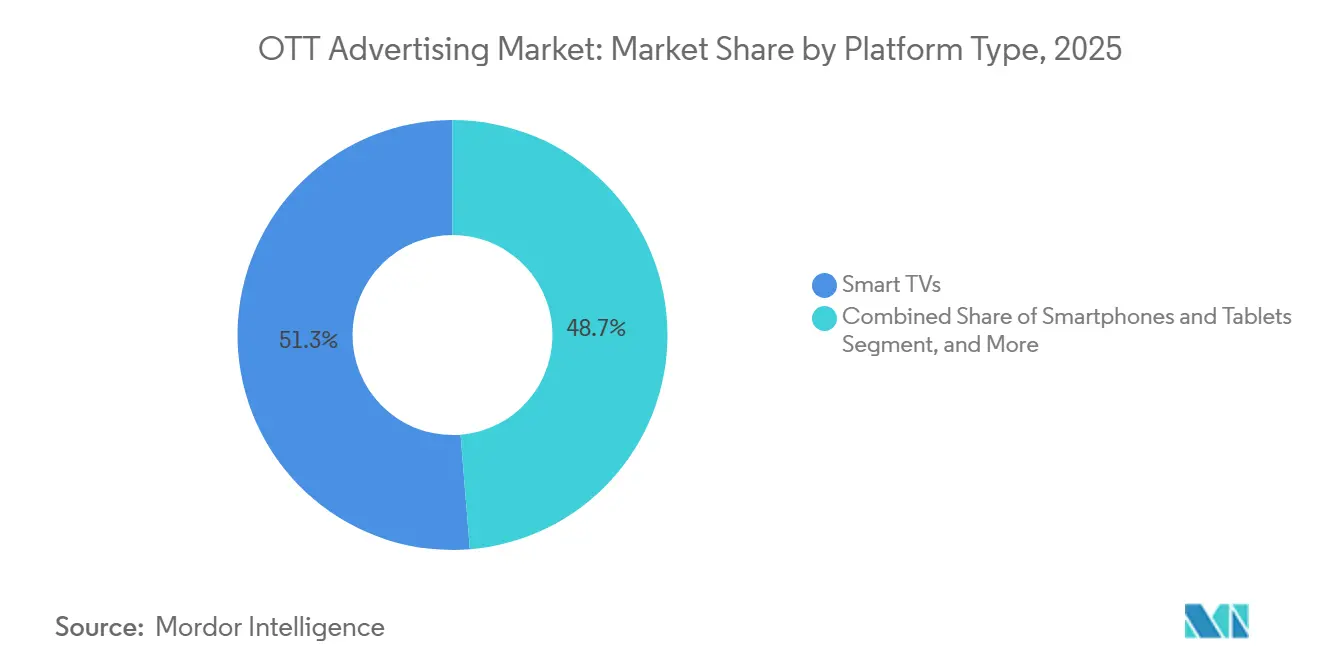
Smart TVs Anchor Scale, Mobile Devices Power Emerging Market GrowthSmart TVs accounted for 51.29% of the platform type segment in 2025, confirming that the living-room screen remains the primary surface for premium streaming ad delivery. This matters because smart TV inventory often aligns with household viewing, larger screens, and content settings that resemble traditional television. In the OTT advertising market, that makes smart TVs are especially attractive for brand campaigns that want reach, strong visibility, and better suitability for premium programming. Smartphones and tablets are the fastest-growing platform group, projected to expand at a 10.43% CAGR from 2026 to 2031. Laptops and desktops hold a smaller role because casual viewing continues to shift toward mobile devices and connected televisions.
Platform performance varies by region, which is why device mix is becoming a strategic issue rather than a simple delivery setting in the over-the-top (OTT) advertising market. Mobile-led viewing supports growth in high-volume markets where streaming adoption is rising faster than household television upgrades, creating a different ad environment with shorter viewing windows and lower pricing. Smart TVs, by contrast, remain the premium center of monetization because they support longer sessions and stronger brand-safe positioning. Buyers also have to manage operating system fragmentation across connected devices, which can complicate targeting and measurement when data access differs by platform owner. Device-level consent handling adds another layer of complexity to European campaigns, as personalized ad delivery must align with GDPR controls across all supported screens.
By End User:
Media and Entertainment Retains Lead, Retail and E-Commerce Drives ForwardMedia and entertainment accounted for 38.43% of the end-user segment in 2025, making it the largest spending vertical in the OTT advertising market. That position reflects the importance of sports rights, premium programming launches, and cross-promotion within streaming ecosystems, where content businesses advertise to support their own audience growth. Retail and e-commerce are the fastest-growing end-user segments, projected to expand at a 10.78% CAGR from 2026 to 2031. The category is gaining ground because commerce data is increasingly integrated with streaming exposure, making premium video inventory more useful for conversion-focused planning. Other verticals, including healthcare, financial services, travel and hospitality, and broader service categories, are also expanding their use of streaming to reach engaged viewers in more controlled media environments.
The vertical mix is becoming more performance-oriented as buyers look for clearer links between impression delivery and business outcomes. IAB reported that US retail digital video ad spend is estimated at USD 9.4 billion in 2026, up 14% year over year, which supports the strong momentum in retail and commerce demand for streaming video channels. The same report showed healthcare and pharmaceutical digital video spend growing 16% year over year in 2026, while automotive was projected to decline by 2%, which highlights how category momentum is diverging across the OTT advertising market. Financial services and travel remain relevant because these advertisers value premium, opt-in viewing environments that can support upper-funnel reach and mid-funnel consideration. Over time, end-user demand is likely to favor publishers and platforms that can combine quality inventory with retailer data, deterministic targeting, and reliable outcome measurement.
Geography Analysis
North America OTT Advertising Market
North America held 41.09% of the OTT advertising market share in 2025, making it the largest regional revenue base. The region remains the most mature environment for streaming advertising, with premium inventory, programmatic infrastructure, and authenticated audience data already established at scale. IAB reported that US CTV ad spend reached USD 26.5 billion in 2025 and is estimated at USD 29.3 billion in 2026, indicating continued momentum in the region's largest national market.[3]Interactive Advertising Bureau, “2026 IAB Digital Video Ad Spend and Strategy Report, Part One,” IAB, iab.com North America also benefits from the concentration of major platform operators, including Amazon, Roku, Netflix, and Disney, which strengthens access to high-quality supply and first-party data. At the same time, privacy controls such as Global Privacy Control recognition and broader data governance standards are making audience activation more dependent on compliant identity infrastructure.
APAC OTT Advertising Market
Asia-Pacific is the fastest-growing geography, projected to expand at a 10.37% CAGR from 2026 to 2031. The region combines very large streaming audiences with uneven monetization, so volume growth does not always translate into North America-level pricing. Mobile-first viewing habits remain a major feature across several Asia-Pacific markets, pushing advertisers to adapt campaign formats, pod lengths, and measurement expectations to smaller screens and lower CPMs. India and Southeast Asia continue to matter because ad-supported video consumption is expanding at scale and supports a broader base of reachable viewers than subscription-led models alone. Japan and South Korea remain important because premium content, advanced device adoption, and advertiser sophistication support stronger monetization than many other markets in the region.
EMEA and South America OTT Advertising Market
Europe remains a meaningful revenue block for the over-the-top (OTT) advertising market, but growth is moderated by stricter consent standards and more limited flexibility around behavioral targeting. Google requires GDPR-compliant consent handling for personalized inventory in the EEA and UK, which reinforces the shift toward contextual approaches, first-party activation, and cleaner audience collaboration frameworks. South America is showing stronger momentum as connected television adoption, ad-supported streaming, and broader digital video habits continue to deepen across major markets. The Middle East and Africa remain earlier-stage regions, with Saudi Arabia, the UAE, and South Africa standing out because infrastructure quality, smartphone usage, and advertiser sophistication are higher than in many neighboring markets.

Competitive Landscape
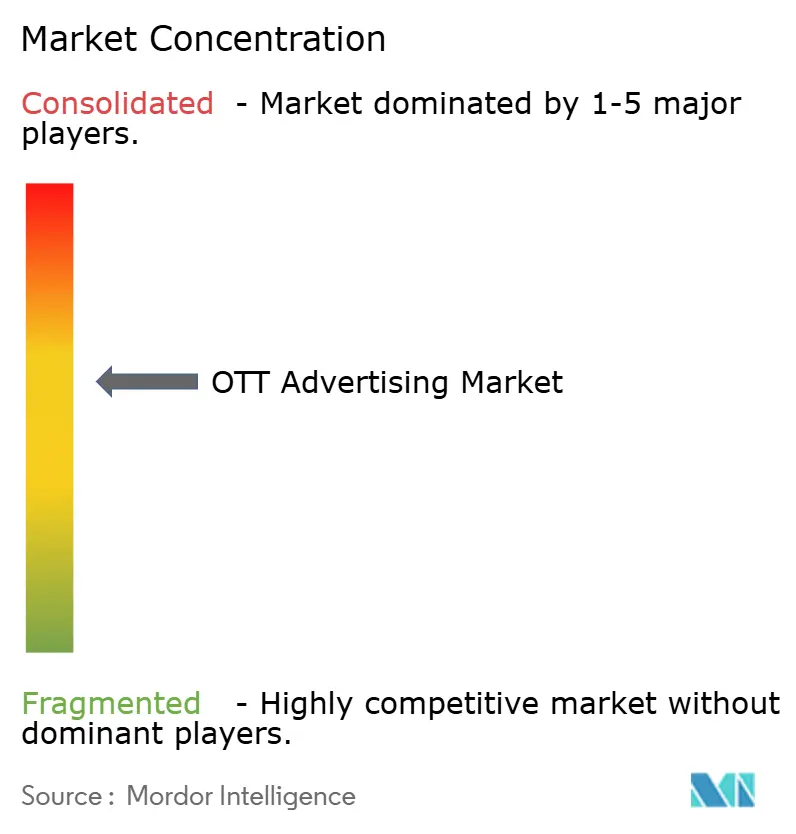
The OTT advertising market is moderately concentrated at the platform and data layer, where Alphabet, Amazon, and Roku hold structural advantages through audience scale, device reach, and advertising infrastructure. That advantage matters because platforms that control both access points and user data can capture more value from targeting, pricing, and supply management. Even so, the broader execution layer remains fragmented, with SSPs, DSPs, identity providers, and measurement specialists still competing for budget share and operational relevance. This creates a market where scale helps at the top, but execution quality and interoperability still matter across the middle of the value chain.
Strategic moves in 2026 indicate that major participants are addressing buyer pain points while also strengthening their positions in the OTT advertising market. Comcast Advertising launched Outcomes+ in March 2026 to extend deterministic targeting and attribution from more than 30 million Comcast households across a wider premium viewer base. Roku introduced Roku Curate in April 2026 to combine first-party audience insights with purchase behavior data from launch partners, which strengthens its position in outcome-based campaign planning.[4]Roku, “Roku Introduces Roku Curate, a Streamlined Advertising Solution for Better Business Outcomes,” Roku Newsroom, roku.com Magnite launched Magnite Orchestration in June 2026 to connect buyer agents with its seller agents via the Advertising Context Protocol, reflecting the industry's move toward more automated transaction workflows. Xumo's OpenPath integration in January 2026 also showed that publishers want clearer, more direct routes to premium streaming inventory, especially as buyers push for lower friction and greater transparency.
The main competitive divide now runs across three areas such as first-party data depth, supply-path control, and measurement credibility. Companies with strong login ecosystems and household identifiers have an advantage in regulated markets because they can maintain targeting quality even when consent rules limit open web data use. Suppliers that shorten transaction paths or provide more auditable delivery standards can also win a larger share of premium video budgets. At the same time, the OTT advertising market still leaves space for specialists in cross-device frequency management, contextual targeting, and closed-loop attribution, because those capabilities remain uneven across large and small participants.
OTT Advertising Industry Leaders
Alphabet Inc.
Amazon.com, Inc.
Roku, Inc.
Comcast Corporation
The Trade Desk, Inc.
- *Disclaimer: Major Players sorted in no particular order
OTT Advertising Market Companies Covered in this Report
- Alphabet Inc.
- Amazon.com, Inc.
- The Trade Desk, Inc.
- Roku, Inc.
- Comcast Corporation
- Magnite, Inc.
- PubMatic, Inc.
- The Walt Disney Company
- Paramount Global
- Samsung Ads
- LG Ad Solutions
- Xandr, Inc.
- Viant Technology Inc.
- Index Exchange, Inc.
- OpenX Technologies, Inc.
- LiveRamp Holdings, Inc.
- Criteo S.A.
- Innovid Corp.
- AdTheorent Holding Company, Inc.
- Yahoo Inc.

Recent Industry Developments in OTT Advertising Market
- June 2026: Omnicom Media became Netflix's first data collaboration partner for AI-powered ad creatives, combining Acxiom audience intelligence with Netflix's AI-enabled ad format technology. The collaboration delivers closed-loop first-party measurement and enables personalized advertising experiences tailored to Netflix viewers' content habits.
- June 2026: Magnite launched Magnite Orchestration, a coordination layer enabling buyer agents to connect directly to Magnite's seller agent and access the company's premium CTV inventory pool via the Advertising Context Protocol. Early tests launched with dentsu and DIRECTV Advertising, positioning Magnite as the first SSP to deploy commercially ready agentic advertising infrastructure at scale.
- June 2026: Mediaocean launched NIVO AI, powered by Innovid agents, delivering workflow efficiency gains of up to 90% in campaign setup speed compared with manual processes, as confirmed by pilot programs with brands including Canvas, FanDuel, and Optimum. NIVO AI automates creative, delivery, measurement, and optimization workflows through natural language orchestration.
- April 2026: Roku introduced Roku Curate, a streamlined advertising solution combining Roku's first-party audience insights with purchase behavior data from launch partners including Best Buy Ads, Criteo, Fandango, Fetch, Instacart, and Kroger, enabling closed-loop measurement tied to real-world sales outcomes.


Global OTT Advertising Market Report Scope
The OTT Advertising market comprises the sale, delivery, management, and monetization of digital advertisements served through over-the-top (OTT) streaming platforms that distribute video content over the internet without relying on traditional cable or satellite television infrastructure. The market includes advertising inventory delivered across subscription-supported, ad-supported, and hybrid streaming services, enabling advertisers to reach audiences through connected TVs, mobile devices, computers, and other internet-enabled devices. Revenue is generated from the purchase and sale of advertising inventory, including programmatic and direct advertising transactions, across OTT video platforms.
The OTT Advertising Market Report is Segmented by Ad Placement (Pre-roll ads, Mid-roll ads, and Post-roll ads), Ad Format (Video Ads, Display Ads, Interactive Ads, and Other Ad Formats), Platform Type (Smartphones and Tablets, Smart TVs, Laptops and Desktops, Other Device Types), End User (Media and Entertainment, Retail and E-Commerce, Automotive, Healthcare and Pharmaceuticals, Financial Services, Travel and Hospitality, and Other End Users), Geography (North America, South America, Europe, Asia-Pacific, Middle East, and Africa). The Market Forecasts are Provided in Terms of Value (USD).
| Pre-roll ads |
| Mid-roll ads |
| Post-roll ads |
| Video Ads |
| Display Ads |
| Interactive Ads |
| Other Ad Formats |
| Smartphones and Tablets |
| Smart TVs |
| Laptops and Desktops |
| Other Device Types |
| Media and Entertainment |
| Retail and E-Commerce |
| Automotive |
| Healthcare and Pharmaceuticals |
| Financial Services |
| Travel and Hospitality |
| Other End Users |
| North America | United States |
| Canada | |
| Mexico | |
| South America | Brazil |
| Argentina | |
| Chile | |
| Rest of South America | |
| Europe | Germany |
| United Kingdom | |
| France | |
| Italy | |
| Spain | |
| Rest of Europe | |
| Asia-Pacific | China |
| Japan | |
| India | |
| South Korea | |
| Australia | |
| Rest of Asia-Pacific | |
| Middle East | Saudi Arabia |
| United Arab Emirates | |
| Qatar | |
| Rest of Middle East | |
| Africa | South Africa |
| Egypt | |
| Nigeria | |
| Rest of Africa |
| By Ad Placement | Pre-roll ads | |
| Mid-roll ads | ||
| Post-roll ads | ||
| By Ad Format | Video Ads | |
| Display Ads | ||
| Interactive Ads | ||
| Other Ad Formats | ||
| By Platform Type | Smartphones and Tablets | |
| Smart TVs | ||
| Laptops and Desktops | ||
| Other Device Types | ||
| By End User | Media and Entertainment | |
| Retail and E-Commerce | ||
| Automotive | ||
| Healthcare and Pharmaceuticals | ||
| Financial Services | ||
| Travel and Hospitality | ||
| Other End Users | ||
| By Geography | North America | United States |
| Canada | ||
| Mexico | ||
| South America | Brazil | |
| Argentina | ||
| Chile | ||
| Rest of South America | ||
| Europe | Germany | |
| United Kingdom | ||
| France | ||
| Italy | ||
| Spain | ||
| Rest of Europe | ||
| Asia-Pacific | China | |
| Japan | ||
| India | ||
| South Korea | ||
| Australia | ||
| Rest of Asia-Pacific | ||
| Middle East | Saudi Arabia | |
| United Arab Emirates | ||
| Qatar | ||
| Rest of Middle East | ||
| Africa | South Africa | |
| Egypt | ||
| Nigeria | ||
| Rest of Africa | ||


Key Questions Answered in the Report
What is the current and forecast value of the OTT advertising market?
The OTT advertising market was valued at USD 121.67 billion in 2025, is estimated at USD 136.42 billion in 2026, and is forecast to reach USD 213.78 billion by 2031 at a 9.40% CAGR.
What is driving growth in OTT advertising?
The strongest growth driver is the shift of video budgets from linear television into streaming, supported by ad-supported inventory expansion, wider programmatic buying, and better use of first-party audience data.
Which ad placement leads revenue in OTT advertising?
Mid-roll ads led ad placement revenue with a 43.12% share in 2025, because they sit inside active viewing moments and continue to support premium monetization.
Which ad format is growing the fastest in streaming advertising?
Interactive ads are the fastest-growing format, with a projected 10.54% CAGR through 2031, as streaming platforms add more commerce and measurable engagement features.
Which platform type is most important for advertisers?
Smart TVs held a 51.29% share in 2025 and remain the main premium screen, while smartphones and tablets are the fastest-growing platform group at a 10.43% CAGR.
Which end-user segment is growing the fastest?
Media and entertainment remained the largest end-user segment with a 38.43% share in 2025, while retail and e-commerce is projected to grow the fastest at a 10.78% CAGR through 2031.
Page last updated on:





